SPECIAL CLIMATE STATEMENT 73-EXTREME HEAT AND FIRE WEATHER IN DECEMBER 2019 AND JANUARY 2020 - 17 MARCH 2020 - BOM
←
→
Page content transcription
If your browser does not render page correctly, please read the page content below
Special Climate Statement 73—extreme heat and fire
weather in December 2019 and January 2020
17 March 2020
Special Climate Statement 73—extreme heat and fire weather in December 2019 and January 2020

Table of contents
Summary .......................................................................................................................................................... 3

1.       Preceding climate conditions, drivers and description of the event ....................................................... 4

2.       Extreme heat in December 2019 and January 2020 ............................................................................. 5

3.       Fire weather in December 2019 and January 2020 ............................................................................... 9

Tables ............................................................................................................................................................. 12

References and further information ................................................................................................................ 17

Version number/type                  Date of issue                          Comments
1.0                                  17 March 2020

                 Unless otherwise noted, all images in this document except the cover photo are licensed
under the Creative Commons Attribution Australia Licence.

© Commonwealth of Australia 2020

Published by the Bureau of Meteorology

Cover image: Sunrise at Gan Gan Lookout, Port Stephens, by Mark Wilgar, October 2019.

                                                                                                                                                                          2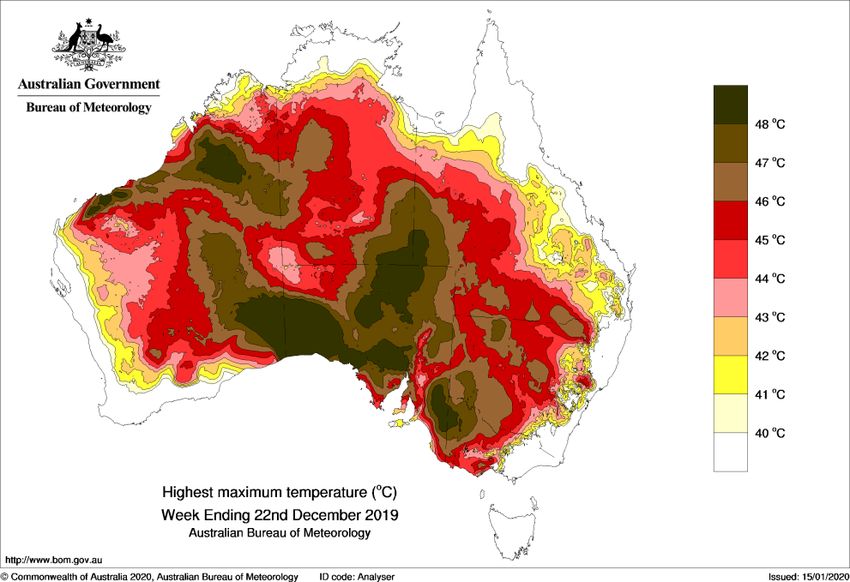
Special Climate Statement 73—extreme heat and fire weather in December 2019 and January 2020

Summary
 •   18 December 2019 was the hottest Australia-wide (area averaged) day on record, peaking at 41.88 °C.

 •   In December 2019 there were 11 days in which the national area-averaged maximum was 40 °C or above.
     Prior to December 2019 there had been only 11 such days recorded since 1910, seven of which occurred
     in the summer of 2018–19.

 •   2019 was the warmest December on record Australia-wide and for all mainland States except Victoria.
     2019−20 went on to be the second-warmest summer on record Australia-wide, and for area-averaged
     Queensland, the Northern Territory, and Western Australia.

 •   South Australia and the Northern Territory each had their hottest area-averaged day on record. Previous
     records were exceeded on several days, and new peaks were reached for South Australia on
     19 December and for Northern Territory on 25 December.

 •   Numerous high temperature records occurred at individual sites across southern and eastern Australia
     throughout December into early January, and at the end of January

 •   Dangerous fire weather conditions continued from spring 2019 into summer

 •   In 2019, large areas of Australia had their highest accumulated Forest Fire Danger Index (FFDI) for
     December. FFDI records date back to 1950.

 •   2019 had the highest December accumulated FFDI for Australia as a whole, continuing the pattern seen in
     spring

                                                                                                               3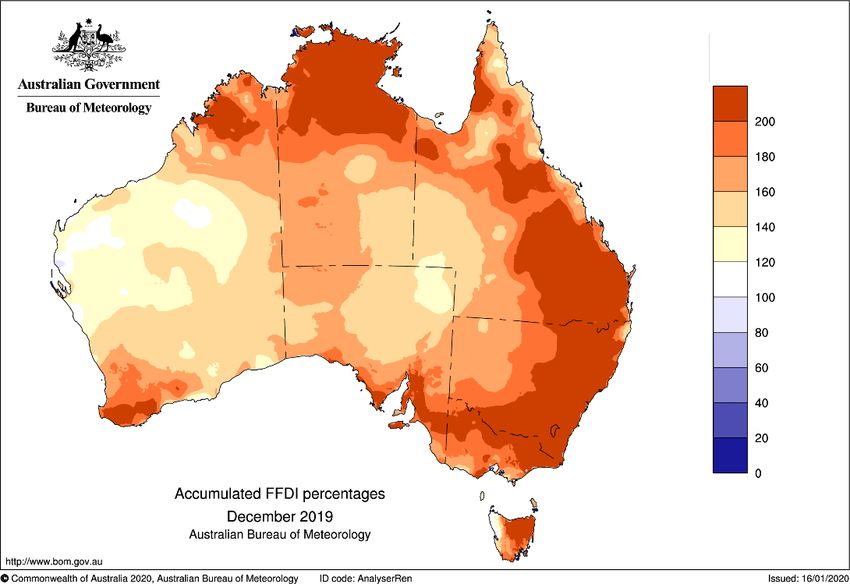
Special Climate Statement 73—extreme heat and fire weather in December 2019 and January 2020

 1. Preceding climate conditions, drivers and description of the
    event
2019 was the warmest and driest year on record for Australia as a whole, and spring was also the driest on record
nationally. Record low rainfall for the year occurred over large areas of inland Australia (Figure 1). Rainfall was
also well below average in the 2018–19 wet season in most parts of tropical Western Australia and the Northern
Territory. This resulted in very low soil moisture levels over most of the continent leading into December.

The very dry conditions continued through December. It was the driest December on record nationally, with rainfall
below average nationwide apart from western Tasmania and parts of Western Australia (Figure 1). Record low
December falls were experienced in scattered parts of northern and eastern Australia. Most areas of South
Australia, New South Wales (apart from the northeast), and Victoria (apart from the eastern ranges and the
southwest coast) had less than 10 millimetres for the month.

Figure 1: Rainfall deciles for 2019 (left) and December 2019 (right) (based on all years since 1900).

One of the strongest positive Indian Ocean Dipoles on record was a substantial contributor to the dry conditions in
the second half of the year. The Southern Annular Mode (SAM) was also in a persistent negative phase for much
of the period from September to December (following a marked sudden stratospheric warming over the Antarctic in
early spring), resulting in anomalous westerly flow over southern Australia. In spring and early summer, a negative
phase of the SAM is typically associated with dry conditions in New South Wales and Queensland, and warm
conditions over much of the continent apart from the southeast. The combination of these two climate drivers was
highly favourable for dry conditions in the eastern States and above-average temperatures across the continent.

Heat built up in the northern tropics from the start of December in the absence of any early wet-season rain. Many
sites, apart from those close to exposed coasts, reached 40 °C regularly during the first week of the month. A
number of sites across the north of Western Australia, the Northern Territory and Queensland set December high
temperature records. During the first half of December, Darwin had a record-long sequence of 11 consecutive days
of 35 °C or above. The heat continued in northern Australia throughout most of the month, with only brief
interruptions.

From 12 December onwards, extreme heat moved into the south of Western Australia. Whilst no significant long-
term site records were broken on individual days, the length of the heatwave was highly unusual for December.
Perth Airport had three consecutive days of 40 °C or above in December for the first time, whilst five consecutive
days above 40 °C also set December records at a number of sites in the inland southwest, as well as at Geraldton.
There was also some extreme heat on parts of the east coast during this period, including 41.2 °C at Brisbane,
equalling its December record.

                                                                                                                      4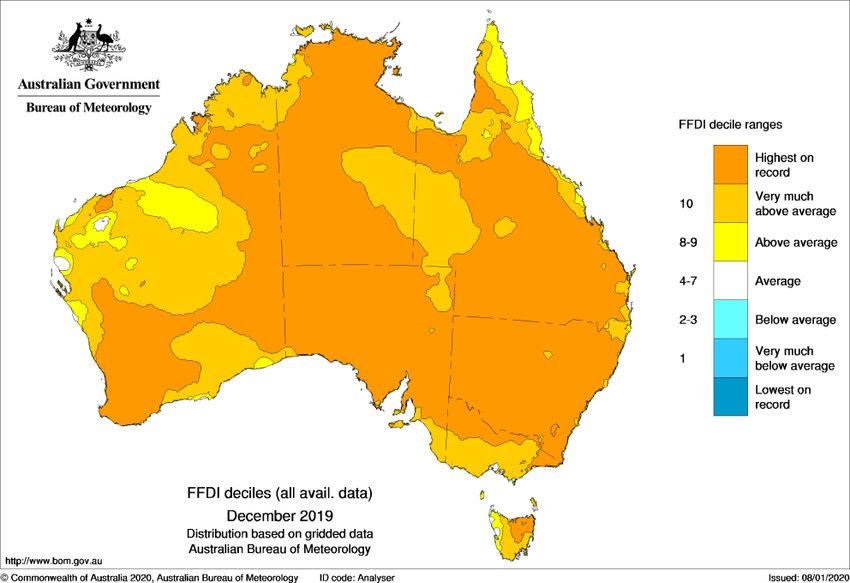
Special Climate Statement 73—extreme heat and fire weather in December 2019 and January 2020

The heat extended more broadly east through southern Australia from 16 December onwards to cover most areas.
The peak of the extreme heat moved progressively east, being centred over the Nullarbor and Eyre Peninsula on
19 December (when the highest temperatures of the event were recorded), eastern South Australia and western
Victoria on 20 December, southern New South Wales on 21 December, and northern inland New South Wales and
southern Queensland on 22 December.

Most of southern Australia had cooled by 22 December, but extreme heat continued in central and northern areas.
Numerous records were set in the central and northern interior of Australia, particularly in the Northern Territory,
from 24 to 26 December. The heat returned to southeastern Australia from the 28 December onwards, peaking on
30 December. Unlike earlier parts of the event, the heat extended to Tasmania, with numerous site records in that
State and also in eastern Victoria. Some of the most significant fire weather conditions of the period occurred on
30 and 31 December as a wind change moved through southeastern Australia. Conditions eased at the national
scale from 31 December as tropical moisture started to move into northern Australia, but there was a further round
of extreme heat in southern Australia in early January 2020, peaking in southern and central New South Wales on
4 January.

There was a significant pattern change after early January, as the positive Indian Ocean Dipole and the negative
Southern Annular Mode broke down, and moisture began to enter northern Australia. There were no further
extreme hot days at the national scale after the first week of January, but a final significant heatwave affected
southeastern Australia at the end of January and start of February, while February was consistently hot across
some parts of northern Australia, with some records set.

    2. Extreme heat in December 2019 and January 2020
A major feature of the heatwave was the extent of the extreme heat. This resulted in area-averaged records for the
hottest day being exceeded for Australia (Table 1), South Australia, and the Northern Territory.

The national area-averaged maximum temperatures were well beyond previous records. Averaged over the
country1, Australia had its hottest day on record on 18 December 2019; the average of 41.88 °C was far above the
previous record of 40.30 °C set on 7 January 2013. Six other days in the month also exceeded the previous
record, with 24 December (41.06 °C) and 19 December (41.01 °C) reaching 41 °C. In total, 11 days during the
month had a national area-averaged maximum of 40 °C or above, seven of them consecutively from 23 to 29
December. Prior to December 2019, there had been only 11 such days on record in Australia since 1910 (seven of
which occurred in the 2018–19 summer). Temperatures this high are indicative of the dangerous heat conditions
that affected large parts of Australia.

Averaged over South Australia, the State had its hottest December day on 18 December (45.33 °C), which was
followed by its hottest day for any month (47.11 °C) on 19 December. The Northern Territory first exceeded its
previous hottest day on record with 43.46 °C on 17 December, and in total had five days above its previous record
of 42.93 °C, peaking at 44.31 °C on 25 December. Victoria (43.08 °C) had its hottest December day on record on
the 20th.

At individual sites, Nullarbor reached 49.9 °C on 19 December, a December record for Australia and the highest
daily maximum in any month since February 1998. Eucla's 49.8 °C on the same day was a December record for

1
  The average is calculated by breaking the Australian continent and the main island of Tasmania up into a 0.05° grid by longitude and latitude—which is
roughly 5km × 5km—with each grid cell assigned a maximum temperature based on the temperatures from the weather stations around it. An area-
weighted average of the grid cells is then calculated.

For daily average temperatures, the average is calculated from the Bureau’s real-time, unadjusted whole-network, gridded temperature data set, which
takes in all available temperature observations each day (around 700 observations). The ranks of this value are cross-checked against the Bureau’s
adjusted climate reference network (ACORN-SAT).

For more information see http://www.bom.gov.au/climate/austmaps/about-temp-maps.shtml.

The daily average maximum temperature uses the AWAP gridded dataset (methodology described in Jones D A et al. (2009), High-quality spatial climate
data-sets for Australia, Australian Meteorological and Oceanographic Journal 58 233-248).

                                                                                                                                                       5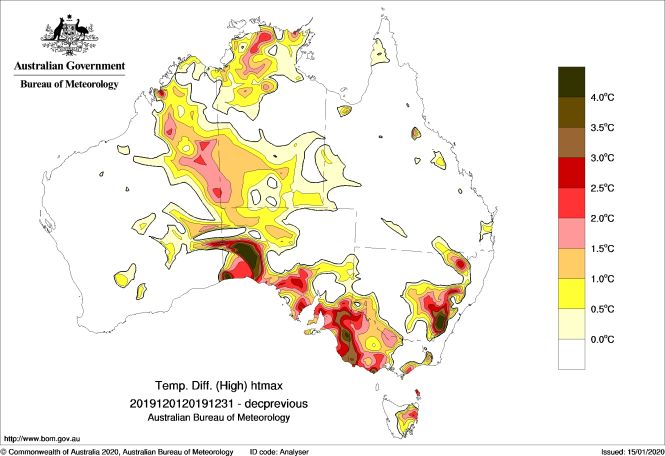
Special Climate Statement 73—extreme heat and fire weather in December 2019 and January 2020

Western Australia. Other readings over 49 °C were at Forrest (49.5 °C) and Keith (49.2 °C); the latter was the
furthest south that 49 °C has been reached anywhere in Australia2. A Victorian December record was set on 20
December, with 47.9 °C at Hopetoun and Horsham - only Black Saturday in 2009 has seen a higher temperature in
Victoria.

On 4 January 2020, the most extreme heat occurred in eastern New South Wales and the Australian Capital
Territory. The temperature reached 48.9 °C at Penrith, the highest known temperature in the Sydney basin
(surpassing 47.8 °C at Richmond in January 1939) and at any site east of the ranges in New South Wales 3. A
number of other sites in metropolitan Sydney, away from the coast, exceeded 47 °C. Canberra reached 44.0 °C,
1.2 °C above the previous record for any Australian Capital Territory site. The value at Penrith was a new record
high value for any metropolitan area in Australia. Such temperatures are dangerously hot, and place extreme
thermal stress on humans and the environment.

A final period of extreme heat affected southeastern Australia at the end of January and the start of February, with
a number of locations in Tasmania, northeastern Victoria, and southern and eastern New South Wales setting
record high maximum temperatures on 31 January and 1 February. Canberra reached a February record high
maximum temperature of 42.7 °C on 1 February, meaning that records were set there in all three summer months.
Braidwood, which also reached a February record on this day, set records in five consecutive months from October
to February. Cabramurra reached its highest temperature on record, 34.0 °C 4, on 31 January.

Unlike earlier in the summer, extreme high minimum temperatures were widespread during this period in early
February. Two different sites at Condobolin, the airport and the Agricultural Research Station, both had a minimum
temperature of 34.7 °C on 1 February, the highest on record for New South Wales for February. 26.7 °C on 2
February was the hottest night on record at Canberra Airport5.

Large numbers of sites set December records, with some setting all-time records, particularly in the Nullarbor
region, and in parts of eastern South Australia and western Victoria. Mount Gambier's 45.9 °C on 20 December
was 1.7 °C above its previous record for any month. In total, 47 of the 111 currently operating ACORN-SAT
stations6 set December records, 12 of which were records for any month (Table 3). A further two all-month records
were set or equalled in early January, making a total of 14 ACORN-SAT locations that set new all-month high
temperature records during the event. The previous largest number of records set in the ACORN-SAT network in a
single month was September 2017, when monthly records were set at 32 locations.

There were also some notable runs of consecutive hot days during December. Darwin had 11 consecutive days of
35 °C or above from 3 to 13 December, a record for any time of year, surpassing the 7-day runs in December 2004
and October 2019. Ceduna had three consecutive days of 45 °C or above for the first time. Whilst southwestern
Western Australia did not see any significant records for individual days, a number of sites set records for
consecutive December days of 40 °C or above in mid-month, including Perth Airport (three days) and Geraldton,
Dalwallinu and Merredin (all had five consecutive days).

There were very large numbers of hot days in the month in some regions, particularly in northern Australia and the
south of Western Australia. In the north, Darwin had 21 days of 35 °C or above, easily the largest number in any
month (exceeding 13 days in October 2009). Jabiru Airport, which had never previously reached 40 °C in
December, did so on ten occasions in December 2019, whilst Tindal RAAF (near Katherine) reached 40 °C on 23
days in the month, more than it had ever experienced in a full year prior to 2019. In Western Australia, Dalwallinu

2   Higher than the World Meteorological Organization (WMO)-recognised record for South America, and further south than anywhere in Africa.

3   The only known higher observations on record anywhere in New South Wales were at Menindee, Walgett, and Wilcannia.

4 The Cabramurra site was affected by fire on 4 January. While it is possible that 34.0 °C was exceeded there that day, the point at which radiant heat
from the fires began to influence the temperature observations cannot be determined with any certainty.

5   The former Acton site at Canberra had a minimum of 27.2 °C on 14 January 1939.

6
 The ACORN-SAT network is the Bureau's long-term temperature reporting network. It includes 112 stations, one of which was not reporting in
December 2019.

                                                                                                                                                          6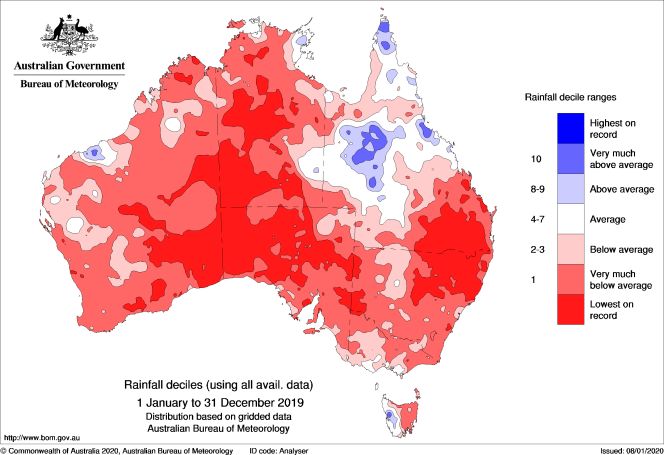
Special Climate Statement 73—extreme heat and fire weather in December 2019 and January 2020

reached 40 °C on 13 days and Cunderdin on 12 days, both records for any month. Perth Airport's six days of 40 °C
is a December record, and only exceeded by seven days in January 1956. Canberra's 11 days of 35 °C or above
was only exceeded by January 2019 (19 days) and January 2017 (12 days).

There were some very high minimum temperatures at times during December, most notably on 20 December in
South Australia as a change approached. Marree Airport's 34.9 °C that day was the second-highest December
minimum on record for Australia and a South Australian State December record, whilst numerous other site
records were set.

Conversely, dry air, and the relatively short duration of extreme heat in the area, resulted in some very large
diurnal temperature ranges on 20 December in southern Victoria and Tasmania. Melbourne's diurnal range of
29.8 °C (maximum 43.5 °C, minimum 13.7 °C) is its largest of the post-1900 period, whilst 34.8 °C at Westmere
(45.4 °C/10.6 °C) is the largest known diurnal range at a Victorian site. Such large ranges in daily temperature are
an indication of a very dry landscape.

While minimum temperatures were not as extreme at the national level as daytime maximum temperatures, 25
December was still the warmest December night on record averaged over Australia, with a national average of
25.02 °C. It was the second-warmest night on record for any month, just behind 25.08 °C on 22 January 2019.
Combining daytime and night-time temperatures, the five highest daily mean temperatures on record for Australia
occurred during December 2019, with the highest being 32.99 °C on 18 December, 0.36 °C above the previous
record set in January 2019.

Overall, December 2019 had the highest area-averaged maximum (4.15 °C above the 1961–90 average),
minimum (+2.26 °C) and mean (+3.21 °C) temperatures on record for Australia (Figure 2). The maximum and
mean values were both the largest anomalies on record for any month (surpassing +3.60 °C and +3.03 °C
respectively, both in October 2015), and it was the first time any month has had a mean maximum 4 °C or more
above average. In absolute terms, the national area-average maximum (38.39 °C) was also the warmest for any
month, exceeding the 37.99 °C in January 2019. Every State and mainland Territory except for Victoria (2nd
highest) and Tasmania (30th highest) had its highest mean maximum temperature on record (Table 3), with South
Australia breaking its previous record by more than 2 °C. All States and Territories also had record December
monthly mean temperatures, with South Australia and Western Australia also having their warmest December
minimum temperatures on record. Whilst mean temperatures were not as far above average in January and
February—in particular, February was relatively cool in the southeast—the very high temperatures in December
were a major contributor to summer 2019−20 being the second-warmest on record for Australia (after 2018−19). It
was also the second-warmest for Queensland, the Northern Territory, and Western Australia.

Figure 2: Maximum temperature deciles (left), minimum temperature deciles (middle), and mean temperature
deciles (right) for December 2019 (based on all years since 1910).

                                                                                                                       7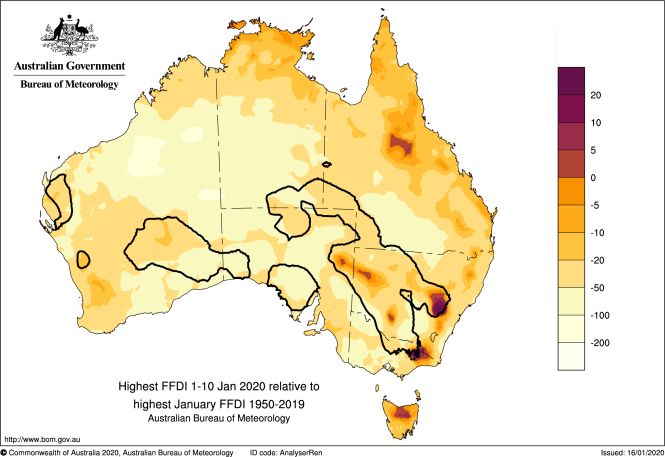
Special Climate Statement 73—extreme heat and fire weather in December 2019 and January 2020

Figure 3: Difference between the highest daily maximum temperature in December 2019 and the previous highest
on record for December (1910–2018) (left). Composite locations with 30 or more years of data that had their
hottest December day on record (right).

Figure 4: Highest daily maximum temperature from 16–22 December 2019.

                                                                                                                 8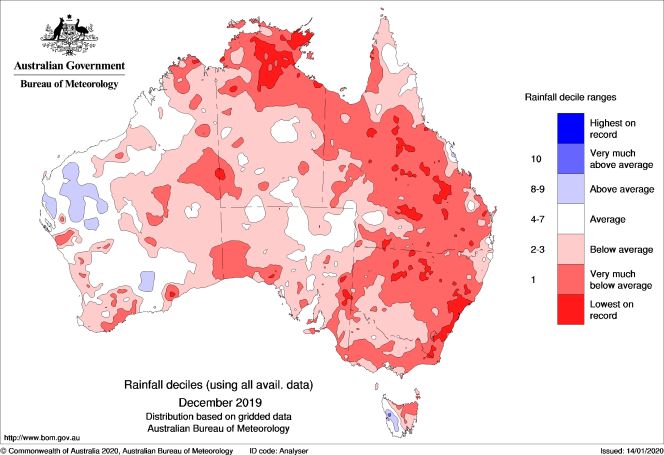
Special Climate Statement 73—extreme heat and fire weather in December 2019 and January 2020

    3. Fire weather in December 2019 and January 2020
The hot conditions combined with the dry landscape and strong winds to produce dangerous fire weather
conditions during December 2019 into early January 2020, extending on those reported previously 7.

The Forest Fire Danger Index (FFDI) is one common measure of fire weather conditions and reflects longer-term
rainfall and temperature patterns and shorter-term weather. Fire risk is driven by fire weather and fuel availability.
The severe rainfall deficiencies and hydrological drought 8 exacerbated the fire weather conditions.

Daily FFDI values can be accumulated (summed) over longer periods of time and the accumulated FFDI values for
spring 2019 were the highest on record for Australia as a whole (based on all years since 1950), with record high
values observed in areas of all States and Territories.

Those dangerous fire weather conditions continued into summer, with December accumulated FFDI values highest
on record across large areas of the country (Figure 5). Accumulated FFDI values for December were more than
twice the average over large areas of Australia (Figure 6) and the accumulated FFDI value for December was
highest on record (Figure 7). The area-averaged accumulated FFDI values for December were also highest on
record for each State and Territory except Tasmania (second-highest). That included the highest accumulated
FFDI for any month in Queensland, New South Wales, the ACT, and South Australia. For Queensland, the
Northern Territory, and Western Australia, December 2019 continued a run of three consecutive months of highest
FFDI on record.

Figure 5: Accumulated FFDI deciles for December 2019 (based on all years since 1950).

7   For more information see Special Climate Statement 72—dangerous bushfire weather in spring 2019.

8
 For more information see Special Climate Statement 70—drought conditions in eastern Australia and impact on water resources in the Murray–Darling
Basin.

                                                                                                                                                     9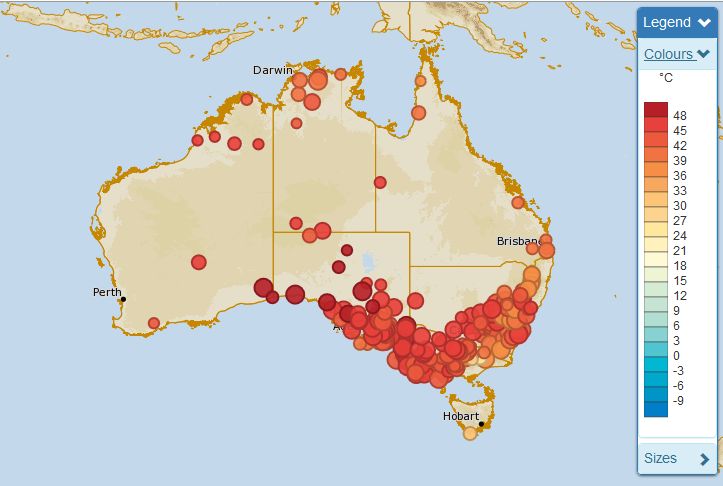
Special Climate Statement 73—extreme heat and fire weather in December 2019 and January 2020
Figure 6: Accumulated FFDI percentages for December 2019 compared to the long-term mean for 1950–2018.
Figure 7: December accumulated FFDI for Australia since 1950.
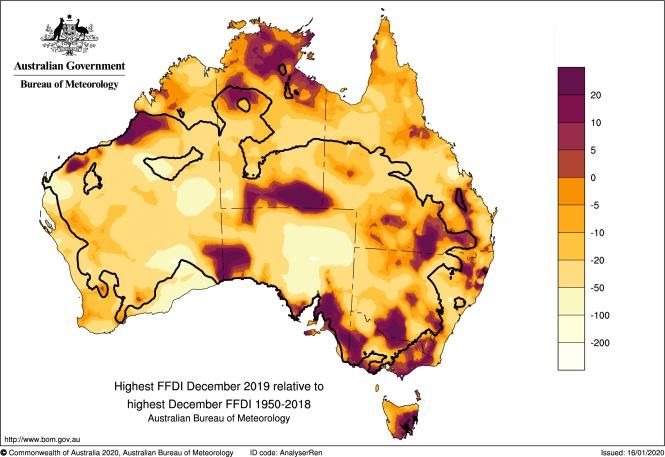
There were also individual days with FFDI values very much above average or highest on record for December
across large areas of the country. During December, daily FFDI values of 100 or above (catastrophic or code red
category) were observed in all mainland States and the Northern Territory, and many areas had their highest FFDI
on record for December (Figure 8). December began with daily FFDI values above 100 in northern Western
Australia, but later in the month the highest daily FFDI values were across central and southern Australia. FFDI
values were 100 or above across areas of southern South Australia, New South Wales, and Victoria on 20 and 30
December. There were similarly high values in southern areas of Western Australia on 19 and 29 December, as
the high temperatures and areas of strong winds moved from west to east across the country.
10Special Climate Statement 73—extreme heat and fire weather in December 2019 and January 2020
Dangerous fire weather conditions continued into early January, with daily FFDI values above 75 (extreme
category) in areas of Victoria, New South Wales, and South Australia on several days between 1 and 10 January.
Some areas in eastern Victoria, northern Tasmania, and across parts of New South Wales had their highest daily
FFDI values on record for January (Figure 8).
Figure 8: Difference between the highest daily FFDI during December 2019 (left) or 1–10 January 2020 (right),
and the previous highest on record for the respective month (based on all years since 1950). Areas of dark colours
had their highest FFDI on record for the month. The black contour lines enclose areas that had daily FFDI values
of 75 or above (extreme category) on at least one day during the month.
Fire weather conditions generally eased back from record levels in the second half of January, but accumulated
FFDI values for January 2020 as a whole were very much above average over southern and western New South
Wales, northeast Victoria, eastern Tasmania, and southwest Western Australia. There was also a final episode of
significant fire weather affecting southeast Australia, particularly southeast New South Wales and eastern Victoria,
at the end of January and start of February, whilst early February saw some periods of significant fire weather in
southern Western Australia. New South Wales had its fourth-highest accumulated FFDI for January on record
since 1950, and Tasmania had its third-highest accumulated FFDI for January.
11Special Climate Statement 73—extreme heat and fire weather in December 2019 and January 2020
Tables
Table 1: Highest daily area averages for Australia (values in December 2019 shown in bold).
Maximum temperature (°C) Minimum temperature (°C) Mean temperature (°C)
41.88 18/12/2019 25.08 22/1/2019 32.99 18/12/2019
41.06 24/12/2019 25.02 25/12/2019 32.90 24/12/2019
41.01 19/12/2019 24.90 29/12/2019 32.82 19/12/2019
40.97 17/12/2019 24.93 16/1/2019 32.75 29/12/2019
40.61 29/12/2019 24.91 23/1/2019 32.75 25/12/2019
40.48 25/12/2019 24.89 25/1/2019 32.63 22/1/2019
40.33 23/12/2019 24.78 27/12/2019 32.47 16/1/2019
40.30 7/1/2013 24.76 18/1/2019 32.45 15/1/2019
40.29 20/12/2019 24.74 24/12/2019 32.42 20/12/2019
40.26 15/1/2019 24.69 23/1/1982 32.40 27/12/2019
Table 2: National and State monthly area-averaged temperature (°C) anomalies (from 1961−90 average) for
December 2019.
Region Maximum temperature Mean temperature Minimum temperature
Value Rank Previous Value Rank Previous Value Rank Previous
record record record
Australia +4.15 1 +2.41 (2018) +3.21 1 +2.13 (2018) +2.26 1 +1.85 (2018)
WA +4.25 1 +2.87 (1972) +3.35 1 +2.59 (1972) +2.44 1 +2.31 (1972)
NT +4.01 1 +3.28 (2018) +3.12 1 +2.88 (2018) +2.23 2
SA +5.28 1 +3.01 (1972) +4.09 1 +2.53 (2015) +2.89 1 +2.32 (1965)
Queensland +3.65 1 +2.87 (2005) +2.74 1 +2.39 (2005) +1.83 5
NSW +4.31 1 +2.93 (1990) +3.32 1 +2.93 (2018) +2.34 3
Victoria +3.13 2 +2.22 3 +1.31 13
Tasmania +0.96 30 +0.51 33 +0.05 49
12Special Climate Statement 73—extreme heat and fire weather in December 2019 and January 2020
Table 3: Highest daily maximum temperature for December, January or February at locations in the ACORN-SAT
dataset (records for any month highlighted in bold).
Site number(s) Location State Value Date Previous record
(°C)
1019/1021 Kalumburu WA 42.9 6/12 42.6 (20/12/2018)
2079/2012/2011 Halls Creek WA 45.0 18/12 44.9 (16/12/1972) (Dec)
45.0 (8/11/1988) (all)
11003 Eucla WA 49.8 19/12 47.4 (27/12/2013) (Dec)
48.6 (23/1/2019) (all)
11052/11004 Forrest WA 49.5 19/12 46.5 (27/12/2013)
13017 Giles WA 46.8 25/12 45.1 (5/12/2014, 28/12/2018)
(Dec)
45.7 (16/1/2013) (all)
14015 Darwin NT 37.1 9/12 37.0 (18/12/1976)
14825 Victoria River Downs NT 44.7 (=) 7/12 44.7 (11/12/2018)
15590/15540 Alice Springs NT 45.7 25/12 45.6 (29/12/2018) (Dec)
45.6 (29/12/2018, 3/1/2019) (all)
15666/15548 Rabbit Flat NT 47.9 25/12 47.1 (12/12/2018, 19/12/2018)
(Dec and all)
16001 Woomera SA 48.2 20/12 46.2 (28/12/2018) (Dec)
48.1 (25/1/2011) (all)
17043/17114 Oodnadatta SA 48.4 19/12 48.3 (19/12/2019)
18012 Ceduna SA 48.9 19/12 47.3 (30/12/1976) (Dec)
48.6 (24/1/2019) (all)
18044 Kyancutta SA 48.0 20/129 46.4 (27/12/1961)
18192/18070 Port Lincoln SA 45.6 20/12 43.9 (31/12/1904)
21133/21046 Snowtown SA 46.9 20/12 45.2 (19/12/2015)
22823/22801 Cape Borda SA 40.0 18/12 38.5 (19/12/2013) (Dec)
40.0 (28/1/2009) (all)
23000/23090 Adelaide SA 45.3 19/12 44.2 (31/12/1904)
23373/23321 Nuriootpa SA 44.7 20/12 42.2 (27/12/2018)
26021/26020 Mount Gambier SA 45.9 20/12 43.3 (31/12/2007) (Dec)
44.2 (2/2/2014) (all)
27045/27042 Weipa QLD 38.9 8/12 38.8 (11/12/2016)
29077/29004 Burketown QLD 43.8 (=) 26/12 43.8 (8/12/1934)
44.4 19/1 44.2 (20/1/1985) (Jan)
44.4 (8/11/1965) (all)
31011 Cairns QLD 40.0 15/2 39.5 (21/2/2019)
39083 Rockhampton QLD 41.9 16/12 41.5 (30/12/2013)
43109/43034 St. George QLD 45.9 22/12 45.5 (29/12/2013)
50017/73054 West Wyalong NSW 44.6 21/12 43.6 (31/12/2005)
53115/53048/53027 Moree NSW 45.9 22/12 45.8 (3/12/1913)
56242/56017 Inverell NSW 41.8 22/12 40.8 (3/12/1913)
61078 Williamtown NSW 45.5 4/1 44.8 (18/1/2013) (Jan)
45.5 (11/2/2017) (all)
61363/61089 Scone NSW 45.3 21/12 43.6 (23/12/1990) (Dec)
44.6 4/1 44.2 (12/1/2013) (Jan)
63005 Bathurst NSW 40.3 21/12 38.9 (27/12/1938) (Dec)
41.0 4/1 40.6 (13/1/1939) (Jan)
65070/65012 Dubbo NSW 44.9 21/12 42.8 (18/12/1938, 28/12/1949)
9 2-day maximum for 19–20 December 2019.
13Special Climate Statement 73—extreme heat and fire weather in December 2019 and January 2020
67105/67033 Richmond NSW 45.0 31/12 43.7 (21/12/1994)
68072/68076 Nowra NSW 45.6 21/12 43.0 (17/12/2009) (Dec)
45.4 (18/1/2013) (all)
70351/70014/70099 Canberra ACT 41.1 21/12 39.7 (27/12/1938) (Dec)
44.0 4/1 42.8 (11/1/1939) (Jan, all)
42.7 1/2 42.2 (1/2/1968) (Feb)
72161/72091 Cabramurra NSW 30.3 20/12 29.6 (31/12/2005)
34.0 31/1 32.4 (16/1/2014) (Jan, all)
74258/74128 Deniliquin NSW 46.5 20/12 44.8 (31/12/2005)
76031/76077 Mildura VIC 46.8 20/12 45.1 (31/12/2005)
78015/78031 Nhill VIC 47.1 20/12 46.0 (31/12/2005) (Dec)
47.1 (7/2/2009) (all)
80023 Kerang VIC 46.6 20/12 45.0 (31/12/2005)
84145/84030 Orbost VIC 43.1 30/12 41.3 (30/12/2003, 20/12/2015)
85072/85133 Sale VIC 42.1 30/12 41.1 (24 and 25/12/1920,
27/12/1940)
85096 Wilsons Promontory VIC 40.2 30/12 38.3 (24/12/1920)
87031 Laverton VIC 45.2 20/12 44.3 (31/12/2005)
90015 Cape Otway VIC 43.4 20/12 40.5 (10/12/1980) (Dec)
43.3 (24/1/1982) (all)
91311/91104 Launceston Airport TAS 35.2 30/12 34.7 (29/12/1979)
94010 Cape Bruny TAS 38.0 30/12 37.2 (26/12/1945)
94029 Hobart TAS 40.8 30/12 40.6 (30/12/1897)
94220/94069 Grove TAS 39.4 30/12 37.2 (11/12/1998)
96003 Butlers Gorge TAS 32.7 30/12 32.6 (19/12/2015)
14Special Climate Statement 73—extreme heat and fire weather in December 2019 and January 2020
Table 4: Monthly mean maximum temperatures at ACORN-SAT locations which were the highest on record for
December. Values shown in bold are records for any month.
Site number(s) Location State Value Previous record10
(°C)
1019/1021 Kalumburu WA 39.8 39.6 (Dec 2018) (Dec)
39.8 (Nov 1969) (all)
2079/2012/2011 Halls Creek WA 41.8 41.5 (Dec 2018) (Dec, all)
3003/3002 Broome WA 36.7 36.3 (Dec 2012)
4032/4002 Port Hedland WA 40.8 39.4 (Dec 1961, 2009) (Dec)
40.6 (Nov 1990) (all)
4106/4020 Marble Bar WA 44.1 (=) 44.1 (Dec 2018)
5007 Learmonth WA 41.0 39.1 (Dec 1979)
7045/7046 Meekatharra WA 40.2 39.7 (Dec 1972)
8296/8093 Morawa WA 38.8 38.3 (Dec 1952)
8297/8039 Dalwallinu WA 37.4 36.4 (Dec 1972)
9021 Perth Airport WA 33.9 32.4 (Dec 1999)
9617/9510 Bridgetown WA 32.8 31.0 (Dec 1909)
9789/9541 Esperance WA 28.2 28.1 (Dec 1972)
10092/10093 Merredin WA 37.3 35.8 (Dec 1972)
10286/10035 Cunderdin WA 37.5 35.7 (Dec 1977) (Dec)
37.5 (Jan 2010) (all)
10916/10579 Katanning WA 33.1 32.8 (Dec 1972)
10917/10648 Wandering WA 34.7 33.6 (Dec 1977)
11052/11004 Forrest WA 36.3 35.7 (Dec 1972)
12038/12039 Kalgoorlie WA 37.2 36.5 (Dec 1972)
13017 Giles WA 40.7 38.7 (Dec 1972) (Dec)
40.5 (Jan 2019) (all)
14015 Darwin Airport NT 35.3 34.4 (Dec 2002) (Dec)
34.8 (Oct 2009) (all)
14825 Victoria River Downs NT 41.6 41.3 (Dec 2018) (Dec)
41.5 (Nov 2019) (all)
15135/15087 Tennant Creek NT 41.4 41.3 (Dec 2018)
15590/15540 Alice Springs NT 40.8 39.3 (Dec 1896)
16001 Woomera SA 37.9 35.7 (Dec 2015)
16098/16044 Tarcoola SA 39.2 37.2 (Dec 1972)
17043/17114 Oodnadatta SA 41.6 39.9 (Dec 1972)
18012 Ceduna SA 32.0 31.7 (Dec 2015)
18044 Kyancutta SA 35.8 35.4 (Dec 2015)
21133/21046 Snowtown SA 34.3 34.1 (Dec 2015)
23373/23321 Nuriootpa SA 31.7 31.3 (Dec 2015)
28004 Palmerville QLD 38.1 (=) 38.1 (Dec 1935)
29077/29004 Burketown QLD 38.9 38.5 (Dec 1959) (Dec, all)
34084/34002 Charters Towers QLD 38.1 (=) 38.1 (Dec 1911) (Dec, all)
37010 Camooweal QLD 42.0 41.7 (Dec 2018) (Dec)
41.9 (Jan 1971) (all)
38026/38002 Birdsville QLD 42.8 41.6 (Dec 1976)
39066/39039 Gayndah QLD 37.5 35.7 (Dec 1911) (Dec)
36.8 (Jan 2003) (all)
39083 Rockhampton QLD 35.7 35.4 (Dec 2005) (Dec, all)
39128/39015 Bundaberg QLD 32.5 32.0 (Dec 2005)
10 Excludes months which have 10 or more days of missing data.
15Special Climate Statement 73—extreme heat and fire weather in December 2019 and January 2020
40004 Amberley QLD 34.6 34.3 (Dec 1957) (Dec)
34.4 (Jan 1942) (all)
40043 Cape Moreton QLD 28.5 (=) 28.5 (Dec 2005)
42112/42023 Miles QLD 37.2 37.0 (Dec 1938)
45025/45017 Thargomindah QLD 40.5 39.3 (Dec 1979)
46012/46043 Wilcannia NSW 37.7 37.2 (Dec 1972, 1990)
50017/73054 West Wyalong NSW 34.8 33.5 (Dec 2018)
56242/56017 Inverell NSW 34.5 34.2 (Dec 1957)
61363/61089 Scone NSW 35.3 34.7 (Dec 1957)
63005 Bathurst NSW 31.6 30.6 (Dec 1990)
65070/65012 Dubbo NSW 35.8 35.6 (Dec 1913)
68072/68076 Nowra NSW 29.2 28.4 (Dec 2016)
70351/70014/70099 Canberra ACT 31.7 29.7 (Dec 1972)
72150/72151 Wagga Wagga NSW 33.6 33.4 (Dec 1913)
72161/72091 Cabramurra NSW 21.4 20.7 (Dec 1972)
74258/74128 Deniliquin NSW 33.9 33.6 (Dec 2018)
76031/76077 Mildura VIC 34.7 34.5 (Dec 2015)
80023 Kerang VIC 33.4 (=) 33.4 (Dec 2015)
16Special Climate Statement 73—extreme heat and fire weather in December 2019 and January 2020
References and further information
National gridded rainfall analyses are for the period since 1900 and national gridded temperature analyses are for
the period since 1910.
In general, only temperatures measured since the introduction of standard instrument shelters (Stevenson
screens) are considered in this statement. This is generally around 1910 but is earlier (mostly by 1895) at most
South Australian, Queensland, and Tasmanian locations. At Eucla, a Stevenson screen was not installed until
1913, and a small number of sites in New South Wales (including White Cliffs, Scone and Jerrys Plains) did not
have Stevenson screens installed until the late 1940s.
This Statement in general covers information available as of 9 March 2020.
Links to further information
Australia's changing climate:
State of the Climate 2018
Climate information:
http://www.bom.gov.au/climate/
Australian Landscape Water Balance:
http://www.bom.gov.au/water/landscape
Special Climate Statements
Special Climate Statement 70—drought conditions in eastern Australia and impact on water resources in
the Murray–Darling Basin
Special Climate Statement 72—dangerous bushfire weather in spring 2019
References
Dowdy, A.J., 2018: Climatological Variability of Fire Weather in Australia. Journal of Applied Meteorology and
Climatology, 57, 221–234. https://journals.ametsoc.org/doi/full/10.1175/JAMC-D-17-0167.1
Dowdy, A.J., Ye, H., Pepler, A., Thatcher, M., Osbrough, S.L., Evans, J.P., Di Virgilio, G., McCarthy, N., 2019:
Future changes in extreme weather and pyroconvection risk factors for Australian wildfires. Scientific Reports, 9,
2045-2322. https://www.nature.com/articles/s41598-019-46362-x.pdf
17You can also read