SEEING THE GAP: TRENDS AND RELATIONSHIPS BETWEEN SOCIAL COHESION AND INEQUALITY IN SOUTH AFRICA
←
→
Page content transcription
If your browser does not render page correctly, please read the page content below
Policy Brief 2

SEEING THE GAP: TRENDS AND RELATIONSHIPS
BETWEEN SOCIAL COHESION AND INEQUALITY
IN SOUTH AFRICA

The Poverty and Inequality Institute’s Social Cohesion Index (SCI) 1 assesses
quantitative links and relationships between social cohesion and inequality in South
Africaa. The SCI uses four national data sets to triangulate data points related to the
concepts of solidarity and cooperation, within and across group boundaries.
Computation is based on five dimensions: feeling of belonging, cooperation,
institutional trust, relationships, and identity. We also constructed a Variance
Adjusted SCI for different race groups. The SCI (presented in Brief 1) defines and
measures levels and changes in social cohesion in today’s South Africa. Policy Brief 2
presents factors that drive the levels and changes in the SCI – particularly the role of
inequality.2,3,4 Our findings are based on both objective measures (vertical and
horizontal inequality) as well as individuals’ perceptions of inequalityb.

South Africans remain sharply divided along racial and socioeconomic lines
(Durrheim & Dixon, 2010; MISTRA, 2014; NPC, 2012).5,6 These challenges deepen
existing social problems and may have adverse effects on long-run economic
development and sustainable democracy in the country c. Social cohesion and
nation-building strategies resurface in policy discussions as a way to achieve an
inclusive and united South Africa (Palmary, 2015; Abrahams, 2016).7 Policy
discourse remains at an impasse even though low levels of the SCI reveal that we
have not been successful in moving away substantially from our inequitable and
polarising history.

Social cohesion must be built upon clear, unambiguous societal commitments to
overcome poverty, inequalities, and exclusions and must be done in a way that
actively gives voice and agency to the currently marginalised. Addressing
inequalities, education, and spatial separations are minimum requirements. But

a We  use Burns et al (2018) definition such that social cohesion is understood as the extent to which people are co-operative, within
and across group boundaries, without coercion or purely self-interested motivation.
b Horizontal inequalities relate to living standards between different racial groups within provinces; vertical inequality measures

inequalities between individuals within provinces. See David et al (2018:7).
c For a good overview of South African context see Patel, 2015 as noted in Meiring, T. et al (2018: 5).

                                                     #WorldinCommon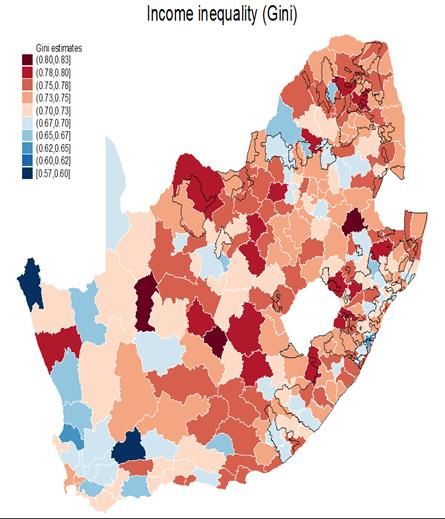
these will not necessarily guarantee a more cohesive society. Our research shows
that social cohesion hinges on overcoming prevailing prejudices, interracial mistrust,
and negative attitudes towards integration.

What we have learned:
If South African policy makers do not understand both tangible and perceived inequalities
and exclusions and how they manifest in society, no manner of policy or implementation
measures will be able to dismantle the legacies of apartheid still entrenched in the day-to-
day realities of community members.

1. Perceived divisions: what do we think divides us? Why does it
matter?d

Individuals’ perceptions of inequality matter
Perceptions show how indiv iduals m ight hav e a sense of injustice against
the distribution of resources and w here and how lack of cohesion is
fostered within and between different communities. Figure 1 show s how
perceiv ed divisions center on four systemic and structural issues – ranked
in order and all linked to the legacy of apartheid. It is hunger that causes
div isions.

d
  See David, A., Guilbert, N., Hino, H., Leibbrandt M., Potgieter, E., Shifa, M. (2018). Social cohesion and inequality in South Africa. Cape Town: SALDRU, UCT.
(SALDRU Working Paper Number 219). This work is also nuanced by a series of eleven focus groups that were conducted in 2016 and 2017 in four provinces in
South Africa. See Lefko-Everett, K., et al (2018) Exploring South Africans’ understanding of social cohesion. Cape Town: SALDRU, UCT. (SALDRU Working Paper
Number 218).

                                                                #WorldinCommon
Figure 1. Perceptions on what divides South Africans (Lefko-Everett et
al, 2017)8

                                                                         “I t is because som e are working whilst
                                                                         others are not.    A person is nothing
                                                                         [without] m oney. Som etim es you get
                                                                         piece jobs, get som e m oney… You
           1. Economics:
                                                                         com e back late from the job and you
           money, class,                    2. Politics:
          unemployment,                patronage, exclusion,             m eet tootsies who take away the little
        poverty, hunger, gap             empty promises                  that you have got. You were hoping
          - rich and poor                                                to go hom e and cook and they take
                                                                         the groceries away. You end up hating
                                                                         people.” (Focus group participant)

                                                                         “I n m ost cases the division in our
                                                                         communities comes from the way the
                                                                         apartheid     governm ent     grouped
                                        4. Culture: tribalism,
                                                                         people according to tribes in terms of
           3. Race, racism,                  customs and
            discrimination                  religious rites,             settlements, even in townships. This
                                               language                  leads to people not being united and
                                                                         underm ining each other because of
                                                                         tribe and languages am ongst b lack
                                                                         people as Africans .” (Focus group
                                                                         participant)

                                                                         What you see depends on where you
          stand: Perceptions of relative inequality

          “There is a big space between rich and poor. The more we have, the
          more we want. And then we forget that there are poor people. The other
          day in Pick n Pay, I saw a person bought some grapes for R50. There are
          people in poor communities that do not even have a piece of bread. The
          divide between the rich and poor is getting bigger and bigger.”(Lefko -
          Everett, 2018)

          The data shows that if you see yourself as the sam e or better off as others
          (financially), you are significantl y l ess likel y to consider inequal ity the
          prim ary social division in South Africa. The im plication is that indiv iduals
          who consider them selves better off do not recognize the perv asive
          inequality in South Africa; the m ost econom icall y privileged are the m ost
          div orced from the plight of inequality in the country (Figure 2).

                                                            #WorldinCommon
Figure 2. Population group perceptions of inequality (relative to each other) (Meiring, T. et al, 2018)
White Economically better off, on average, but do not recognise inequality as a primary
social division to the same extent as other population groups.
Coloured and More likely to consider income inequality as the biggest divide; Coloured
Indian/Asian respondents are more likely to report feeling worse off than other groups
Women More likely than men to consider the gap between rich and poor to be the
primary source of division in society.
Educated People with higher levels of education are significantly less likely to perceive
inequality as a primary social division.
Unemployed Pensioners, homemakers, students consider the gap between rich and poor to be
a bigger issue.
Formally People who live in formal housing, as opposed to informal or traditional housing,
housed are less likely to consider inequality as a main source of social division.
2. Trends and relationships: Social cohesion since 19949
Inter-racial interactions (IRIs) and inequality:
Given South Africa’s history of l ong -term racial and socioeconomic
segregation, we use inter-racial interactions (IRIs) as our main
approxim ation of social cohesion as it represents the social relations
dim ension of the SCI e. This m easure of inequality show s how respondents
perceiv e the gap between rich and poor since 1994. How people perceive
inequality (or not) determines the likelihood of inter -racial interactions.
- Nationally, IRIs improved slightly (2003 -2013) and then declined. The
percentage of South Africans w ho never interacted or social ised
inter-raciall y decreased over the sam e period.
- However, less than 1/3 of South Africans often or always talked or
socialised with someone from a difference racial group (2003 -2013)
- No improvement of IRI among all race groups. From 2009 onward
social cohesion declines (in our aggregate Social Cohesion Index).
- Education is a significate factor in explaining IRIs. Individuals with
higher levels of education (M atric and abov e) are more l ikel y to
engage in actual IRIs and report m ore desire to interact.
e
IRIs are based on South African Reconciliation Barometer Surveys (SARBS) and the Living Standards Measure (LSM) data sets which enable us to
distinguish between two different types of social interactions: 1) how often do people talk to individuals from other racial groups on an everyday
basis and 2) how often do people socialize with individuals from other racial groups. The LSM assesses levels of well-being and inequality based on
dwelling type, access to services (water, sanitation, electricity, telecommunications, and home security), ownership of household consumer items
(refrigerator, microwave oven, and television), access to domestic workers, and residence in a rural or metropolitan area. SARBS also reports
respondents’ perceptions of whether inequality improved, worsened or remained constant in recent periods in South Africa vs. 1994 levels.
#WorldinCommonObjective and perception data tell two different stories:
Objective data shows that vertical inequality (between individuals),
as measured by the Gini coefficient of the Living Standard Measure
(LSM), slightly increased from 2003 to 2008, then significantly
declined in 2012. Horizonta l inequality (between race groups; ), as
measured by the LSM, steadily declined between 2003 and 2012 –
consistent with significant progress in the provision of basic services
(i.e. water, electricity) and ownership of household assets in South
Africa.
However, perception data highlights two main points:
- Approxim atel y 70 percent of South Africans perceiv ed that the
extent of inequal ity (the gap betw een the poor and the rich) has
not changed much or has w orsened over tim e.
- Prov inces with higher vertical ine quality (betw een individuals) have
lower social cohesion com pared to those with less inequality
(m easured using the aggregate SCI).
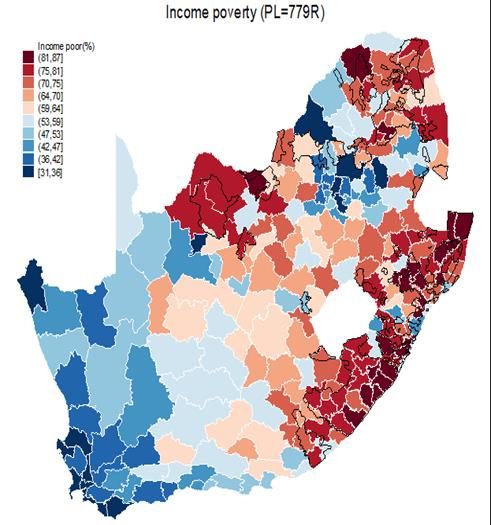
3. Municipalities: Local level analysis is critical10
We need to understand m unicipal inequality and pov erty l evel s to
im plement effectiv e anti -poverty pol icies. Higher urbanization rates and
higher levels of education are positiv el y related to l ower levels of income
pov erty at the m unicipality level ; and mun icipalities w ith higher levels of
depriv ation inequality al so have a high incidence of income and
mul tidimensional poverty l evels. Figures 3 and 4 show stark patterns of
mul tidimensional poverty and inequal ity across m unicipalities in South
Africa, and par ticul arl y high poverty and inequality cl usters in the Eastern
Cape and KwaZulu-Natal provinces.
To benchm ark and show progress in a national project to buil d an
incl usive society we hav e to detail , update, and track these persistent
local -level inequalities of contem porary South Africa. M unicipal poverty
levels are driven by local specificities of em ployment, levels of education
and, criticall y, inequalities. Drilling dow n into m unicipal level realities gives
us the tool s to fram e and prioritize policies and del ivery at the l ocal level.
#WorldinCommonFigure 3 and 4. Multidimensional poverty and inequality across municipalities in South Africa (David et al, 2018;
Source: 2011 Census)
4. Policy Implications
High levels of inequality and the percepti on that our inequality has not
improved in the post-apartheid period are the key impediments to social
cohesion in South Africa. This im portance rem ains even w hen inequality is
anal yzed alongside other clearl y critical influences such as racial , spatial ,
and educational factors.
There are two minimum requirements for building a cohesive society in
South Africa:
- Prioritize a defined and m onitored agreement to overcom e poverty,
inequality and social excl usion; and
- Do it in a way that activ el y and legitim ately ensures voice and
agency for m arginalised indiv iduals and communities.
Our studies of social cohesion show that these bold policies to address
socio-economic challenges m ust incl ude behav ior and practices in
ev eryday l ife that dem onstrate ev idence of a society that is actuall y
committed to ov ercom ing remaining prejudices, interracial mistrust, and
negativ e attitudes.
To build, track, and improve social cohesi on we should start by
operationalising a shared defi nition of social cohesion that includes five
dimensions (inclusion, belonging, social relationship, participation and
legitimacy).
#WorldinCommonReferences
1. Burns, J., Hull, G., Lefko-Everett K., Njozela, L. (2018). Defining social cohesion. Cape Town: SALDRU, UCT. (SALDRU Working
Paper Number 216);
http://www.opensaldru.uct.ac.za/handle/11090/903
Burns, J., Lefko-Everett K., Njozela, L. (2018). From definition to measurement: Constructing a social cohesion index for South
Africa. Cape Town: SALDRU, UCT. (SALDRU Working Paper Number 217);
http://www.opensaldru.uct.ac.za/handle/11090/904
Lefko-Everett, K. (2016). Towards a measurement of social cohesion for Africa. United Nations Development Programme: 6.
Available at:
https://www.google.com/url?sa=t&rct=j&q=&esrc=s&source=web&cd=9&ved=0ahUKEwjjrbTgvrHXAhWLSCYKHaE9ApIQFghFMA
g&url=http%3A%2F%2Fwww.africa.undp.org%2Fcontent%2Fdam%2Frba%2Fdocs%2FUNDP%2520Social%2520Cohension_web.
pdf%3Fdownload&usg=AOvVaw03Baf7mAp_hBJqva79ndhw (accessed 9 Nov 2017).
2. David, A., Guilbert, N., Hino, H., Leibbrandt M., Potgieter, E., Shifa, M. (2018). Social cohesion and inequality in
South Africa. Cape Town: SALDRU, UCT. (SALDRU Working Paper Number 219).
http://www.opensaldru.uct.ac.za/handle/11090/900
3. Meiring, T., Kannemeyer, C., Potgieter, E. (2018). The gap between rich and poor: South African society’s biggest
divide depends on where you think you fit In. Cape Town: SALDRU, UCT. (SALDRU Working Paper Number 220).
http://www.opensaldru.uct.ac.za/handle/11090/901
4. David, A., Guilbert, N., Hamaguchi, N., Higashi, Y., Hino, H., Leibbrandt M., Shifa, M. (2018). Spatial poverty and
inequality in South Africa: A municipality level analysis. Cape Town: SALDRU, UCT. (SALDRU Working Paper
Number 221).
http://www.opensaldru.uct.ac.za/handle/11090/902
5. Durrheim, K., & Dixon, J. (2010). Racial contact and change in South Africa. Journal of Social Issues, 66(2), 273-288
6. MISTRA, (2014). Nation Formation and Social Cohesion: An Enquiry into the Hopes and Aspirations of South
Africans. Newtown, Johannesburg: Real African Publishers.; National Planning Commission. 2012. National
Development Plan 2030. Our future - make it work. Available at: http://www.gov.za/issues/national-
development-plan-2030.
7. Palmary, I. (2015). Reflections on social cohesion in contemporary South Africa. Psychology in Society, 2015, 49,
62 – 69; Abrahams, C. (2016). Twenty years of social cohesion and nation-building in South Africa. Journal of
Southern African Studies, 42(1): 95-107.
8. Lefko-Everett, K., Burns, J., Nontshokweni, S., Njozela, L. (2018). Exploring South Africans’ understanding of social
cohesion. Cape Town: SALDRU, UCT. (SALDRU Working Paper Number 218).
http://www.opensaldru.uct.ac.za/handle/11090/905
9. David, A., Guilbert, N., Hino, H., Leibbrandt M., Potgieter, E., Shifa, M. (2018). Social cohesion and inequality in
South Africa. Cape Town: SALDRU, UCT. (SALDRU Working Paper Number 219).
http://www.opensaldru.uct.ac.za/handle/11090/900
10. David, A., Guilbert, N., Hamaguchi, N., Higashi, Y., Hino, H., Leibbrandt M., Shifa, M. (2018). Spatial poverty and
inequality in South Africa: A municipality level analysis. Cape Town: SALDRU, UCT. (SALDRU Working Paper
Number 221).
http://www.opensaldru.uct.ac.za/handle/11090/902
© Southern Africa Labour and Development Research Unit
University of Cape Town, Private Bag X3, Rondebosch 7701, South Africa
Tel: +27 (0)21 650 5696 | Fax: +27 (0)21 650 5697 |
#WorldinCommonYou can also read