Testing Climate Claims 2021 Update - John R. Christy Professor, Atmospheric and Earth Sciences Director, Earth System Science Center The ...
←
→
Page content transcription
If your browser does not render page correctly, please read the page content below
Thursday 21 January 2021

Testing Climate Claims
     2021 Update
              John R. Christy
Professor, Atmospheric and Earth Sciences
  Director, Earth System Science Center
 The University of Alabama in Huntsville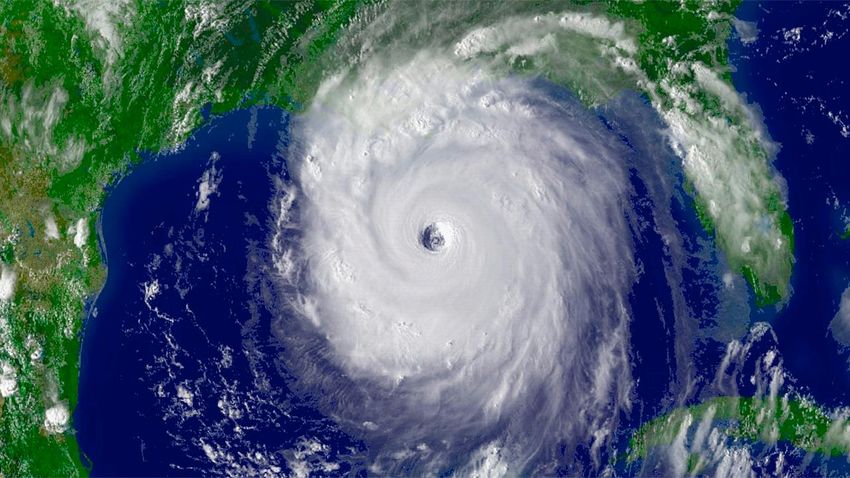
Dealing with Claims about
Climate Change in 2021 can be
extremely frustrating.

We’ll look at some claims and
test them with evidence to see
if there is a “climate crisis.”

The Theory of Greenhouse
Warming – detecting a tiny
  influence on a massive
       climate system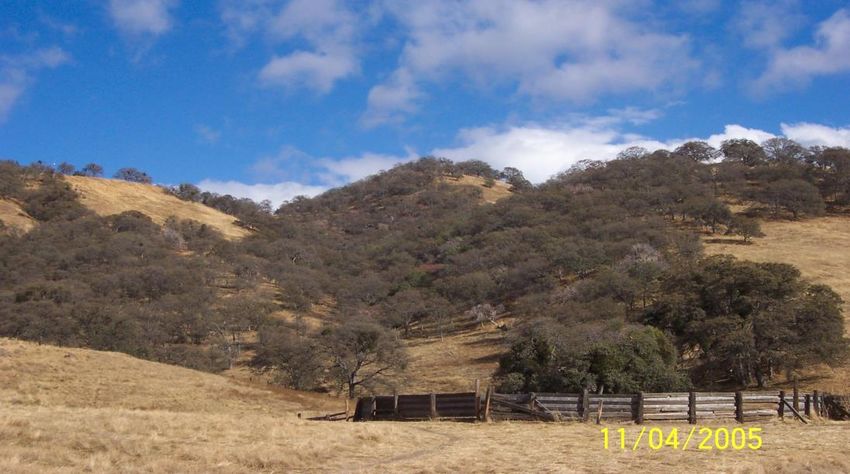
Extra GHG’s add < 1 unit

Earth System Energy Flow Rates (1 unit ~ 3.4 W m-2) IPCC
What’s happening at the surface?

       Evaporation

Heat
Flux
                                                 Solar
                       Surface     Downward      Radiation
                       Radiation   Atmosphere
                       Loss        Radiation

                     Cooling           Heating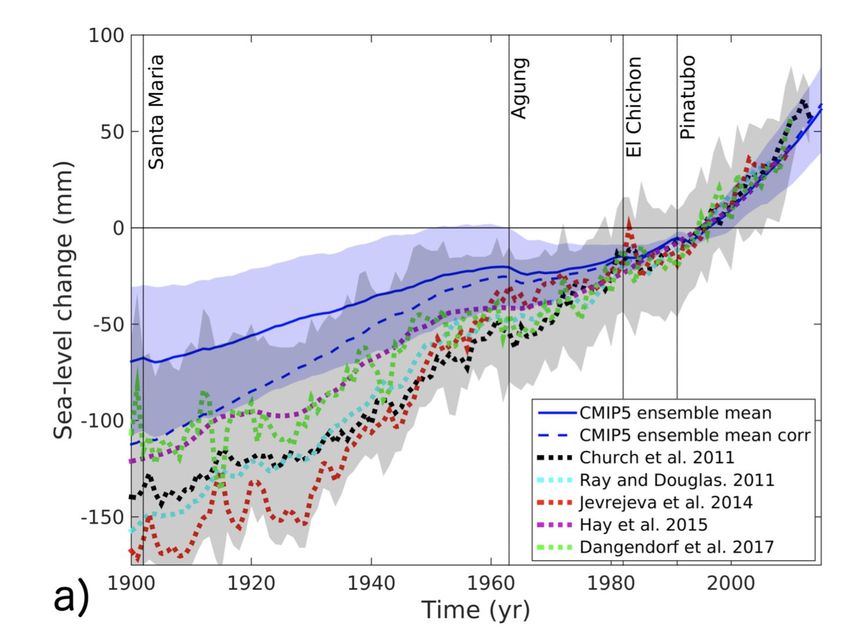
What’s happening at the surface?

                                                             Extra CO2

       Evaporation

Heat
Flux
                                                 Solar
                       Surface     Downward      Radiation
                       Radiation   Atmosphere
                       Loss        Radiation

                     Cooling           Heating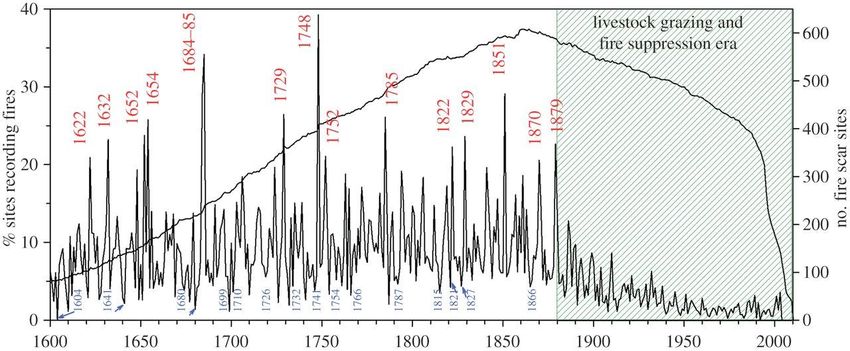
How do we test a claim that current
global warming is significant and that it is
caused almost entirely by the extra
greenhouse gases that human economies
emit as they enhance their wellbeing?
To test the claim we must locate a
test metric that has the following
robust and scientifically defensible
characteristics:

                   McKitrick and Christy (2018)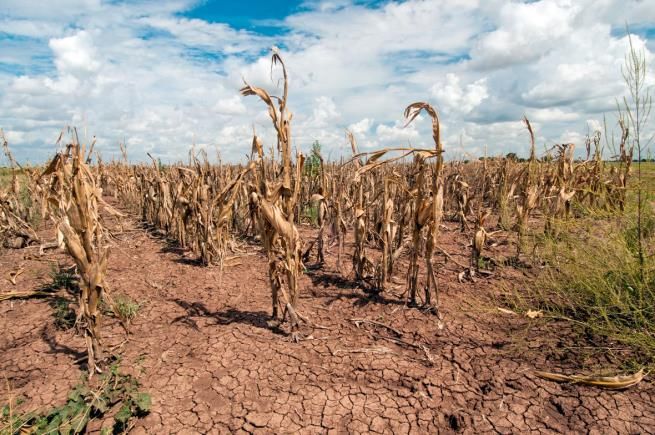
The metric should have these characteristics:

The response is seen in all models as a dominate
characteristic

Response is not there when extra greenhouse gases are not
included (i.e. control and experiment are always different)

The metric cannot have been used in the tuning and
development of the model

Observations should come from multiple, independent
sources
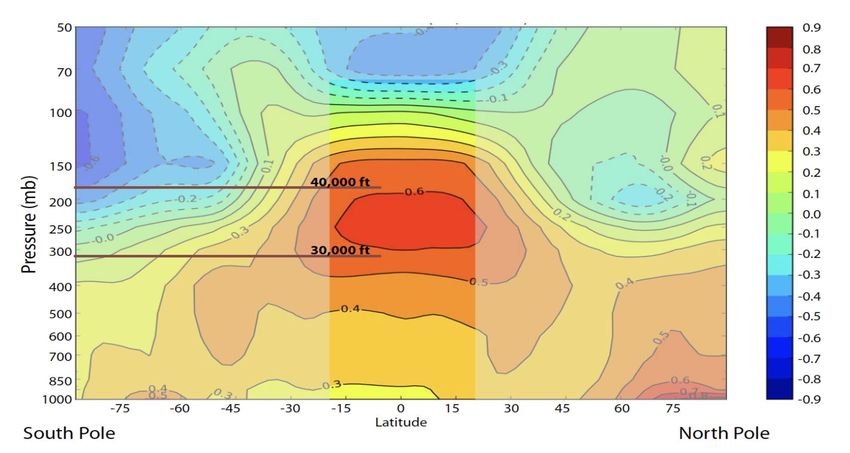
Test Metric: Temperature,
                 Tropical upper troposphere
                 300-200 hPa (~30k-40k ft)
GWPF

                                      Canadian
                 40,000 Ft            Model

                                      Trends
                 30,000 Ft
                                      1979-2018

       TROPICS
How does the claim relate to what "should” be happening in the upper atmosphere in the tropics? Claim (or hypothesis): significant warming should have already occurred here to change our climate.
0.0
                 0.1
                       0.2
                             0.3
                                   0.4
                                         0.5
                                                        0.6
                                                                               0.7
     ACCESS
 ACCESS-ESM
        AWI
   BCC-CSM2
      CAMS
   CanESM5
    Can5-OE
      CESM2
     CESM2-…
      CIESM
      CMCC
CNRM-CM6-1
   CNRM_HR
 CNRM-ESM2
  EC-EARTH3
   EC-E3-VEG
  FGOALS-f3
  FGOALS-g3
         FIO
  GFDL-CM4
   GFDL-ESM
     GISS-E2
    HadGEM
        IITM
  INM-CM4-8
   INM-CM5
IPSL-CM6A-LR
       KACE
      KIOST
    MCM-UA
    MIROC6
  MIROC6-2L
                                                                                     39 IPCC Climate Model Simulations CMIP6
                                                                                     300-200 hPa Temperature Trend 1979-2019

     MPI-HR
     MPI-LR
                                               i.e. “Scientific Consensus”

   MRI-ESM2
      NESM
    NOR-LM
                                               Model Average +0.40 °C/decade

   NOR-MM
    UKESM1
0.0
0.1
0.2
0.3
0.4
0.5
0.6
0.7
ACCESS
ACCESS-ESM
AWI
BCC-CSM2
CAMS
CanESM5
Can5-OE
CESM2
CESM2-…
CIESM
CMCC
CNRM-CM6-1
CNRM_HR
CNRM-ESM2
EC-EARTH3
EC-E3-VEG
FGOALS-f3
FGOALS-g3
FIO
GFDL-CM4
GFDL-ESM
GISS-E2
HadGEM
IITM
INM-CM4-8
INM-CM5
IPSL-CM6A-LR
KACE
KIOST
MCM-UA
MIROC6
MIROC6-2L
39 IPCC Climate Model Simulations CMIP6
300-200 hPa Temperature Trend 1979-2019
MPI-HR
MPI-LR
i.e. “Scientific Consensus”
MRI-ESM2
NESM
NOR-LM
Model Average +0.40 °C/decade
NOR-MM
Observed Average +0.17 °C/decade
UKESM15-Year Running Mean of Tropical Temperature CMIP5
Anomalies of 300-200 hPa Layer (1979-2019)
2.0
Model Trend Average: +0.44 °C/decade ACCESS1.0
ACCESS1.3
Observation Trend Average: +0.16 °C/decade BCC-CMS1.1
(p-value < 0.0005 that they are the same, i.e. BCC-CSM1.1(m)
1.5 the models and observations are not from the
BNU-ESM
CanESM2
same physical system) CCSM4 (6 runs)
CESM1(BGC) (1 run)
CESM1(CAM5) (3 runs)
CMCC-CM
The HYPOTHESIS FAILED (Rejected) CNRM-CM5
CSIRO-Mk3-6-0
1.0 EC_EARTH
FGOALS-g2
FIO-ESM
GFDL-CM3 (1 run)
GFDL-ESM2G (1 run)
GFDL-ESM2M (1 run)
GISS-E2-H (16 runs, +0.42 °C/decade)
GISS-E2-R (18 runs, +0.42 °C/decade)
0.5 HadGEM2-ES
INM-CM4
IPSL-CM5A-LR
IPSL-CM5A-MR
IPSL-CM5B-LR
MIROC5
MIROC-ESM
0.0 MPI-ESM-LR
MPI-ESM-MR
MRI-CGCM3
NorESM1-M
NorESM1-ME
32 Group Mean
Avg 3-Balloon
Trend lines of all time series intersect at 0.0 in 1979
-0.5
1975 1980 1985 1990 1995 2000 2005 2010 2015 20205-yr Running mean 300-200hPa Tropical Temperature Anomalies
CMIP-6 (Historical + ssp245 after 2014) ACCESS
ACCESS-E
2.0 1979-2019 Model Mean Trend +0.40 °C/decade
AWI
BCC-CSM2
CAMS
2019-2050 Model Mean Trend +0.50 °C/decade CanESM5
Every model 5-yr detrended variance (except MPI-LR) Can5-OE
CESM
exceeds observations on average by four times CESM2-WACCM
(negative feedbacks keep system near trend line) CIESMa
1.5 CMCC
CNRM-CM6
CNRM_HR
CNRM-ESM2
EC-EARTH3
EC-E3-VEG
FGOALS-f
FGOALS-g
1.0 FIO
GFDL-CM4
GFDL-ESM4
GISS
HadGEM
IITM
INM-CM4-8
0.5 INM-CM5
IPSL-CM6A-LR
KACE
KIOST
MCM-UA
MIROC6
MIROC6-2L
MPI_HR
0.0 MPI-LR
MRI-ESM2
NESM
NOR_LM
NOR_MM
All time series trends intersect at zero in 1979 UKESM1
and based on 1979-2019 only UKESM2
-0.5 Model Mean
Sonde Avg (3)
1975 1980 1985 1990 1995 2000 2005 2010 2015 2020 Reanal Avg
John R. Christy, The University of Alabama in Huntsville+1.4 W +2.6 W
Why do models warm too fast, and vary Model Earth
more wildly than observations?
Likely related to model processes which
do not allow enough heat to escape to
space (negative feedback) when warming
events occur. This is likely related to the
distribution of heat trapping clouds
Air Column
and/or water vapor. Roy Spencer UAH
Thus, the flow of energy is
misrepresented in these hypotheses we
+1°C
call modelsAbsolute Temperature 300-200 hPa
236
Range of IR emissions at 2000: 143W to 168 W (159W Actual)
234
232
230
K
228
226
224
222
1950 1955 1960 1965 1970 1975 1980 1985 1990 1995 2000 2005 2010 2015 2020 2025 2030
ACCESS ACCESS_E AWI BCC-CSM2 CAMS CanESM5 Can5-OE
CESM2 CESM2-WACCM CIESMa CMCC CNRM-CM6-1 CNRM_HR CNRM-ESM2
E3SM EC-EARTH3 EC-E3-VEG FGOALS FGOALSg FIO GFDL-CM4
GFDL-ESM4 GISS-E2 HadGEM IITM INM-CM4-8 INM-CM5 IPSL-CM6A-LR
KACE KIOST MCM-UA MIROC6 MIROC6-2L MPI-HR MPI-LR
MPI-HAM MRI_E2 NESM NOR_LM NOR_MM SAM0 UKESM1
UKESM2 ERA5Temperature Change 300-200hPa: 1980 - 2100
CMIP-5 Models (102 rcp4.5, 73 rcp8.5)
5-year running averages (base 1979-1983)
9
8
rcp8.5 (73) High-End Scenario
7
6 rcp4.5 (102)
5 Rsondes (3)
°C 4
ReAnalyses (2)
3
2
Modest Growth Scenario
1
Observations
0
-1
1980 2000 2020 2040 2060 2080 2100Equilibrium Climate Sensitivity or ECS, is an index- temperature that allegedly indicates the temperature of the globe after an instantaneous doubling of CO2. Latest guestimates from models are 1.8 to 5.6 °C. That is a huge range, so modelers came up with an idea, Emergent Constraint, to figure out what the real ECS is. By the way, Empirical (i.e. using real data) estimates of ECS are 1.0 to 2.3 °C, i.e. about half.
Emergent Constraint – a strange term that simply
means there are characteristics in the climate system
that are somewhat correlated with ECS. For example, if
cloud amount is correlated with ECS (ECS is known in
models), then cloud amount can be an Emergent
Constraint. Thus a model with cloud amounts that are
realistic would presumably have a realistic ECS. It’s a
rather round-about way to use tangential metrics to
determine which model might have the best ECS when
other, more obvious metrics are available.

McKitrick and Christy 2020 used an obvious metric for
the Emergent Constraint – the temperature trend of
the bulk atmosphere.
LT 1.7
                                       Red: Model trends vs.
          MT 1.4
                                       Model ECS

                                 Arrows Observed Trends

                                                               Emergent Constraint

This plot shows the relationship between global atmospheric trends
(Emergent Constraint) and ECS from the models. The actual global trends
(dashed arrows for mid-troposphere, solid for lower troposphere) suggest
the ECS is around 1.4 to 1.7 °C – below the range of the CMIP-6 models. This
implies models are too sensitive to greenhouse gases.
Models represent the level of understanding (or misunderstanding) scientists have about the impact of extra greenhouse gases on the climate. As Hypotheses, do they succeed in describing the attributes of the physical climate so well as to Determine Policy? Models fail to reproduce the past Models fail to reproduce accurate energy flows Models disagree with each other about the future
The weather people really care about is not
becoming more extreme or dangerous (and,
people are getting smarter every day in dealing
with weather problems).
Claim: All Extreme Weather is getting
     worse (and it’s your fault)
Accumulated Cyclone (hurricane) Energy 2020 v. Average
900
800
700
600
500
400
300
1933
200
100
0
Atlantic No. Pacific No. Indian Total NH Total Global
2020 Average
1933 experienced 35% more ACE than 2020
Klotzbach Colorado St. Univ.Global Accumulated Cyclone Energy 1980-2020
104 kn2
1250
1000
750
500
1980 1990 2000 2010 2020
Record Shattering?
Klotzbach Col State UnivCount Major Tornadoes U.S. (F3-F5) 1954-2020
160
1954-1986 Avg 56/year
140
120
1987-2020 Avg 34/year
100
80
60
40
20
0
1950 1960 1970 1980 1990 2000 2010 2020
F3-F5Monthly Fraction of US with Very Wet (flood-like) or Very Dry
(drought) Conditions
Jan 1895 – Dec 2020 NOAA/NCDC (20 driest months before 1988)
0.6
0.4
0.2
0.0
-0.2
-0.4
-0.6 Dry
Wet
-0.8
1895 1905 1915 1925 1935 1945 1955 1965 1975 1985 1995 2005 2015Number of Daily Record High Temperatures by year for 737
USHCN Stations with at least 105 years of record (1895-2020)
per 100,000 observations (expected value is 794 each year)
3000
The occurrence of Record High
Temperatures is not increasing
2500
14 of top 15 years with most heat records
2000 occurred before 1960
1500
1000
500
0
1895 1905 1915 1925 1935 1945 1955 1965 1975 1985 1995 2005 2015
John R. Christy, The University of Alabama in Huntsville
NCEI/NOAA data downloaded 3 Dec 2020State of the Climate 2019
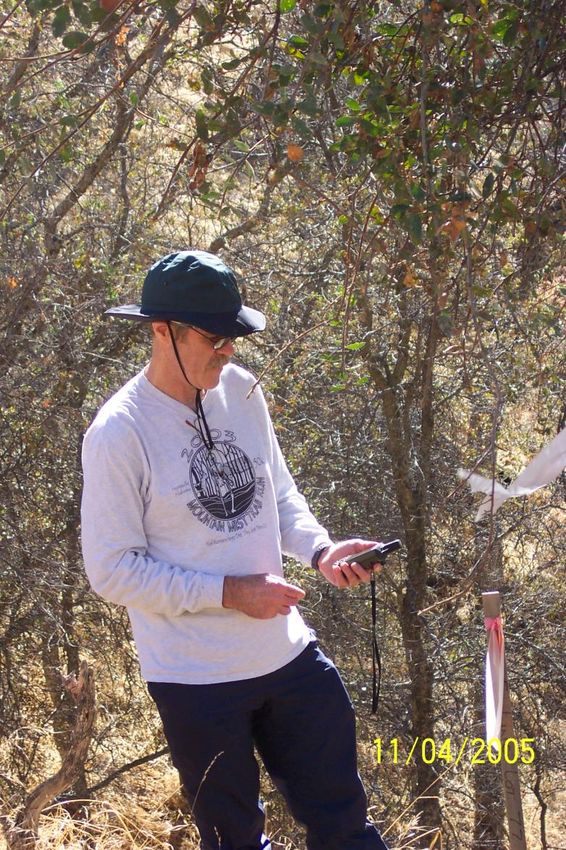
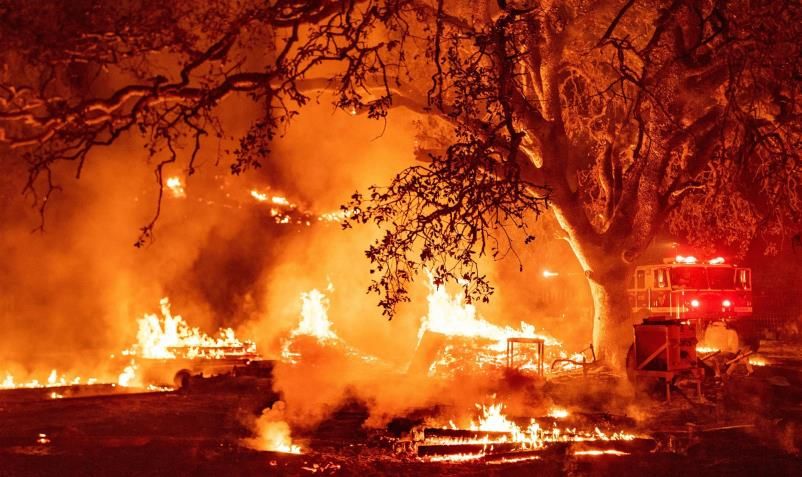
Global Drought Indices 1950-2019Western Wildfires in United States of 2020, especially California
California achieves Statehood
                                      1850

Incidence in wildfires in North America 1600-2000
       (It’s all about human management)
            Swetnam et al. 2016 Phil Trans B
California was subjected to annual burns by Native Americans
or Mother Nature prior to Spanish settlement. Pre-European
burn area was 4.5 to 12 million acres in CA per year (Stephens
et al. 2007.)
Subsequent settlers practiced “fire suppression” from the late
19th, through the 20th and 21st centuries as public policy.
Significant human occupation of and access to formerly natural
landscapes. Dry, unburned fuel load rose dramatically.
2020 CA acreage burned was under 4.5 million acres. Set up
by (1) 2012-2015 drought, (2) weakening forests, (3) bark-
Marking my property line in
beetles killed ~150 million trees left to stand (80% in areas).
Fresno Co. This is 4 miles from No harvesting allowed of dead trees creating a massive fuel
southern border of Creek Fire. debt to be burned … 2020 took care of some of that debt.Bjorn Lomborg
Global Area Burned By Decade
Journal of Geophysical Research: Biogeosciences, Volume:
119, Issue: 3, Pages: 249-263, First published: 14 February
2014, DOI: (10.1002/2013JG002532)Rutgers Snow Lab
NH SNOW EXTENT Million KM^2
Average November to April 1967-68 to 2019-20
43
Record Coverage 2012-13
42
Million sq. km
41
40
39
38
37
36
35
1965 1970 1975 1980 1985 1990 1995 2000 2005 2010 2015 2020Mother Nature
High
allows lots of
variability
Low
Arctic Sea Ice
Today 10,000 Yrs ago
Stein et al. 2017
Low
High
Lachnet et al. 202Sea Level (Previous Slide)
2-3m higher 7,000 yrs ago
6-9m higher 130,000 yrs ago
10-25m higher 3M yrs ago
Glaciers largest extent in past
10,000 years ~1850, likely lowest
sea level in that period
Sea Levels started rising in 1860
and continued to present
Actual Model Result
Post-hoc “correction” Rate 1925-1960 similar to 1980-
2018.
70% of current rise due to added
water with thermal expansion 25%
CMIP5 models unable, even after
post-hoc “corrections,” to reproduce
Observations the early SLR.The last century’s warming has been good for Humanity
Progress toward eradicating poverty based on
accessible and affordable energy (which is
carbon today) will continue
“The Chinese lifted 400 million people out of poverty by
building a coal-fired power plant every week.”

Viewed as bad by the very wealthy environmental activist who
said it

Viewed as good by the 400 million human beings no longer
living in poverty (and many more millions who strive to end
poverty)

In 2020, China’s coal use rose to highest since 2015 (Reuters)

… and with record cold temperatures in parts of China in early
2021, many windmills were idled – too much ice on blades.
“The Chinese lifted 400 million people out of poverty by
building a coal-fired power plant every week.”

Viewed as bad by the very wealthy environmental activist who
said this

Viewed as good by the 400 million human beings no longer
living in poverty (and many more millions who strive to end
poverty)

         An undeniable force:
        No one wants to be poor.
The evidence from actual data: The drive to live a longer and better life is
preferable to succumbing to the constraints of environmental virtue.
2040 (EIA)
“No peak before 2040”
35000
CO2 Emissions million metric tons
30000 BP Statistical Review 2020
25000
20000
15000
10000
5000
0
1965 1970 1975 1980 1985 1990 1995 2000 2005 2010 2015 2020
Without Energy Life is Brutal and ShortWill CO2 regulations “save” the planet?
Red – Temperature IPCC A1B Emissions
Green – U.S. stops all emissions 2012
3.0
2.5
If the U.S.A. ceased to exist in 2012,
the impact on global temperatures
(if IPCC models are accepted)
No
would be 0.08°C by 2050, or less
2.0
than the thickness of the line.
°C The irony is that even if you accept
1.5 the latest climate model simulations,
they show that the US will have little
1.0
impact on whatever the temperature
0.5 does over the next century
0.0
Data from SPPI, Paul KnappenbergerThree points the evidence supports: 1. The Established Global Warming Theory significantly misrepresents the impact of extra Greenhouse Gases. 2. The weather that affects people the most is not becoming more extreme or dangerous 3. Progress toward eradicating poverty based on accessible and affordable energy (which is carbon today) is continuing.
(2019) The average American is smarter than you think
  – they recognize it when an elitist is exaggerating a
  story, the end result of which is to deny this average
guy some aspect of life he/she wants and needs (while
        the elitist maintains a luxurious lifestyle).

(2021). The average American is going to learn what a
political party who wants to eliminate carbon usage is
going to mean for their lives. However, if re-election is
 still a main driving force, perhaps this party will look
for hard evidence to find excuses for not punishing the
    electorate with higher and higher energy prices.
Demonstrating that claims
of climate campaigners are
exaggerated or false Is this the “Science Way”?
ensures isolation,
denigration and criticism
from the climate
establishment and major
media … and in 2021 the
elected federal government
now joins in.
The facts don’t seem to
matter to them. 36 hours after “March For Science” with
emphasis on climate change, 7 rounds were
fired into my building/office suite.Thank You
Global Number of storm-days per year of Tropical Storm (>63 km/hr),
       Hurricane (>119 km/hr) and Major Hurricane (>178 km/hr) 1979-2020

600

500

400

                                                                 Tropical Storm Days
300                                                              Hurricane Days
                                                                 Major Hurricane Days
200

100

 0
      1970    1980       1990      2000      2010      2020
                                                                   Klotzbach Col State Univ
You can also read