New Zealand Seasonal Fire Danger Outlook 2017/18 - Fire and ...
←
→
Page content transcription
If your browser does not render page correctly, please read the page content below
New Zealand Seasonal Fire Danger Outlook 2017/18
ISSUE: North Island, November 2018
Current fire danger situation & outlook: usual, with strong westerly winds and fast-moving fronts being more
common. But we will likely experience winds from the east periodically
Low to moderate fire dangers and fire climate severity currently exist in as well.
most areas of the North Island (Figures 1 & 5). The exceptions being
high to very high fire dangers for coastal locations in Central Hawke’s Over the next three months, New Zealand is forecast to experience
Bay, Manawatu-Whanganui, and Wairarapa. This is reflected in the higher pressure than normal over the country and lower pressure than
current FWI System codes and indices, which indicate that fuels are normal to the southwest. As a result, temperatures are expected to be
drying in eastern regions but are at similar values as the same time last above or near average across the country. Near normal or below normal
year (Figures 5-6 & 7-8). rainfall is also forecast. A drier and warmer than average three months
would mean a low chance of recovery for areas currently experiencing
Soil moisture levels are currently at, or close to, capacity for many low soil and fuel moistures.
locations (Figure 3). The exceptions being in the Far North, Hastings
and Central Hawke’s Bay. This is reflected in the soil moisture anomaly As we move into summer, the combination of warm temperatures,
map (Figure 4), which shows soils are drier than normal across most of low rainfall and strong gusty winds will dry out soils and vegetation,
the North Island, but most notably in the Far North, Whangarei, Central elevating fire risk and contributing to fast moving fires. Warm dry
North Island and Hawke’s Bay. conditions will also trigger the maturing of grasslands and set the curing
process in motion. Areas of lush green grass will begin to drop seed
One of the major climate drivers for New Zealand is the El Niño– and begin turning yellow over the next few months. However, in general,
Southern Oscillation (ENSO). The ENSO Outlook has changed from fire dangers and severity for November are expected to be low for most
WATCH to El Niño ALERT. International models suggest that we are still of the North Island. There are no specific areas to currently watch out
in a Neutral phase, with the possibility of transitioning towards a weak for Very High to Extreme fire potential. As we transition from spring to
El Niño over the next three-month period (88% chance over November summer, expect to see fire dangers increase, especially for east coast
2018 – January 2019). A non-conventional El Niño is indicated, with its locations (Gisborne, Wairoa, Hastings, Central Hawke’s Bay, Wairarapa,
impacts on the country likely to be different from the traditional text book as well as Palmerston North).
El Niño. For example, we will likely experience variance from the typical
southwesterly air flow patterns experienced during traditional El Niño The fire season years of 2004/05 and 2006/07 are possibly good
events (i.e. such as 1997-98 or 1982-83). indicators for what to expect during a weak El Niño this coming fire
season (Figure 9). We may also be in for a similar season to last
For the month of November, New Zealand is likely to experience year, with rainfall keeping the fire dangers and severity low until the
changeable weather, which is typical of spring. November is forecast to Christmas/New Year’s holiday period, after which many parts of the
have multiple rounds of long dry spells with wet weather interspersed in North Island experienced High to Extreme fire dangers and fire climate
between. Compared to last month, November is likely to be windier than severity.
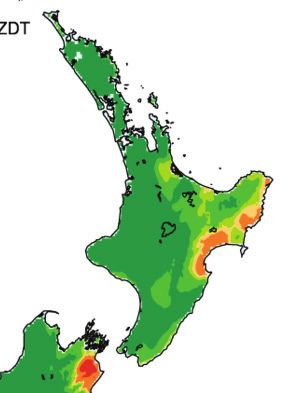
October 2018 November 2017 November 2004
Low
Moderate
High
Very high
Extreme
Figure 1. Monthly average Severity Rating for: current (left), last year (middle), & 2004/05 Neutral year followed by a weak El Niño (right).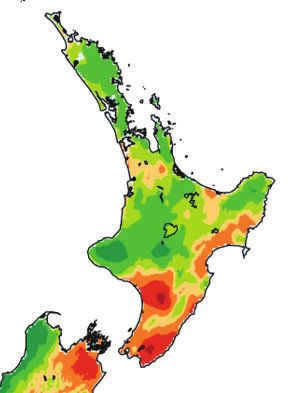
them warm).
EXPECTED CLIMATE OUTLOOK:
The ENSO (El Niño – Southern Oscillation) currently
remains neutral in the tropics. However, the ENSO                    Further ahead: November 2018 - January 2019
Outlook has changed from WATCH to El Niño ALERT,                     For the next three months (November 2018 – January
indicating that all the typical precursors for this event are        2019) westerly air flow anomalies are expected, though
in place, and that there is a good chance for this event to          periodic easterly air flows are possible. Temperatures
form.
                                                                     are forecast to be above average or near average for all
International climate models indicate that the tropical              regions of New Zealand. Below normal or near normal
Pacific will transition towards El Niño over the next three-         rainfall is forecast for most regions. Soil moisture levels
month period (an 88% chance over November 2018                       and river flows are forecast to be near normal or below
– January 2019). The probability of El Niño conditions               normal for the North Island. Above average or near
remains high throughout autumn (March – May 2019).                   average sea surface temperatures (SSTs) are expected
Some long-range models are also forecasting the                      in New Zealand coastal waters during the next three
possibility for El Niño to continue into winter, and even            months.
potentially next fire season. This event is known as a
“protracted El Niño”.

This El Niño event is likely to be weak, and the impacts             Regional breakdown (Figure 2):
on New Zealand’s weather may not run true to a typical               Temperatures are most likely to be:
El Niño climate pattern. It is not expected to be of a               • above average (45% chance) or near average
similar intensity to what was experienced during 2015-                  (40%) for Northland, Auckland, Waikato, Bay of
16, 1997-98 or 1982-83, and therefore different impacts                 Plenty, Central North Island, Taranaki, Whanganui,
are expected. This means we will likely see deviations                  Manawatu, Wellington, Gisborne, Hawke’s Bay and
from the typical south westerly air flow patterns typically             Wairarapa.
experienced during traditional El Niño events. But ENSO
is just one of several climate drivers that can influence            Rainfall is most likely to be:
New Zealand’s rainfall and temperature patterns.                     • below normal (40%) or near normal (35%) for
                                                                        Northland, Auckland, Waikato, Bay of Plenty, Central
November marks the start for the tropical cyclone season                North Island, Taranaki, Whanganui, Manawatu,
(November 2018 to April 2019), and NIWA’s outlook                       Wellington, Gisborne, Hawke’s Bay, and the
indicates the risk for New Zealand to be near normal.                   Wairarapa.
This means at least one ex-tropical cyclone passes
within 550 km of New Zealand each year. Last year                    Soil moistures & river flows are most likely to be:
New Zealand experienced three. Significant rainfall,                 • near normal (45%) or below normal (40%) for
damaging winds, and coastal damage can occur during                      Northland, Auckland, Waikato, Bay of Plenty, Central
these events, and reducing fire risk in affected areas. A                North Island, Taranaki, Whanganui, Manawatu,
protracted El Niño event is likely to have an impact on                  Wellington, Gisborne, Hawke’s Bay, and the
delaying the tropical cyclone season.                                    Wairarapa.

This month: November 2018                                            Last month: October 2018
Weather is expected to be volatile during spring, and the            Overall, October was dry for many locations. New
coming month is no exception. November will have a cold              Zealand experienced higher than average pressures.
and wet start early in the month. Cooler south-westerlies            However, rain and strong winds were experienced
and areas of low pressure are forecast, bringing above               throughout the month, but these were few and far
average rainfall to southwestern parts. This is followed by          between. Southern Hawke’s Bay stands out as one
high pressure building over the North Island, and milder             of the driest spots with under 20% of normal rainfall
north-westerlies leading to drier than average conditions            experienced. Temperatures were on general average for
for week two. This warm spell for most will follow into              the month. Around New Zealand’s coastline, sea surface
the second half of the month due to a settled Southern               temperatures (SSTs) varied, but increased dramatically
Ocean with occasional Tasman Lows affecting the North
Island. After this warmer spell, the second half of the              at the end of the month. The prolonged high pressure
month then looks very changeable.                                    at the start of the month allowed the Tasman Sea to
                                                                     climb to almost 2 degrees above average. Warmer than
                                                                     average subsurface ocean waters strengthened and
It is expected that sea surface temperatures (SSTs) will             expanded eastward during October.
continue to warm over November, which will have an
impact on December’s air temperatures (likely to keep

 Figure 2. Outlook for Nov 2018 - Jan 2019: air temperature (left), rainfall (middle), available soil moisture (right). Source: NIWA.

page: 2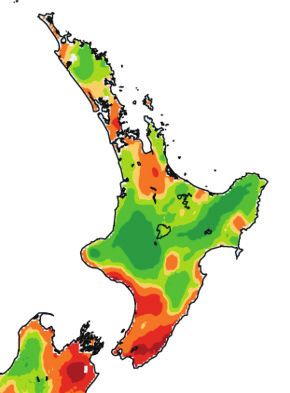
Soil moisture (Figure 3 & 4) than normal conditions to the west of the Southern Alps
Across the North Island, soil moisture levels are currently and drier conditions in northern and eastern regions of
at or near field capacity, especially for Taranaki, Waikato, both Islands.
Bay of Plenty and Gisborne (Figure 3). Dry soils are
found along eastern regions, including Hastings and Note though that indications for the current El Niño event
potentially developing suggest that it will not follow these
Central Hawke’s Bay. This is also reflected in the soil typical climate patterns. If it develops, it is likely to only
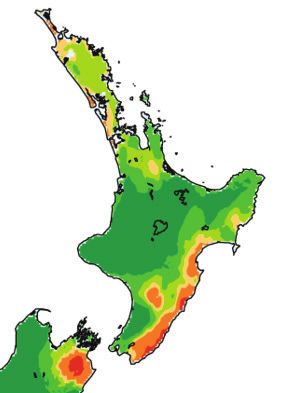
moisture anomaly map (Figure 4). For this time of the be a weak to moderate event, as a result of the ocean
year, soils are drier than normal for many regions. The and atmosphere being decoupled, rather than linked
exceptions being parts of Gisborne, Taranaki, Waikato as with stronger El Niños. This means we will likely
and Bay of Plenty. see deviations from the typical south westerly air flow
patterns (to more southeast to northeast air flows), and
the Southern Ocean influences continuing to influence
Grass growth: weather across the country.
During spring, grasses are undergoing a period of
growth, and much of the country side is looking green
and lush. Typically, if a fire started in these fuels, fire
spread would be difficult. Any burning will produce small
flame heights and low intensities for easy suppression.
In some areas, the presence of dead matted material
from the previous season’s growth (thatch) can contribute
to the ease of a fire starting and spreading. The material
is often hidden underneath lush green grass that appears
to have low curing (30 - 50%). However, thatch can
increase a fires ability to carry and sustain a fire. These
fires will typically produce small flame heights and spread
in a patchy manner.
Dead material can also come about from frost curing. As
we transition from spring into early summer, the potential
for a fire to ignite and spread is increased as the curing
process kicks off in these fuels (formation of seed heads
and loss of seeds).
Wetter than normal soils, combined with mild winter
conditions, have led to abundant grass growth in many
areas. Once this dries out, these higher than normal fuel
loads could contribute to increased fire intensities.
Figure 3. Soil moisture deficits as of 02/11/2018.
The finer details: Source: NIWA.
Grassland curing will affect fire behaviour in several
ways: it increases the amount of dead material present Note: Soil moisture deficit means the amount of water needed to bring the
and affects fuel moisture content. The result is an soil moisture content back to field capacity, which is the maximum amount
of water the soil can hold.
increased chance of fire ignition, fire intensity and rates
of spread.
The moisture content of fine grass fuels (as well as pine
litter and other fine fuels) also dramatically affects the
ignition potential and ability of a wildfire to spread. High
amounts of moisture increase the heat and thermal
conductivity of fuel, so that more heat is required for the
fuel to reach its ignition temperature. As grasses cure,
and become drier, less heat is required to ignite and
sustain a fire.
What does El Niño mean for NZ
Remember El Niño is only part of the story:
New Zealand’s climate is influenced by two key natural
cycles: the El Niño-Southern Oscillation (ENSO) and
the Interdecadal Pacific Oscillation (IPO). Both these
operate over the Pacific Ocean and beyond, and cause
fluctuations in the prevailing trade winds and in the
strength of the subtropical high-pressure belt. Although
ENSO events have an important influence on New
Zealand’s climate, they account for less than 25%
of the year to year variance in seasonal rainfall and
temperature.
Figure 4. Soil moisture anomaly as of 02/11/2018.
El Niño events are typically (but not always) associated Source: NIWA.
with stronger and/or more frequent westerly winds over
summer in New Zealand, following more south-westerlies Note: Soil moisture anomaly means the difference between the
in spring. Such a circulation pattern can lead to wetter historical normal soil moisture deficit (or surplus) for a given time of year
and actual soil moisture deficits.
page: 3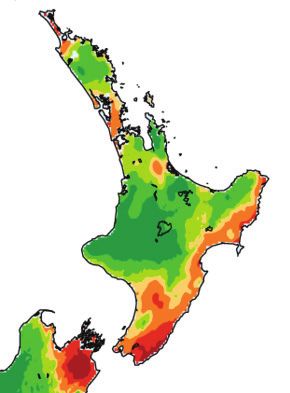
The purpose of these monthly outlooks is to provide Comparisons of fire dangers for individual indicator
a heads up on the progression of fire danger as we stations for different regions are not shown in this
transition from spring to summer and, later, into autumn. outlook due to the low fire danger and severity across
It aims to forewarn fire agencies of current and potential the country. As fire dangers increase, more detailed
fire danger conditions that can be used as a prompt for regional outlooks will recommence highlighting
local and regional discussions on fire potential (which where Buildup Index (BUI), Drought Code (DC) and
depends on fuel conditions (i.e. grass curing), risks Cumulative Daily Severity Rating (CDSR) values sit in
of ignitions, recent fire history and fire management comparison with previous fire seasons.
resources available in an area, as well as climate and
fire weather). For those who are interested in tracking fire season
trends for all your weather stations, the graphs are still
Continue your pre-planning (if you haven’t done so available monthly on the Scion Rural Fire Research
already), by discussing where conditions are at, where website (https://www.scionresearch.com/rural-fire-
they are heading, and how this can drive awareness research/tools/new-zealand-seasonal-fire-danger-
about what this might mean for fire risk in your patch outlooks). If tracking on a more frequent basis (as
and for your neighbours. opposed to the monthly analysis done here), you can
contact Scion for the data.
Background info on FWI codes and indicies:
Fine Fuel Moisture Code (FFMC) Duff Moisture Code (DMC) A rating of the Drought Code (DC) A rating of the average
An indicator of the relevant ease of average moisture content of loosely moisture content of deep, compact,
ignition and flammability of fine fuels. compacted organic soil layers (duff/ organic soil layers, and a useful indicator
humus) of moderate depth, and of seasonal drought effects on forest fuels
0 - 74 Difficult
medium-sized woody material and amount of smouldering in deep duff
layers and large logs.
75 - 84 Moderately easy 0 - 10 Little mopup needs 0 - 100 Little mopup needs
85 - 88 Easy 11 - 20 Moderate 101 - 175 Moderate
89 - 91 Very easy 21 - 30 Difficult 176 - 250 Difficult
92 + Extreme easy 31 - 40 Difficult & extended 251 - 300 Difficult & extended
41 + Difficult & extensive 301 + Difficult & extensive
Buildup Index (BUI) Initial Spread Index (ISI) Combines the Fire Weather Index (FWI)
Combines the DMC and DC, and effect of wind speed and the FFMC, Combines the ISI and BUI to indicate the
represents the total amount of fuel providing a numerical rating of potential potential head fire intensity of a spreading
available for combustion. fire spread rate. fire (on level terrain).
0 - 15 Easy control 0-3 Slow rate of spread
0-5 Low fire intensity
16 - 30 Not difficult 4-7 Moderate fast
6 - 12 Moderate
31 - 45 Difficult 8 - 12 Fast
13 - 20 High
46 - 59 Very difficult 13 - 15 Very fast
21 - 29 Very High
16 + Extremely fast
60 + Extremely difficult 30 + Extreme
Daily Severity Rating (DSR) A numerical rating of the daily fire weather severity at a
particular station, based on the FWI. It indicates the increasing amount of work
and difficulty of controlling a fire as fire intensity increases. The DSR can be
averaged over any period to provide monthly or seasonal severity ratings. 0-1 Low fire behaviour potential
1-3 Moderate fire potential
Monthly Severity Rating (MSR) is the average of the DSR values over the month. 3-7 High to very high fire potential
DSR and MSR captures the effects of both wind and fuel dryness on potential
7+ Extreme fire behaviour potential
fire intensity, and therefore control difficulty and the amount of work required to
suppress a fire. It allows for comparison of the severity of fire weather from one
year to another.
Acknowledgements:
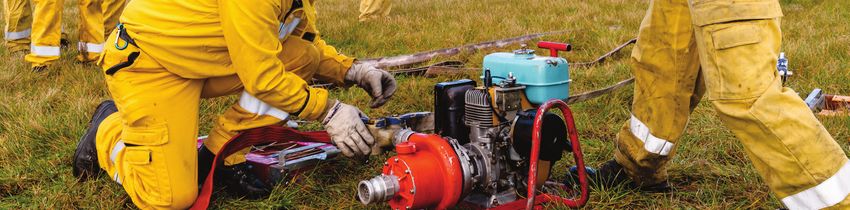
Fire Danger interpretation was from information gathered from the Front Cover Image:
Average Monthly Maps for: Severity Rating, FWI, BUI, ISI, DC, 2018 Pumps refresher training. (Veronica Clifford, Scion).
DMC, FFMC. These maps were obtained from the National Rural
Fire Authority Fire Weather System powered by Eco Connect. If you are keen to submit a weather and fire related photo
that will appear on the front page, please email:
Information on the Expected Climate Outlook was gathered from: • a high resolution image(s)
• MetService, Rural Monthly outlooks: • with details on the location and the photographer’s
www.metservice.com/rural/monthly-outlook name and organisation.
• NIWA, Seasonal Climate outlook: • to: Veronica.Clifford@scionresearch.com
www.niwa.co.nz/climate/sco
• Australian Bureau of Meteorology Climate outlooks
http://www.bom.gov.au/climate/ahead/?ref=ftr
page: 4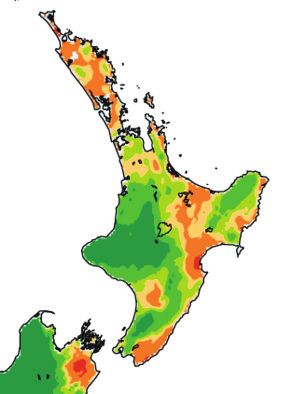
October 2018                                 November 2017                              November 2004

 FWI values
      Low
 Moderate
      High
 Very high
  Extreme

                      October 2018                             November 2017                                November 2004

BUI values

     Low
Moderate
     High
Very high
 Extreme

                     October 2018                                November 2017                             November 2004

 ISI values
       Low
 Moderate
      High
 Very high
  Extreme

Figure 5. Current Monthly Average for the: Fire           Figure 6. Average Monthly values of: Fire Weather Index (top), Buildup Index
Weather Index (top), Buildup Index (middle) and Initial   (middle) and Initial Spread Index (below); for the same time as last year (left) and
Spread Index (below).                                     during the 2004/05 Neutral year followed by a weak El Niño (right).

                                                                                                                                   page: 5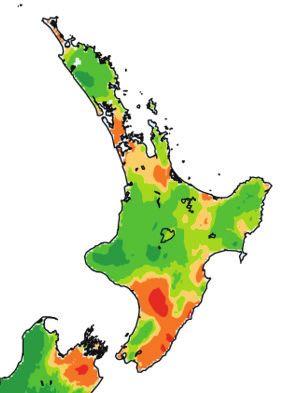
October 2018                             November 2017                          November 2004

 DC values
      Low
 Moderate
     High
 Very high
  Extreme

                    October 2018                              November 2017                           November 2004

DMC values
     Low
Moderate
    High
Very high
 Extreme

                    October 2018                             November 2017                            November 2004

FFMC values
     Low
Moderate
    High
Very high
 Extreme

Figure 7. Current monthly average for the: Drought     Figure 8. Average monthly values of: Drought Code (top), Duff Moisture Code
Code (top), Duff Moisture Code (middle) and the Fine   (middle) and Fine Fuel Moisture Code (below); for the same time as last year
Fuel Moisture Code (below).                            (left) and during the 2004/05 Neutral year followed by a weak El Niño (right).

    page: 6
2004 - 2005
          2006 - 2007
          2017- 2018    September   October   November   December   January   February   March         April                      May

                                                                                                 Figure 9. New Zealand Fire Season
                                                                                                 Severity (monthly)
          2018 - 2019

                                                                                                 The years 2004/05 and 2006/07 were Neutral
                                                                                                 years followed by weak El Niño phase, and are
                                                                                                 potential comparisons for what New Zealand
                                                                                                 might experience over the next few months.
                                                                                                 DSR values of less than 1 equate to low fire
                                                                                                 behaviour potential, 1-3 moderate fire potential,
page: 7

                                                                                                 3-7 high to very high fire potential, and above 7
                                                                                                 extreme fire behaviour potential.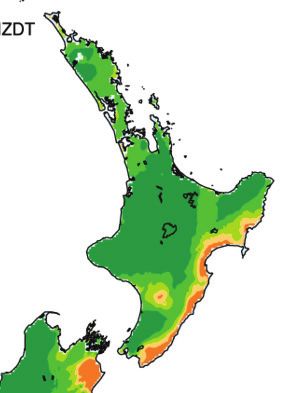
You can also read