WARD PROFILE: JUBILEE 2020 - Enfield Council
←
→
Page content transcription
If your browser does not render page correctly, please read the page content below
WARD PROFILE:
JUBILEE
2020

        Jubilee Ward is situated in the east of the Borough, bordered by Haselbury and Lower
      Edmonton wards to the south, Bush Hill Park ward to the west and Southbury and Ponders
              End wards to the north. It is covered by postal districts N9, EN1 and EN3

Produced by the Insight Team                                                                   1
If you have any queries relating to this document please email KIH@enfield.gov.uk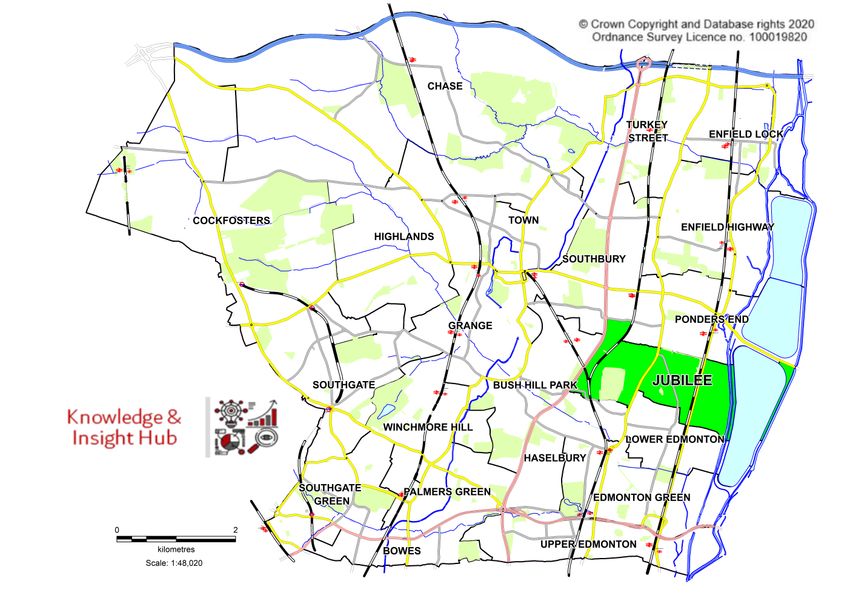
Ward Profile

This Profile is intended to provide a guide to the demography, social and economic data and
Council facilities in the ward.
It has been collated using the most up to date local-level data relating to 2019/20 as far as
possible. A variety of statistical sources, both national and local, have been used in its compilation.
Appendix A has a table of key statistics for at a glance comparison with Borough averages.

  Political Makeup

The ward is represented by the following Councillors:

 Name                                Party                  Contact                     Votes received in
                                                                                        2018 election

 Nesil Caliskan                      Labour                 020 8379 3379               2,132
 NesilCazimoglu
 Alev  Caliskan                      Labour                 020 8379 2612               2,132
 Bernie Lappage                      Labour                 020 8379 2602               2,110

At the 2018 council elections, voter turnout in Jubilee was 35.7%.
Jubilee ward falls in the parliamentary seat of Edmonton.

 Demography

Summary Statistics

 Measure                                          Jubilee           Enfield      Source

 Population Estimate (2019)                               15,450       333,794   ONS mid-year estimates 2019
 Children aged 0-15                                        3,761        76,137   ONS mid-year estimates 2019
 Working-age people (16-64)                                9,867       213,093   ONS mid-year estimates 2019
 Older people aged 65+                                     1,822        44,564   ONS mid-year estimates 2019
 % All Children aged 0-15                                   24.3          22.8   ONS mid-year estimates 2019
 % All Working-age (16-64)                                  63.9          63.8   ONS mid-year estimates 2019
 % All Older people aged 65+                                11.8          13.4   ONS mid-year estimates 2019
 % BAME - 2019                                              47.5          36.6   Enfield Council Estimates 2019
 % BAME - 2011                                              50.9          39.0   Census 2011
 % Not Born in UK - 2011                                    40.8          35.1   Census 2011
 % English is First Language of no one in
                                                             16.9         14.1 Census 2011
 household - 2011
                                                                               Ministry for Housing, Communities
 Area - Square Kilometres                                     3.9         82.2
                                                                               and Local Government
                                                                               ONS mid-year estimates 2019 /
 Population density (people per sq km)                      3,962        4,061
                                                                               MHCLG

Produced by the Insight Team                                                                                       2
If you have any queries relating to this document please email KIH@enfield.gov.uk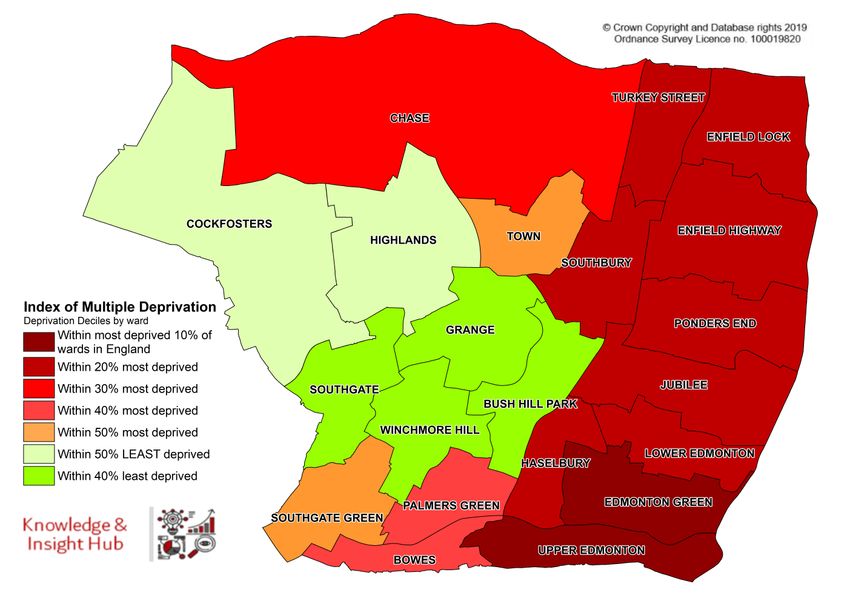
Population

According to the ONS mid-year estimate 2019 the total population is estimated to be 15,450. This
is the 13th highest (or 9th lowest) population of the 21 wards in Enfield.

  The population of Jubilee Ward has
  increased by 7.6% since the 2011 Census
  according to the estimate, which is higher
  than the average increase across all wards.

 The percentages of male and female residents in Jubilee Ward are 49.2% and 50.8%
 respectively. Female residents outnumber their male counterparts in most age groups after the
 age of 25 years. See chart above right.

Age Profile

                                                                                    The age
                                                                                    distribution of the
                                                                                    ward is similar to
                                                                                    the borough in
                                                                                    general, with
                                                                                    slightly higher
                                                                                    numbers of
                                                                                    people in the 5-14
                                                                                    age group.

                                                                                    For more detail,
                                                                                    see appendix.

Produced by the Insight Team                                                                              3
If you have any queries relating to this document please email KIH@enfield.gov.uk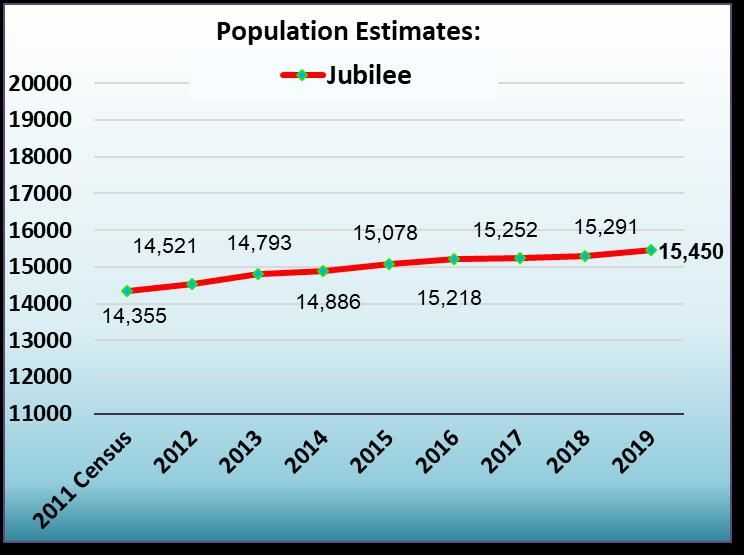
Ethnicity

The ward contains relatively large numbers in the Turkish, Kurdish, Somali and Other Black
African groups.

As at the 2011 Census, the percentages of Black, Asian and Minority Ethnic Group (BAME) was
50.9% and Non-UK Born residents was 40.8%. The percentage of households without English as
a first language was 16.9%

Enfield Council’s own 2019 estimates give the ward’s BAME Group to be 47.5% of the total
population.

Ethnicity estimates are produced in-house, using data from the 2001 and 2011 Censuses and the
School Census conducted by the local education authority (LEA). The School Census results
indicate the changing nature of the population and Enfield pupils recorded themselves under 95
different ethnic codes. Ward ethnicity populations have been consolidated and estimated for the 22
groups that make up the Council’s standard ethnic group classification (see table below) 1.

                                                        Jubilee                   Borough
        Ethnicity (2019)
                                             Estimated                       Estimated
                                                                  %                      %
                                             No.                             No.

    White British                                      3,496          23.3      128463      38.3
    White Irish                                          208           1.4        6427       1.9
    Greek                                                142           0.9        3862       1.2
    Greek Cypriot                                        595           4.0       15612       4.7
    Turkish                                            1,797          12.0       25413       7.6
    Turkish Cypriot                                      424           2.8        6079       1.8
    Kurdish                                              326           2.2        4152       1.2
    White Other                                          884           5.9       22501       6.7
    White & Black Caribbean                              220           1.5        4248       1.3
    White and Asian                                      155           1.0        3627       1.1
    White and Black African                               94           0.6        2303       0.7
    Other mixed                                          309           2.1        6562       2.0
    Indian                                               420           2.8       11066       3.3
    Pakistani                                             69           0.5        2407       0.7
    Bangladeshi                                          369           2.5        5971       1.8
    Chinese                                               53           0.4        2441       0.7
    Other Asian                                          720           4.8       11954       3.6
    Somali                                               691           4.6        9160       2.7
    Other Black African                                1,506          10.0       25032       7.5
    Black Caribbean                                    1,285           8.6       17561       5.2
    Other Black                                          552           3.7        8285       2.5
    Other Ethnic Group                                   690           4.6       12300       3.7

1
 Please note totals will not sum with ONS population estimates.
Produced by the Insight Team                                                                       4
If you have any queries relating to this document please email KIH@enfield.gov.uk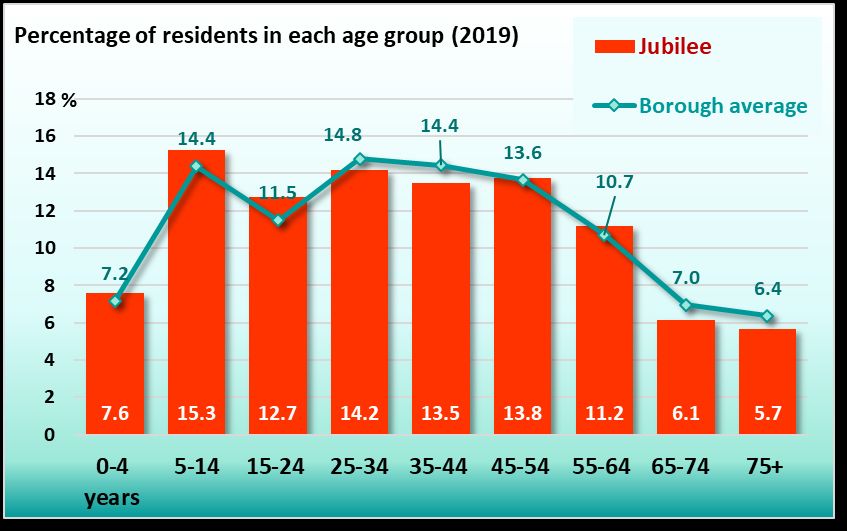
Language

The main languages of residents* given by 2011 Census estimates are:
   English                                      10,047        73%
   Turkish                                       1,287         9%
   Somali                                          244         2%
   Polish                                          196         1%
   Greek                                           173         1%
* aged 3 and over

Religion

Regarding Religion, the best guide is the 2011 Census. This showed the religious makeup of the
ward as:

                                                           Borough
  Religion                       No.       % share        average %
  Christian                     7527         52.4               53.6
  Buddhist                        57          0.4                0.6
  Hindu                          578          4.0                3.5
  Jewish                          25          0.2                1.4
  Muslim                        3460         24.1               16.7
  Sikh                            69          0.5                0.3
  Other/none/not stated         2639         18.4               23.8

Produced by the Insight Team                                                                     5
If you have any queries relating to this document please email KIH@enfield.gov.uk
Socio-economic factors
Socio-economic classification
The 2011 Census results
showed that Jubilee had
an above average
proportion of people in
routine occupations with
about 24% more people
than would be expected
from the Borough
average.
Low income households
Jubilee had the 13th highest average (median) household income of the 21 wards in Enfield, as
estimated by CACI in 2020. Average household income in the ward is below the median level
for the borough as a whole and is also lower than the London median average.
The proportion of households with an income of less than £15,000 was put at 17.8% compared
to a Borough average of 15.6%. This was the 9th highest proportion of the 21 wards.
Benefit Claims
At July 2020:
• The claimant count2 in Jubilee was 980, representing 10.1% of the local working-age
population.
• 32% of households in the ward (1,848) were claiming Universal Credit – this includes
working households.
Economically active people
The estimated proportion of people in work or looking for work (the economically active) was
slightly lower than the borough average in 2011. For number and rates see appendix.
2
The ‘narrow’ measure of unemployment: the number of people receiving either Job Seekers’ Allowance, or unemployed
claimants of Universal Credit who are required to seek work.
Produced by the Insight Team 6
If you have any queries relating to this document please email KIH@enfield.gov.ukDeprivation score
The Indices of Deprivation 2019 – produced for the Department of Communities and Local
Government– can be used to calculate the likely deprivation ranking of the ward. Analysis
carried out by the Local Government Association indicates that, within Enfield, Jubilee is the 7th
most deprived of the 21 wards in the Borough. The same analysis estimates that it is among
the 20% most deprived wards in England.
The map
illustrates
deprivation
levels for wards
in Enfield, when
compared with
the rest of the
7,180 wards in
England for
which data were
available.
Fuel Poverty
Ward-level analysis of government statistics3 reveal that, as at 2018, 15.6% of households in
the ward were in fuel poverty. This proportion was higher than both the borough and England
averages.
Crime
Appendix A has two crime related indicators by which the ward is compared to the Borough
average:-
• Crime rate
• Anti-social behaviour rate
The latest crime rates and trends for the ward can be obtained from the Metropolitan Police
crime mapping website.
3
Published by Department for Business, Energy & Industrial Strategy
Produced by the Insight Team 7
If you have any queries relating to this document please email KIH@enfield.gov.ukHealth
The most recent estimates of the life expectancies4 for men and women in the ward
are lower than the respective averages for both Enfield and England.
Considering the age structure of the ward the number of deaths is higher than would be
expected. Mortality rates from circulatory disease and coronary heart disease are particularly
high.
Life expectancies and Standardised Mortality Ratios by cause of death are shown in the charts
below.
General Health
In the 2011 Census
the population were
asked a question
about their general
health.
The graph (right)
shows the response.
For the numbers of
people in the above
categories see
appendix.
4
Public Health England: Life Expectancy at birth 2013-2017
Produced by the Insight Team 8
If you have any queries relating to this document please email KIH@enfield.gov.ukObesity The chart below shows the percentage of Reception and Year 6 children and adults in the ward who are overweight or obese, compared with the borough and national averages. The latest health information about the ward can be obtained from the Local Health website by choosing Find My Area and entering the ward name. Within the ward there is one GP surgery: o Nightingale House Surgery, 1 Nightingale Road, Edmonton N9 8AJ and two dental surgeries: o Mr A Trewella, 461 Hertford Road, N9 7DU o Mr B Pabani, 2 Mottingham Road, Edmonton, N9 8DY Produced by the Insight Team 9 If you have any queries relating to this document please email KIH@enfield.gov.uk
Housing

The 2011 (Census) profile of the households in the ward by housing tenure (sector) is:

    Tenure                                             No. (% share)                Borough average %
    Owner occupied                                     3107 (58.2%)                       58.8%
    Private rented                                     1408 (26.4%)                       23.6%
    Council                                             585 (11.0%)                       11.4%
    Registered social landlord                          242 (4.5%)                         6.2%

                                                                                        The 2011
                                                                                        Census data
                                                                                        provides a view
                                                                                        of the
                                                                                        accommodation
                                                                                        type by ward
                                                                                        compared with
                                                                                        the rest of the
                                                                                        borough.
                                                                                        In Jubilee ward
                                                                                        there is a higher
                                                                                        percentage of
                                                                                        terraced houses
                                                                                        compared with
                                                                                        the Enfield
                                                                                        average.
                                                                                        For the numbers
                                                                                        of dwellings in
                                                                                        the above
                                                                                        categories see
                                                                                        appendix.

In the year to December 2019 the median house price for Jubilee ward was £355,000, 15%
lower than the Borough median of £417,500, and having fallen by 1% since the previous year.

Produced by the Insight Team                                                                                10
If you have any queries relating to this document please email KIH@enfield.gov.uk
Education There are five primary schools, one secondary school and one all-through school in the ward: Galliard Primary School - http://www.galliardprimaryschool.co.uk/ Houndsfield Primary School – http://houndsfield.school/ Cuckoo Hall Academy - https://www.cuckoohallacademy.org.uk/ Woodpecker Hall Primary Academy - https://www.woodpeckerhallacademy.org.uk/ Delta Primary School - https://www.deltaprimaryelt.org/ AIM Academy North London (formerly the Nightingale Academy) - https://www.aimnorthlondon.org.uk/ Edmonton County Upper School - http://www.edmontoncounty.co.uk/ School performance The Department for Education publishes school performance data on their searchable webpages. Qualifications in adults Taken from the 2011 Census data the graph below shows the % of qualifications by population in the ward. Qualifications: The term ‘no qualifications’ describes people without any academic, vocational or professional qualifications. The term ‘lower level’ qualifications is used to describe qualifications equivalent to levels 1 to 3 of the National Key Learning Targets (i.e. GSCE’s O levels, A levels, NVQ levels 1-3). The term ’Higher level’ refers to qualifications of levels 4 and above (i.e. first degrees, higher degrees, NVQ levels 4 and 5, HND, HNC and certain professional qualifications). Produced by the Insight Team 11 If you have any queries relating to this document please email KIH@enfield.gov.uk
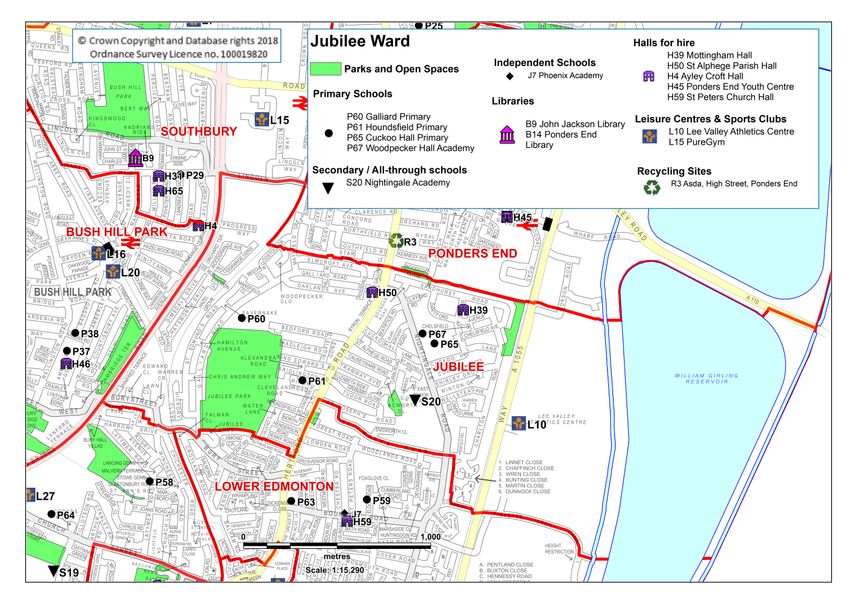
Culture and Leisure

There are no static libraries in the ward, but two just outside the ward’s northern boundary in
neighbouring wards:

John Jackson Library
Bush Hill Park
Tel No 020 8379 1709

Ponders End Library
Tel No 020 8379 1712

The ward has no leisure centres within its boundaries, with the nearest facilities located in the
neighbouring ward of Southbury:

Southbury Leisure Centre at Southbury Leisure Park
Tel No: 020 8245 3201

The ward has 5 parks and open spaces;

   o   Lee Road Open Space
   o   Boundary Ditch
   o   Cuckoo Hall Rec
   o   Turin Road
   o   Jubilee Park

There are also the following sports and social clubs in the ward:

Lee Valley Athletics Centre on Meridian Way.
http://www.leevalleypark.org.uk/en/content/cms/leisure/activities_and_sport/athletics_centre/ath
letics_centre.aspx
Tel No: 020 8344 7230

Lee Valley Leisure Golf Course on Meridian Way
https://www.visitleevalley.org.uk/en/content/cms/outdoors/golf/golf-courses-in-london/
Tel No: 020 8803 3611

Picketts Lock Indoor Bowls Club on Meridian Way, N9 0AS. For more information telephone the
club office on 0208 524 0052.

There are allotments at Houndsfield Road Allotments on Hertford Road, N9 7RE. For further
information contact Enfield Council on 020 8379 1000 or visit the Enfield Council website.

There are 3 places of worship within the boundaries of the ward:

   o Tramway Christian Fellowship                      Tel No 020 8805 3000
   o Seventh Day Adventist Church                      http://www.edmontonsda.org/
   o St. Alphege Church                                Tel No 020 8245 3588

Produced by the Insight Team                                                                      12
If you have any queries relating to this document please email KIH@enfield.gov.uk
Voluntary and Community Sector

Some locally based community organisations are given below.

   •   Federation of Enfield Community Associations, N9 8DX – The Federation of Enfield
       Community Associations (FECA) is an organisation run by tenants and leaseholders, for
       all residents in the London Borough of Enfield, giving advice and information on housing
       matters.
       Further information: http://www.feca.co.uk/

   •   Homeless Resource Centre, Tramway Avenue, N9 8PD - The Homeless Resource
       Centre is a voluntary organization, which seeks to empower the homeless and help them
       to fulfil their potential, through their provision of resources, support and expertise. HRC
       is established to assist, and is committed to serve, homeless individuals between the
       ages of 16 and 70. HRC will work towards ending street and other varieties of
       homelessness, through practical action, aimed at helping homeless people move
       towards a more secure, independent lifestyle.
       Further information: http://www.homelessresourcecentre.com/

   •   Hope and Restoration – www.hrtrainingprofessional.co.uk

   •    North Enfield Foodbank - Schools, churches, businesses and individuals donate non-
        perishable, in-date food to the foodbank. All food given out by foodbanks is donated.
       ‘Supermarket Collections’ are one of the main ways that food is donated: These are food
       drives held at supermarkets where volunteers give shoppers a ‘foodbank shopping list’
       and ask them to buy an extra item or two for local people in crisis.

         Foodbank Centre and Office
         Unit 2, Lumina Way
         (off Lincoln Road)
         Enfield
         EN1 1FS
         Website: http://northenfield.foodbank.org.uk/

Additional Sources of information

For local information visit the Enfield Council website homepage: http://www.enfield.gov.uk/.
Creating an Enfield Connected account will enable you to find out about local events and
services.

A collation of various data including latest best estimates is at Appendix A.

For statistics, search on the London Datastore or select profiles or data on NOMIS.

Produced by the Insight Team                                                                    13
If you have any queries relating to this document please email KIH@enfield.gov.uk
Produced by the Insight Team 14 If you have any queries relating to this document please email KIH@enfield.gov.uk
Appendix A – Data tables
                                                                                           Borough
                                                                                                       relative %
                                                                       No           %      average no.
                                                                                                       diff.
                                                                                           /%
TOTAL:-
POPULATION – 2019                                                     15450                    15895           -3
HOUSEHOLDS – 2011                                                      5342                     5710           -6
 Owner Occupied                                                        3107         58.2        58.8           -1
 Council                                                                585         11.0        11.4           -4
 Registered Social Landlord                                             242          4.5         6.2          -27
 Private Renting                                                       1408         26.4        23.6           12
AGE STRUCTURE – 2019
 0-4                                                                   1170          7.6          7.2           6
 5-14                                                                  2358         15.3         14.4           6
 15-24                                                                 1967         12.7         11.5          11
 25-44                                                                 4276         27.7         29.2          -5
 45-64                                                                 3857         25.0         24.4           2
 65-74                                                                  947          6.1          7.0         -12
 75+                                                                    875          5.7          6.4         -11
ETHNIC MIX – 2019 (Enfield Council Estimates)
White British                                                           3496        23.3          38.3        -39
White Irish                                                              208         1.4           1.9        -28
Greek                                                                    142         0.9           1.2        -18
Greek Cypriot                                                            595         4.0           4.7        -15
Turkish                                                                 1797        12.0           7.6         58
Turkish Cypriot                                                          424         2.8           1.8         56
Kurdish                                                                  326         2.2           1.2         76
White Other                                                              884         5.9           6.7        -12
White & Black Caribbean                                                  220         1.5           1.3         16
White and Asian                                                          155         1.0           1.1         -4
White and Black African                                                   94         0.6           0.7         -9
Other mixed                                                              309         2.1           2.0          5
Indian                                                                   420         2.8           3.3        -15
Pakistani                                                                 69         0.5           0.7        -36
Bangladeshi                                                              369         2.5           1.8         38
Chinese                                                                   53         0.4           0.7        -52
Other Asian                                                              720         4.8           3.6         35
Somali                                                                   691         4.6           2.7         69
Black African                                                           1506        10.0           7.5         34
Black Caribbean                                                         1285         8.6           5.2         64
Other Black                                                              552         3.7           2.5         49
Other Ethnic Group                                                       690         4.6           3.7         25
RELIGION – 2011
Christian                                                              7527         52.4         53.6          -2
Buddhist                                                                 57          0.4          0.6         -32
Hindu                                                                   578          4.0          3.5          15
Jewish                                                                   25          0.2          1.4         -88
Muslim                                                                 3460         24.1         16.7          44
Sikh                                                                     69          0.5          0.3          39
Other / not stated / none                                              2639         18.4         23.9         -23

Produced by the Insight Team                                                                                        15
If you have any queries relating to this document please email KIH@enfield.gov.uk
Appendix A – Data tables
Borough
relative %
No % average no.
diff.
/%
ECONOMIC ACTIVITY in the 16-64 age group
All economically active, 2011 6501 70.4 73.4 -4
Unemployed — Claimant Count July 2020 980 10.1 8.9 13
INCOME - 2020
Households with less than £15,000 (gross) a year 1032 17.8 15.6 14
Households claiming Universal Credit (May 2020) 1848 31.9 23.7 34
QUALIFICATIONS – 2011
No qualifications 3115 28.5 23.0 24
Level 1 only 1551 14.2 12.9 10
Level 2 1544 14.1 13.8 2
Level 3 1161 10.6 10.5 1
Level 4 and above 2283 20.9 28.7 -27
HOUSING TYPE – 2011
Detached 288 5.3 7.0 -24
Semi-detached 1080 19.9 23.5 -15
Terraced 2557 47.2 31.1 52
Flat - purpose built 1263 23.3 30.1 -23
Flat - in a shared house 167 3.1 6.8 -54
Other 65 1.2 1.5 -22
CARS IN HOUSEHOLDS – 2011 - nos. of households with:
0 cars 1864 34.9 32.5 7
1 car 2256 42.2 43.3 -2
2+ cars 1222 22.9 24.3 -6
HOUSEHOLD TYPES – 2011
One person 1563 29.3 27.8 5
All occupants aged 65 plus 277 5.2 5.5 -5
Married couple or civil partnership, no children 329 6.2 7.9 -23
Married couple or civil partnership, with dependent children 945 17.7 17.4 2
Married couple or civil partnership, all children non dependent 434 8.1 6.8 19
Cohabiting couple, no children 120 2.2 3.4 -35
Cohabiting couple, with dependent children 146 2.7 3.0 -8
Cohabiting couple, all children non dependent 16 0.3 0.4 -30
Lone parent 957 17.9 16.7 8
Other 555 10.4 11.0 -6
PERSONS WITH LONG TERM HEALTH PROBLEM / DISABILITY– 2011
Limiting a lot 1155 8.0 7.3 11
Limiting a little 1217 8.5 8.1 5
GENERAL HEALTH – 2011
Very good 6323 44.0 46.8 -6
Good 5123 35.7 35.0 2
Fair 1979 13.8 12.7 9
Bad 698 4.9 4.1 18
Very bad 232 1.6 1.3 21
LIFE EXPECTANCY (years) - 2013-2017:
Males 77.9 80.3 -3
Females 82.5 84.5 -2
Standardised Mortality Ratio - 2013-2017 111.5 91.5 22
COMMUNITY SAFETY - 2019
Crime rate (per 1,000 residents) 78.3 89.6 -13
Anti-social behaviour rate 19.5 28.1 -31
Produced by the Insight Team 16
If you have any queries relating to this document please email KIH@enfield.gov.ukSources and related notes Population – ONS mid-year population estimate 2019 Households – 2011 Census; © Crown Copyright Age structure – ONS mid-year population estimate 2019 Religion – 2011 Census; © Crown Copyright Ethnic mix – Council estimates for 2019; note there are difficulties in estimating ethnic group sizes at ward level and the figures given here must be treated with caution and used as a guide to the possible mix in the ward Economic Activity – all economically active 16-64 year olds = working plus unemployed – 2011 Census; © Crown Copyright, the activity rate (%) is the % of the population aged 16-64 Unemployed — the official DWP ‘claimant count’, July 2020 Income – Low income households – CACI Paycheck; 2020; © CACI Qualifications – 2011 Census; © Crown Copyright; note that this table excludes apprenticeships and ‘other’ qualifications Housing type – 2011 Census; © Crown Copyright Cars – 2011 Census; © Crown Copyright Household types – 2011 Census; © Crown Copyright Persons with a long-term health problem/disability – 2011 Census; © Crown Copyright General health – 2011 Census; © Crown Copyright Life expectancy – Public Health England, based on 2013-2017 data Crime rate – uses crime counts from the Metropolitan Police for 2019 The relative % diff[erence] is the area % divided by the Borough % (expressed as a % above or below the Borough average) We welcome your feedback on this Ward Profile. Please send any comments or suggestions to: KIH@enfield.gov.uk Produced by the Insight Team 17 If you have any queries relating to this document please email KIH@enfield.gov.uk
You can also read