February 2021 Tennessee State Climate Summary - East ...
←
→
Page content transcription
If your browser does not render page correctly, please read the page content below
February 2021 Tennessee State Climate Summary
February 2021 Tennessee State Climate Summary
Tennessee Climate Office * East Tennessee State University
Prepared by William Tollefson and Dr. Andrew Joyner
With contributions by Climate Data Representatives at University of Memphis, University of Tennessee-
Martin, Vanderbilt University, University of Tennessee-Knoxville, and
University of Tennessee-Institute of Agriculture
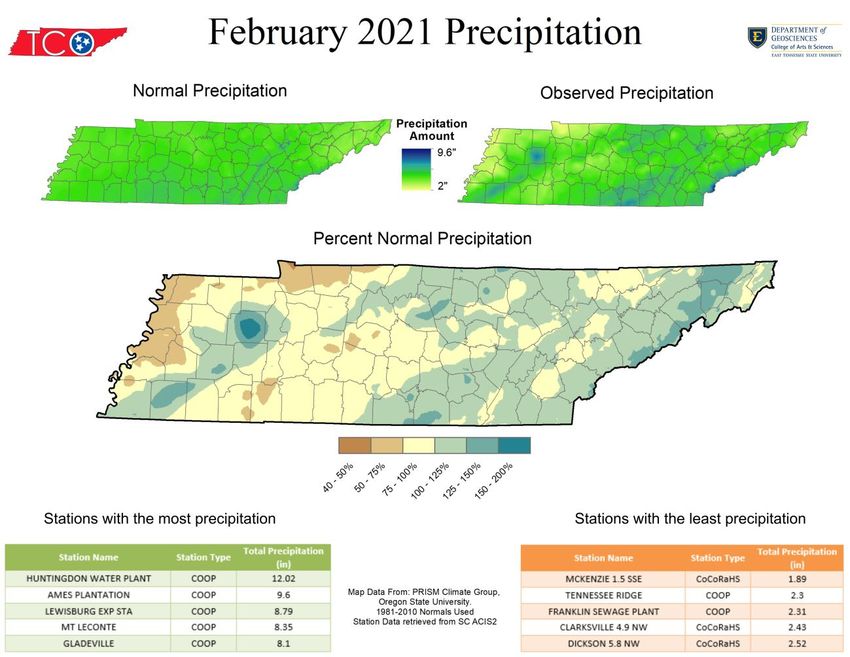
Monthly Temperature Summary:
Temperatures varied widely this month, with several weather stations reporting temperatures from
below 0°F to upper 70’s. There was also a strong spatial gradient to mean temperatures across the state,
with the westernmost counties averaging 8-10°F colder than the 1981-2010 climate normal, while eastern
portions of the state were much closer to normal.
The coldest period of the month occurred from February 10 to 19, when there were 79 broken and 9 tied
record-low daily high temperatures and 24 broken and 2 tied record-low daily low temperatures (at
weather stations in the state with at least a 30-year record). The cold air mass was strongest and most
persistent in West Tennessee with a moderating trend towards the east. This contrast was at its most
extreme on February 15, when the high temperature recorded at Memphis International Airport was 15°F
while the high temperature recorded at the Tri-Cities airport in northeast Tennessee was 55°F. The length
of the cold outbreak was also extreme, with Memphis staying below freezing for nine days, which tied the
record for longest streak below freezing (it happened previously in 1940 and 1899)!
1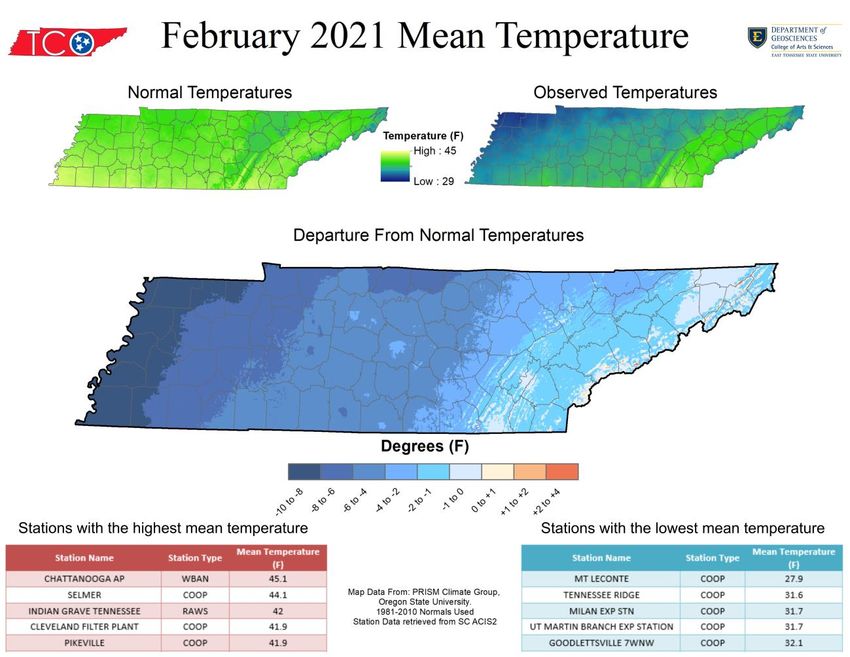
February 2021 Tennessee State Climate Summary

Monthly Precipitation Summary:
Generally, the eastern half of the state recorded above normal precipitation for the month, whereas the
western half recorded below normal precipitation. Northeast Tennessee recorded consistently above
normal precipitation week-to-week through the month with several rain and snow events. Widespread
rain, snow, and ice events brought normal to above normal precipitation to most of East and Middle
Tennessee by the middle of the month. Heavy rains and thunderstorms brought above normal
precipitation to all areas of the state at the very end of the month. A band of very heavy rains set up in
West Tennessee and produced 4-5” of rain, leading to an area of above normal precipitation for the month
from Memphis to the northeast through parts of Carroll and Benton counties.
The major winter storms that impacted the state in the middle of the month brought significant snow,
sleet, and freezing rain accumulations to many areas in addition to increased rainfall. Memphis was the
snowiest of the major cities in Tennessee, with the Memphis International Airport reporting ten inches of
snow during the month.

                                                                                                        2
February 2021 Tennessee State Climate Summary

Station Data and Top Tenn. (warmest/wettest, coldest/driest stations of the month):
Station data for airports across the state using WBAN weather stations:
                                        Temperatures (˚F)                             Precipitation (inches)
 Station Name             Averages                            Extremes                       Totals
                Max    Min      Mean   Depart    High       Date    Low     Date   Obs     Depart      %Norm
  Memphis       44.6   26.4     37.0    -8.5      75        2/28        1   2/16   6.95     +2.56       158%
   Jackson      44.0   26.9     35.4    -6.9      74        2/28        0   2/16   6.84     +2.67       164%
  Clarksville   42.2   26.1     34.2    -5.4      71        2/28        5   2/16   4.57     +0.40       110%
   Nashville    47.0   29.9     38.4    -3.3      75        2/28    11      2/16   4.81     +0.87       122%
 Chattanooga    54.8   35.4     45.1   +0.7       77        2/28    21      2/17   5.17     +0.33       107%
  Crossville    45.0   28.8     36.9    -2.4      69        2/28    11      2/17   4.17     -0.29        93%
   Knoxville    51.2   32.4     41.8    -0.6      75        2/28    20      2/17   4.35     +0.09       102%
   Bristol     50.9 30.6 40.8       +1.8     76     28/28    19     2/4      4.89    +1.44      142%
Departures and %Norm Key: Warmer than Normal, Cooler than Normal; Wetter than Normal, Drier than Normal
                              Hottest Stations (highest maximum temperature)
                                                                         Highest
                                                              Station
                               Station Name                            Temperature Date
                                                               Type
                                                                           (F)
                         WOODBURY 1 WNW                       COOP         78          28
                          CHATTANOOGA AP                     WBAN          77          28
                           NEWPORT 1 NW                       COOP         77          28
                            DECATURVILLE                      COOP         77          25
                              BRISTOL AP                     WBAN          76          28
                     HAMBLEN CO HQ TENNESSEE                  RAWS         76          28
                   MERIWETHER LEWIS TENNESSEE                 RAWS         76          24
                    MEMPHIS INTERNATIONAL AP                 WBAN          75          28
                          NASHVILLE INTL AP                  WBAN          75          28
                             KNOXVILLE AP                    WBAN          75          28
                       SHILOH NMP TENNESSEE                   RAWS         75          24
                                SELMER                        COOP         75           8
                       NASHVILLE BERRY FIELD                  COOP         75          25
                         THOMPSON STATION                     COOP         75          28
                   MOUSETAIL LANDING STATE PARK               COOP         75          25
                   Eight stations tied for the eighth highest maximum temperature (75°F).

                                                                                                               3
February 2021 Tennessee State Climate Summary

                           Coldest Stations (lowest minimum temperature)
                                                       Station       Lowest
                           Station Name                                                  Date
                                                        Type      Temperature (F)
                            BRENTWOOD                   COOP           -8                21
                         GERMANTOWN 4SE                 COOP              -5             16
                           BROWNSVILLE                  COOP              -1             16
                           MILAN EXP STN                COOP              -1             19
                       SAMBURG W. L. REFUGE             COOP              -1             16
                         CLARKSVILLE WWTP               COOP              0              15
                    JACKSON MCKELLAR- SIPES AP          WBAN              0              16
                         AMES PLANTATION                COOP              1              16
                              DRESDEN                   COOP              1              17
                  UT MARTIN BRANCH EXP STATION          COOP              1              16
                           JACKSON 4 NE                 COOP              1              17
                    MEMPHIS INTERNATIONAL AP            WBAN              1              16
                        DYERSBURG III GOLF              WBAN              1              16
                           MEMPHIS WFO                   WBAN             1              17
                        Seven stations tied for the seventh coldest temperature (1°F).

                           Warmest Stations (highest mean temperatures)
                                                                       Mean Temperature
                            Station Name               Station Type
                                                                              (F)
                         CHATTANOOGA AP                   WBAN               45.1
                              SELMER                       COOP                44.1
                      INDIAN GRAVE TENNESSEE              RAWS                  42
                      CLEVELAND FILTER PLANT               COOP                41.9
                              PIKEVILLE                    COOP                41.9
                      COKER CREEK TENNESSEE               RAWS                 41.8
                           KNOXVILLE AP                   WBAN                 41.8
                          NEWPORT 1 NW                     COOP                41.6
                          OAK RIDGE ASOS                  WBAN                 41.4
                    HAMBLEN CO HQ TENNESSEE               RAWS                 41.1
                       LENOIR CITY TENNESSEE              RAWS               41.1
                     Two stations tied for the tenth warmest mean temperature (41.1°F).

                                                                                                4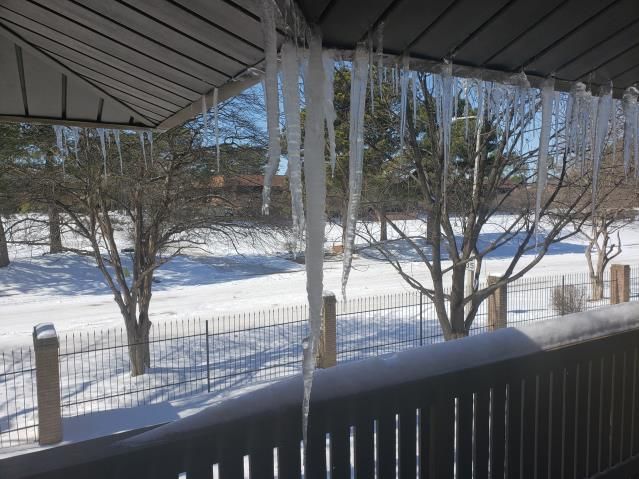
February 2021 Tennessee State Climate Summary

                             Coolest Stations (lowest mean temperatures)
                                                                    Mean Temperature
                            Station Name            Station Type
                                                                           (F)
                            MT LECONTE                  COOP              27.9
                          TENNESSEE RIDGE               COOP              31.6
                           MILAN EXP STN                COOP              31.7
                   UT MARTIN BRANCH EXP STATION         COOP              31.7
                       GOODLETTSVILLE 7WNW              COOP              32.1
                              DRESDEN                   COOP              32.3
                         CROSSVILLE EXP STN             COOP              32.8
                      SPRINGFIELD EXP STATION           COOP              33.2
                          CLARKSVILLE NO.2              COOP              33.2
                            BETHPAGE 1 S                COOP              33.4

                            Wettest Stations (highest precipitation totals):
                                                                    Total Precipitation
                            Station Name             Station Type
                                                                            (in)
                     HUNTINGDON WATER PLANT              COOP              12.02
                          AMES PLANTATION                COOP                 9.6
                         LEWISBURG EXP STA               COOP                 8.79
                             MT LECONTE                  COOP                 8.35
                             GLADEVILLE                  COOP                 8.1
                           CHRISTIANA 5W                 COOP                 8.05
                           BENTON 2.3 ESE             CoCoRaHS                7.86
                          OLD HICKORY DAM                COOP                 7.85
                              CARTHAGE                   COOP                 7.84
                            HOHENWALD                    COOP                 7.61

                             Driest Stations (lowest precipitation totals):
                                                                    Total Precipitation
                            Station Name             Station Type
                                                                            (in)
                          MCKENZIE 1.5 SSE            CoCoRaHS             1.89
                          TENNESSEE RIDGE                COOP                 2.3
                       FRANKLIN SEWAGE PLANT             COOP                 2.31
                         CLARKSVILLE 4.9 NW           CoCoRaHS                2.43
                           DICKSON 5.8 NW             CoCoRaHS                2.52
                        CLARKSVILLE 4.0 WNW           CoCoRaHS                2.52
                          LEBANON 10.5 ENE            CoCoRaHS                2.52
                              DRESDEN                    COOP                 2.52
                       CHEATHAM LOCK & DAM               COOP                 2.65
                         BROWNSVILLE 1.0 SE           CoCoRaHS                2.67

                                                                                          5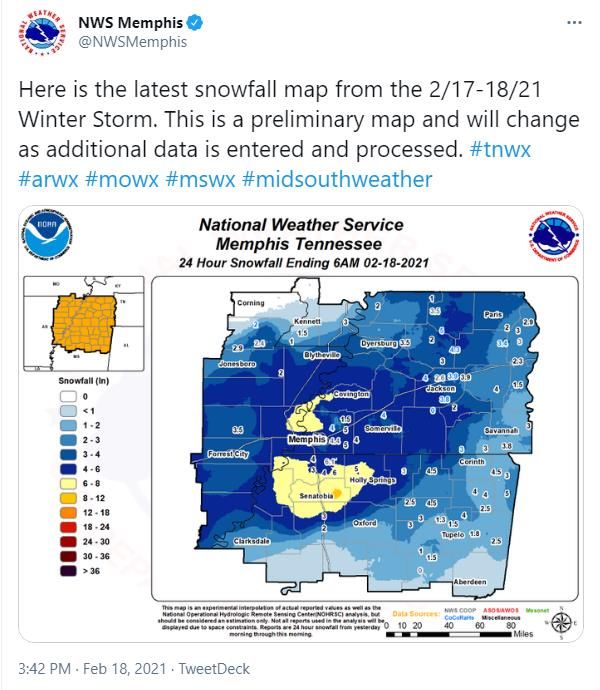
February 2021 Tennessee State Climate Summary

                          Snowiest Stations (highest snowfall accumulations):
                             Station Name               Station Type   Total Snowfall (in)
                             MT LECONTE                    COOP               18.6
                           NEWFOUND GAP                    COOP               15.9
                          JAMESTOWN 3.1 SE               CoCoRaHS             12.9
                          FALL CREEK FALLS SP              COOP               12.6
                              MONTEREY                     COOP               12.2
                         MCMINNVILLE 8.5 ESE             CoCoRaHS             11.9
                              COOKEVILLE                   COOP               11.6
                          CROSSVILLE EXP STN               COOP               11.5
                          COOKEVILLE 3.3 SSW             CoCoRaHS             10.9
                           GREENFIELD 0.3 SW               CoCoRaHS             10.9
                  An additional 260 stations reported measurable snowfall during the month,
                   and an additional 21 stations reported a trace amount of snow (less than
                         1/10th inch). 104 stations reported no snow during February.

                                                                                              6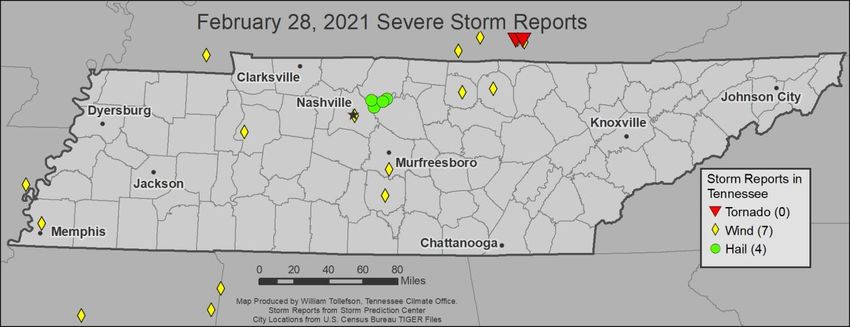
February 2021 Tennessee State Climate Summary

The Month in Comparison:
Comparing the mean temperature and total precipitation of February 2021 to the February data from the
previous thirty years, the same west-to-east trend in mean temperatures becomes apparent. Memphis
recorded its second coldest February of the last thirty years (with only 2015 being colder), Jackson
recorded its third coldest February, and Nashville recorded its fifth coldest February in that same time
period. Whereas, Chattanooga, Knoxville, and Bristol were all near the middle of the pack, and close to
the average value of the last thirty years. Precipitation was close to or above the average of the past thirty
years at most of the airports as well. For the first time in three years, extremely above average
precipitation and flooding weren’t the major stories of February. These graphs highlight just how
anomalous the rainfall totals were in February of 2018 through 2020 in most areas of the state.

                                                                                                            7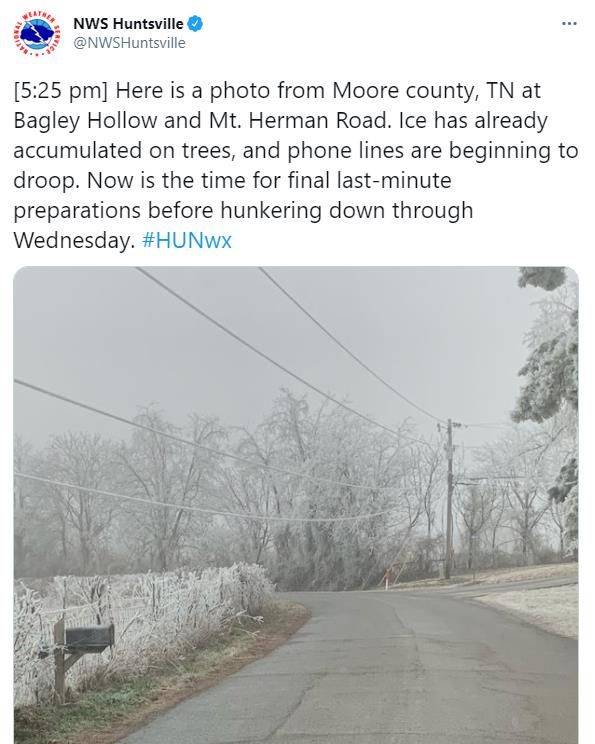
February 2021 Tennessee State Climate Summary

                                                8
February 2021 Tennessee State Climate Summary

                                                9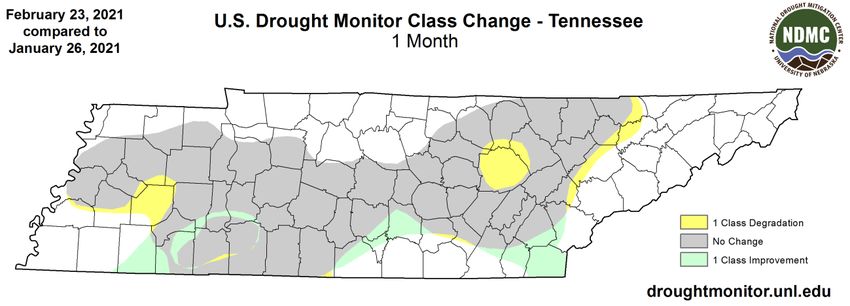
February 2021 Tennessee State Climate Summary

Drought Monitor:
The last Drought Monitor release in February showed about half the state in D0 (Abnormally Dry)
conditions, with two smaller regions of D1 (Moderate Drought) centered around Cumberland County in
the eastern half of the state and Hardin and Wayne counties in the western half of the state totaling about
5% of the state’s area. Compared to the end of January, this was a similar pattern, with slight
improvements in southern sections of the state, and slight degradation in the northern half of the state.
Heavy rains and snow/ice melt towards the end of the month did result in major improvements, and the
first drought monitor release of March cleared the state of D1 (Moderate Drought) and all areas that were
depicted as abnormally dry as of February 23 were cleared from the drought monitor maps.

Soil Moisture:
The calculated average soil moisture level for February was between 500 and 600mm, which was slightly
below average for this time of year in most areas of the state. However, snow/ice melt and rain in the
second half of the month led to improvements in soil moisture levels. The US Department of Agriculture
state stories report for the week ending February 21, indicated that the percent of Tennessee reporting
shortages in topsoil and subsoil moisture dropped to just 1% each. The percent of the state reporting
surplus topsoil moisture increased to 52% and surplus subsoil moisture was reported in 38% of the state.
Subsoil moisture is taking a bit longer to recharge after the abnormally dry and moderate drought
conditions of earlier in the winter.

                                                                                                        10
February 2021 Tennessee State Climate Summary
11February 2021 Tennessee State Climate Summary
Streamflow:
Despite drier than normal conditions for most of the month, streamflow levels were in the normal range
for this time of year across most of the state, with streams in extreme East Tennessee reporting
streamflow levels above normal since that region of the state has recorded above normal precipitation
for most of 2021.
Miscellaneous:
Crop Conditions from USDA: Winter wheat conditions were reported as 5% poor, 33% fair, 53% good, and
9% excellent. Pasture and Range conditions were reported as 3% very poor, 32% poor, 39% fair, 23% good,
and 3% excellent. Cattle conditions were reported as 7% poor, 36% fair, 50% good, and 7% excellent. Hay
and roughage supplies were 1% very short, 20% short, 70% adequate, and 9% surplus. The cold conditions
and multiple ice and snow events in February caused an increase in feeding cattle, but hay and roughage
supplies are mostly adequate. Some reports indicate calf loss and other livestock stress due to cold
temperatures.
12February 2021 Tennessee State Climate Summary
Fire Danger: The Interagency Fire Center significant wildland fire potential outlook for March shows that
all of Tennessee, as well as most surrounding regions will have below normal chance for significant
wildfires.
Snow: Multiple snowstorms with significant sleet and ice accumulations as well impacted the state this
month. West and Middle Tennessee were the most impacted during the back-to-back major winter storms
in the middle of the month. The Cumberland Plateau and East Tennessee recorded a few moderate
snowfalls in the first part of the month (February 2 & 7). Snow reports of up to six inches from northern
portions of the Cumberland Plateau on February 7 were the highest snowfall totals reported in the
Nashville National Weather Service forecast region in three years, that event was soon followed up by
similar snow totals in southern Wayne, Lawrence, and Giles Counties along the Alabama border on
February 18. The greatest extent of snow coverage occurred on February 18, when a majority of the state
had snow on the ground.
13February 2021 Tennessee State Climate Summary
Story of the Month:
The main story of February 2021 was the back-to-back winter storms and the extreme cold affecting West
and Middle Tennessee during the middle of the month. February 2021 brought the first winter storm
warnings issued by the Nashville office of the National Weather Service since January of 2018, and the
first winter storm warnings issued by the Memphis office of the National Weather Service since December
of 2018.
The first winter storm impacted the state from February 14-15 with some snow, but more significant sleet
and freezing rain ice accumulations. Icy trees and power lines led to some power outages and icy roads
led to numerous traffic crashes across the state. In this storm, some locations reported over two inches
of sleet accumulation.
After the first winter storm cleared out on February 15, the coldest temperatures were reported across
the state as many locations didn’t warm out of the teens for daytime highs. Morning lows on February 16
reached 0°F in Jackson, 1°F at Memphis, and several COOP weather observers reported conditions below
zero.
14February 2021 Tennessee State Climate Summary
The second winter storm followed from February 17-18 with some sleet and freezing rain, but with more
snow and higher snow totals associated with this winter storm, which accumulated on top of the ice, sleet,
and snow that had not melted from the first storm.
As noted in the monthly temperature summary section of this report, there was a strong west-to-east
gradient in temperatures during this cold outbreak. This was due in part to the shallow nature of the arctic
air pool which struggled to cross the higher elevations of the Cumberland Plateau, the shallow nature of
the cold pool is also what led to so much ice and sleet with the winter storms. The location of the jet
stream was also important in the temperature gradient, as East Tennessee had winds out of the south for
most of the cold period resulting in a warmer air mass and down sloping winds from the Appalachian
Mountains that produced further warming. This contrast is highlighted by the 40-degree temperature
gradient observed on February 15, when Memphis International Airport recorded a high temperature of
15°F while the Tri-Cities Airport in northeast Tennessee recorded a high temperature of 55°F.
This cold spell was also notable due to its length, the coldest period of the month occurred from February
10 to 19, when there were 79 broken and 9 tied record-low daily high temperatures and 24 broken and 2
tied record-low daily low temperatures (at weather stations in the state with at least a 30-year record).
Memphis stayed below freezing for nine days, which tied the record for longest streak below freezing (it
happened previously in 1940 and 1899). In Nashville, temperatures remained below freezing for seven
days, which tied the record for 5th longest streak of below freezing temperatures.
15February 2021 Tennessee State Climate Summary
16February 2021 Tennessee State Climate Summary
On the left is a picture of snowfall in Martin, Tennessee during the first of the two storms (courtesy of Dr. Mark
Simpson, UT-M). Dr. Simpson reported about a tenth of an inch of ice and five inches of sleet and snow in the first
round and 3.5 inches in the second round. On the right is a picture of a 39” icicle in Memphis, Tennessee on Feb.
20th (yikes! Courtesy of Dr. Dorian Burnette, U. of Memphis).
17February 2021 Tennessee State Climate Summary
Storm Reports:
*Storm Reports are based on filtered NOAA Storm Prediction Center data or local NWS storm reports. Future quality
control checks may change the official record of severe events, please see spc.noaa.gov for any updates.
There was one day with severe storm reports in Tennessee, resulting in 7 reports of severe wind damage
(producing 2 injuries), and four reports of severe hail (one-inch or larger).
Wind Reports:
Time Speed
Location County Lat Lon Comments
(UTC) (mph)
*** 1 INJ *** LARGE TREE DOWN ON
HOUSE AT BROWN AVENUE NEAR NORTH
0:17 -- 2 S FRAYSER SHELBY 35.19 -89.97 EVERGREEN. CHILD WAS RESCUED AFTER
BEING TRAPPED. TIME IS RADAR
ESTIMATED. (MEG)
SEVERAL TREES AND POWER LINES DOWN
3 ESE NEW AND DAMAGE REPORTED TO A FEW
0:35 -- HUMPHREYS 36.01 -87.91
JOHNSONVILLE HOMES ON MILL ROAD AND OLD STATE
ROAD IN NEW JOHNSONVILLE. (OHX)
*** 1 INJ *** A CHILD WAS INJURED
1 SE AFTER COMING INTO CONTACT WITH A
1:45 -- DAVIDSON 36.16 -86.77
NASHVILLE DOWNED POWER LINE ON UNIVERSITY
COURT IN NASHVILLE (OHX)
TREES DOWN ON SEVERAL ROADWAYS
2:15 -- GAINESBORO JACKSON 36.36 -85.65
ACROSS THE COUNTY (OHX)
TREE DOWN BLOCKING LINDER
MOUNTAIN ROAD AND POWER POLE AND
2:30 -- LIVINGSTON OVERTON 36.39 -85.33
LINES DOWN BLOCKING HIGHWAY 111
NEAR BIG SPRINGS ROAD (OHX)
ROOF BLOWN OFF THE PRESS BOX AT
3:54 -- SHELBYVILLE BEDFORD 35.49 -86.45 SHELBYVILLE CENTRAL HIGHSCHOOL. TIME
ESTIMATED VIA RADAR. (OHX)
TSPOTTER REPORT OF A COUPLE TREES
9 NNW BELL
3:55 -- RUTHERFORD 35.71 -86.41 AND LIMBS DOWN NEAR CHRISTIANA.
BUCKLE
(OHX)
18February 2021 Tennessee State Climate Summary
Hail Reports:
Time Size
Location County Lat Lon Comments
(UTC) (in)
RETIRED NWS EMPLOYEE REPORTED
CYLINDRICAL SHAPED HAIL. OTHER PHOTOS IN
1:53 1.50 GREEN HILL WILSON 36.23 -86.57
AREA CONFIRM UNUSUAL LONG NARROW
HAIL. (OHX)
TSPOTTER REPORT OF QUARTER SIZE HAIL
2:02 1.00 HENDERSONVILLE SUMNER 36.29 -86.6 REPORT NEAR INDIAN LAKE PENINSULA IN
HENDERSONVILLE (OHX)
2:08 1.00 LAGUARDO WILSON 36.3 -86.44 PEA TO QUARTER SIZE HAIL (OHX)
FACEBOOK REPORT OF ESTIMATED 1.25" SIZED
5 NW CAIRO
2:37 1.25 WILSON 36.28 -86.48 HAIL ON BURTON RD. IN WILSON COUNTY.
BEND
(OHX)
CPC Outlooks for the Next Month:
Looking ahead to March, the NOAA Climate Prediction Center predicts that all of Tennessee will likely see
warmer than normal temperatures for the month, and above normal precipitation.
19February 2021 Tennessee State Climate Summary
20You can also read