Climate Outlook Review - Northern Australia January 2019 Authors: Prof Roger C Stone & Dr Chelsea Jarvis - Centre for Applied Climate Sciences
←
→
Page content transcription
If your browser does not render page correctly, please read the page content below
Centre for Applied Climate Sciences

Climate Outlook Review –
Northern Australia

January 2019

Authors: Prof Roger C Stone
& Dr Chelsea Jarvis

University of Southern Queensland | Document title               1
2

Overview

   Rainfall: Generally average to below average probability values
   for most regions. There is currently a slight variation in model
   forecasts for the next three months with the SOI (phase) model
   indicating close to ‘average’ rainfall for most northern districts,
   relative to this time of the year. However, the Bureau of
   Meteorology, UK Met Office, and ECMWF seasonal forecasts for
   northern Australia are indicating low rainfall probability values for
   most districts.
   Day time temperatures: Above average; Night time temperatures:
   Average to above average
   The Australian and international long-term dynamic climate
   models that focus on forecasting central Pacific sea surface
   temperatures are continuing to predict further development and
   ‘coupling’ of an El Niño system within the next few months
   (January to March 2019). Over the past 3 to 6 months this El Niño
   development pattern has only been apparent in sea-surface
   temperatures while the atmosphere has remained fairly neutral.
   This is expected to change to a more coupled pattern during the
   southern hemisphere autumn.
   Importantly, long term sea-surface temperature forecasts are
   currently indicating an El Niño pattern to persist through 2019.
   This aspect will be continually updated.

   Consequently, most rainfall forecasts for northern Australia,
   especially north east Australia, currently indicate varying
   probability values of exceeding the respective long-term median
   rainfall. As the SOI is back on the rise again the SOI phase-based
   forecast is indicating close to average rainfall for the three month
   period, relative to this time of the year.

   The average Southern Oscillation Index (SOI) value for the month
   of December was close to plus 8.5 (+8.5).

   Both minimum and maximum temperatures are expected to be
   above average for the months of January to March 2019
   Due to the further development of El Niño-like conditions, there is
   a higher than average chance of a later start to the monsoonal
   wet season than usual.
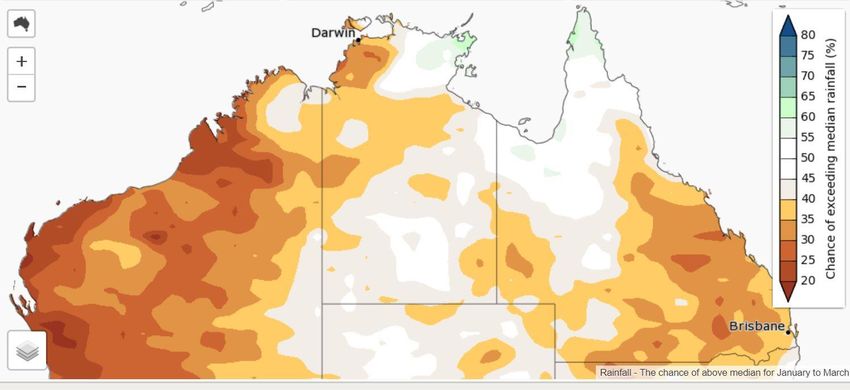
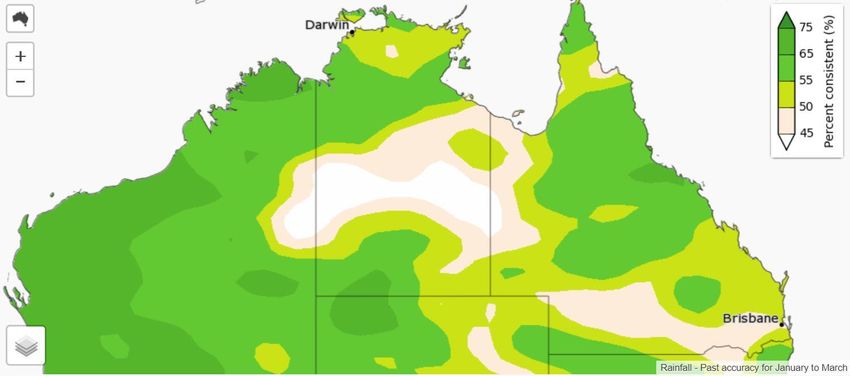
3

Australian Bureau of Meteorology forecasts:

Figure 1: Bureau of Meteorology Forecast ‘Chance of exceeding median rainfall’
probability values for northern Australia for the overall period January to March
2019. Using this forecast system, parts of northeast and northwest Australia are
indicating less than 50% chance of exceeding median rainfall.

Figure 2: Past accuracy of rainfall from January to March 2019, indicating how
accurate past rainfall forecasts have been for these months.
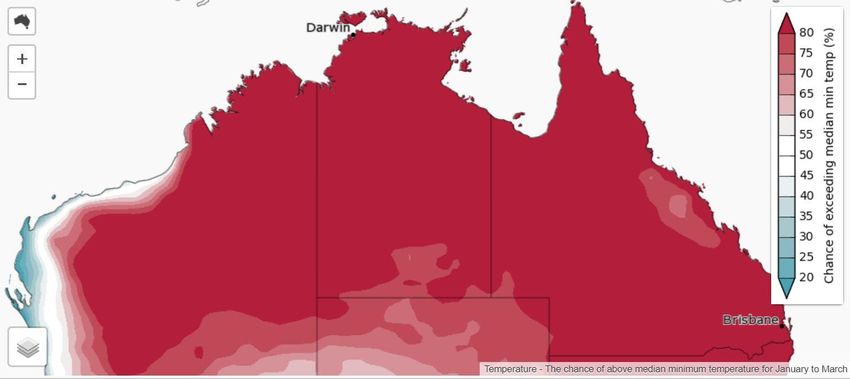
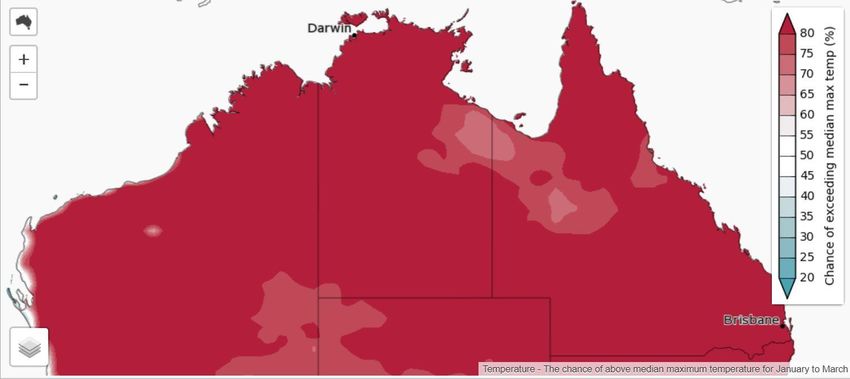
4

Figure 3: Bureau of Meteorology Forecast ‘Chance of exceeding median maximum
temperatures’ for northern Australia for the overall period January to March 2019.
The majority of northern Australia is showing at least an 80% chance of exceeding
median maximum temperatures. This indicates that day time temperatures are
likely to be above median.

Figure 4: Bureau of Meteorology Forecast ‘Chance of exceeding median minimum
temperatures’ for northern Australia for the overall period January to March 2019. The
majority of northern Australia is showing at least an 80% chance of exceeding median
maximum temperatures. This indicates that night time temperatures are likely to
be above median.
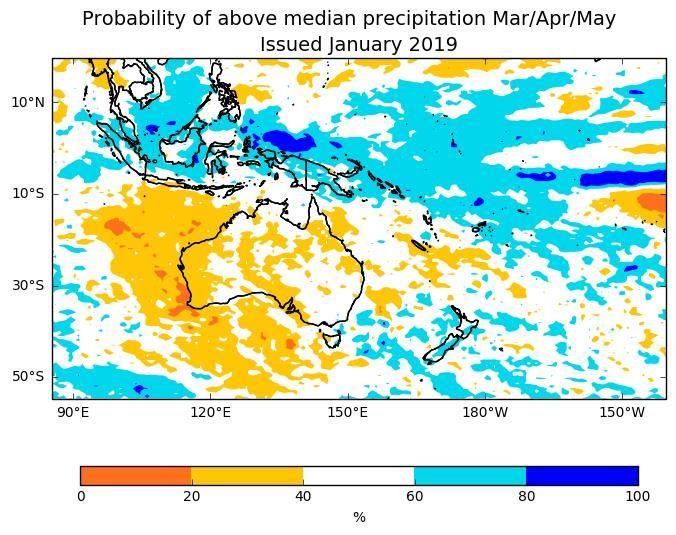
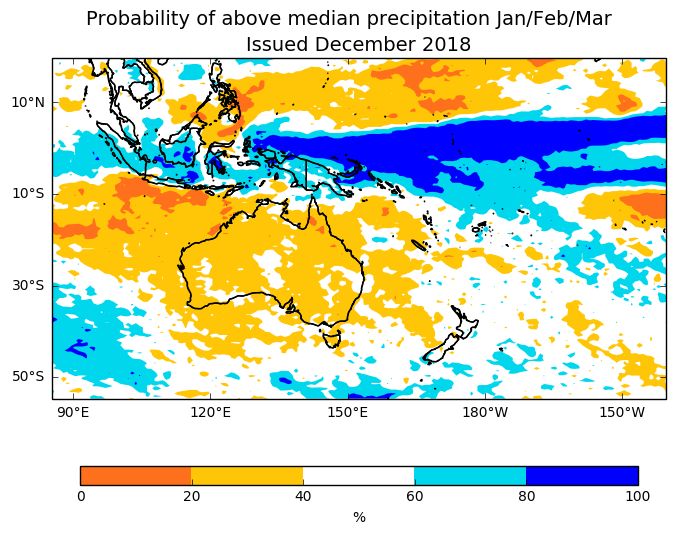
5

Longer-term forecasts:

The ECMWF and UKMO models provide useful assessments of longer-term rainfall
probability values for northern Australia (and other agricultural regions). The
ECMWF example below suggests about a 20-40% probability of above median
rainfall for January to March 2019 for much of northern Australia.

 Figure 5: UKMO forecast map: Probability of above median precipitation during the
 months of January, February and March. Using this system from the UK Met Office,
 for the majority of northern Australia, there is a 20-40% chance of receiving above
 median rainfall.
6

Figure 6: ECMWF forecast rainfall probability values for northern Australia – and
the region generally for January, February and March 2019 (Courtesy ECMWF).
Most regions show about a 20-40% probability of above median rainfall for this
seasonal period.

Figure 7: ECMWF forecast rainfall probability values for northern Australia – and
the region generally for April, May and June 2019 (Courtesy ECMWF).
Most regions show about a 20-40% probability of above median rainfall for this
seasonal period.

7

The Southern Oscillation Index:

The Southern Oscillation Index (SOI) is an index based on the difference between
surface pressure in Darwin, Australia and Tahiti, which are related to ENSO phases.
The SOI consists of five different categories that take into account both rate of
change and consistency in the SOI: Consistently Negative – when values are
consistently below negative 5, indicating an El Niño phase; Consistently Positive –
when values are consistently above positive 5, indicating a La Niña phase; Rapidly
Falling – often the transition period between a La Niña and El Niño phase; Rapidly
Rising – often the transition period between an El Niño and La Niña phase; and
Near Zero, during which time there is not, at that period, a strong ENSO signal or
phase.

Figure 8: Monthly SOI values since January 2010 – the most recent phase was ‘rapidly
rising' phase, reflecting a continuing widely oscillating SOI. The most recent 30-day
average value to 31 December, was close to plus 8.5 (+8.5).

8

Figure 9: Using the SOI phase system, the ‘probability of exceeding median
rainfall’ values for Australia for the overall period January to March 2019 based
on ‘rapidly rising’ SOI pattern during November and December. Regions shaded
blue have a 60%-70% probability of exceeding median rainfall values. Regions
shaded darker grey have a 50%-60% probability of exceeding median rainfall
values and regions shaded lighter grey have a 40% to 50% probability of
exceeding median rainfall values relative to this period.
9

Figure 10: Chances of exceeding median pasture growth for Australia for January to
March 2019 period. This output integrates antecedent moisture and forecast rainfall,
temperature, within a pasture growth model and the SOI phase forecast system.
10

Explaining the differences between models:

BOM, UKMO, and SOI rainfall ‘Probabilities of exceeding median’ differ slightly.
This is due to the BOM and UKMO using dynamical models for predicting rainfall,
while the SOI is applied as a statistical system. Dynamical models use the current
state of the oceans and atmospheres combined with our understanding of the
physical processes behind weather and climate to forecast the likelihood of future
rainfall. Each dynamical model is based on certain model calibrations, which differ
from model to model, providing slightly different outcomes. Statistical models use
historical climate data to determine when conditions were similar in the past and
what rainfall resulted from those past conditions.
While all of the models may be slightly different, it is important to focus on the
overall predicted outcomes. All three of the models presented here show that there
is an average to below average likelihood of receiving median rainfall.

El Niño-Southern Oscillation (ENSO)

ENSO events generally begin in the Southern Hemisphere winter, peak during
summer, and then usually end during autumn. The El Niño phase is often
associated with warmer and drier conditions while La Niña phases are often
associated with cooler and wetter conditions. The main areas of Australia impacted
by ENSO phases are the eastern seaboard, north-eastern Australia and south-
eastern Australia. Currently, ENSO conditions are neutral, with some models
predicting an El Niño phase beginning sometime in January or March while other
models predict neutral conditions to prevail. Impacts of and El Niño (dry and warm
conditions) can occur even if conditions do not meet thresholds for an official event
and can occur in eastern Australia while El Niño is developing.
11
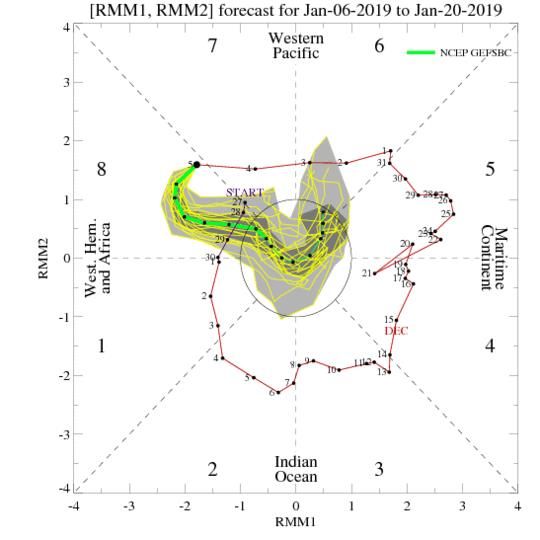
Madden Julian Oscillation (MJO)
MJO impacts weather in tropical Australia (and occasionally in higher latitude
areas) on a weekly to monthly timescale. According to BoM‘s and NOAA’s
forecasting system and USQ’s analysis, the MJO has recently crossed regions to
the north of Australia and may next be due in mid-February.
Please also refer to the interesting NOAA website (below) for updated information
on the MJO.
Figure 11: MJO phase diagram for 6 January to 20 January 2019.
The purple line shows values for November and the red line for December.
The numbers indicate the day of the month. When the line is in the circle, it
indicates a weak/inactive MJO phase and when the line is outside of the
circle, the MJO is active with strength indicated by distance from circle.
The area shaded in grey containing yellow lines indicates the ensemble
plume prediction for the 6 January to 20 January, with the green line
showing the ensemble mean.12 Monsoon/Wet Season Onset (Included seasonally) The first monsoon burst of the season occurred during the last week in December, bringing widespread rain and influencing the development of Tropical Cyclone Penny. Figure 12 shows areas that have received at least 50mm of rainfall since 1 September and Figure 13 shows how the rainfall in Figure 12 compares to other years. Figure 12: Northern Australia rainfall totals from 1 September to 1 January. Figure 13: Number of days earlier or later than the long-term average of receiving at least 50mm after 1 September. Grey areas have not yet received 50mm.
13
For further information, click on the following links:
For the MJO
For weekly SSTs
For easterly (and westerly) wind anomalies across the Pacific
For sub-surface temperatures across the Pacific
For ECMWF forecast products (note the web site for this output has
changed)
For ‘plume’ forecasts of SSTs in the central Pacific
For a complete history of the SOI
The Long Paddock
Additional information on ENSO
USQ Research
Centre for Applied Climate Sciences
Please email Prof Roger Stone at
Roger.stone@usq.edu.au
This work is currently funded by Meat and Livestock Australia Donor
Company, the Queensland State Government through the Drought and
Climate Adaptation Program and the University of Southern QueenslandSeasonal climate outlook
Supplement for Central
Queensland
January 2019
Peter Crawford
NACP Extension Officer
Central Queensland
Peter.Crawford@usq.edu.au
Phone 0427 024 921
1Forecast summary January to March 2019
The BoM, The UK Met Office and the European Centre for Medium Range Weather Forecasts (ECMWF)
are all forecasting a drier than average three months from January to March 2019 for eastern mainland
Australia
Warmer than average days and nights are likely for almost all of Australia for the first three months of
2019. This forecast is relevant to all of central Queensland
Tropical Pacific waters are at El Niño levels. However, the atmospheric component of the El Niño–
Southern Oscillation has not yet responded, meaning an El Niño event is yet to become established
Outlooks suggest tropical Pacific waters are likely to remain at El Niño levels through the coming
months.
Pasture growth throughout central Queensland is forecast to be below median, except in areas that
have received useful rainfall from Tropical Cyclones Owen and Penny
Longer range forecast
The UK Met office is forecasting a low probability of above median rainfall for much of Australia (including almost
all the CQ region) during the period from March to May 2019. The probability is 20 – 40%.
This forecast corresponds with the medium-term forecast for sea surface temperatures (SSTs). Five of the eight
surveyed climate models predict SSTs will remain above El Niño thresholds through the southern hemisphere
summer of 2018–19.
The graph on the following page indicates predicted SSTs from February through to June. It shows the variation
between the models, with the green line showing an average of the predictions. This forecast was issued by BoM
on the 8th of January.
1Most models indicate SSTs will drop as autumn progresses, although three models see SSTs increase over the
season. By May three models predict El Niño thresholds will be exceeded, while another two are below but close
to threshold values.
Recent rainfall
TC Owen was forecast to bring
widespread rainfall along most of
the Queensland coast during the
second week of December.
Unfortunately this did not
eventuate, with Owen not travelling
any further south than Mackay.
Record rainfall was recorded at
several locations on the north
tropical coast, as a result of Owen.
TC Penny developed as a result of
the monsoon activity during the last
week of December, and following a
couple of weeks of moving around
in the gulf and off the east Qld
coast, Penny delivered some useful
rain in parts of the Fitzroy
catchment and the north coast.
Once again, the coast and inland
areas south of Rockhampton
missed out, as did areas west of the
Fitzroy basin.
In summary, December and early January has seen some good rainfall in coastal areas north of Rockhampton,
with record rainfall in some areas of the north tropical coast. Areas of the Fitzroy basin have also received useful
rainfall from TC Penny. However, drought conditions remain for much of the remainder of Queensland.
2Rainfall outlook for Central Queensland from January to March (issued by
BoM 20th December)
Probability of receiving above median rainfall
Whilst some areas received useful rainfall from Tropical Cyclones Owen and Penny, much of CQ has not had any
significant rainfall so far this wet season. This situation is likely to continue, with a large area of CQ having less
than a 50% chance of receiving above median rainfall from January to March. Many areas of CQ only have a 25 –
35% chance of receiving above median rainfall, meaning significant relief in drought affected areas is unlikely.
This also means that there is a higher than average chance of receiving less than median rainfall for this period.
Important note: there may
be a probability of receiving
median rainfall, but if the
total is received through a
large number of low rainfall
events, pasture growth
could be much lower than
normal.
How much rain is normally received in central Queensland from January to March?
The average and median rainfall totals from January to March for a number of CQ locations is included in the
following table.
Average and median rainfall totals for the period January to March (mm)
Recording station Average Median Recording station Average Median
Banana 261 218 Gin Gin 465 351
Biloela Research Stn. 268 222 Gladstone 462 319
Biggenden 350 286 Gracemere 401 271
Blackwater 237 173 Marlborough 428 319
Bundaberg 495 375 Maryborough 488 394
Calliope 432 310 Miriam Vale 554 402
Capella 256 205 Monto 298 252
Carmila 795 579 Mundubbera 262 211
Childers 455 345 Nebo 391 304
Clermont 306 234 Peak Downs 272 207
Dululu 284 220 Rolleston 249 192
Eidsvold 281 223 Rosedale 507 348
Emerald Airport 265 213 Springsure 293 229
Gayndah 292 292 Taroom 250 205
3Probability of receiving at least 200 mm from January to March
The chance of receiving at least 200 mm from January to March is variable throughout the entire CQ region. The
probability ranges from 15 – 55% in inland areas, to 75 – 85% along the coast (expected at this time of the year).
What has been the accuracy of rainfall forecasts during this period in in the past?
The accuracy of forecasts at this time in the past has been average to slightly above average (50 – 65% accuracy)
for the CQ region.
4Temperature outlook
The last two weeks of November 2018 saw record maximum temperatures across most of Queensland. This was
especially serious in eastern central Queensland with several large and catastrophic bushfires requiring a massive
control effort. Fortunately some widespread (but patchy) rain brought some relief during the first week of
December, and further storms and patchy rainfall assisted with extinguishment of all major fires.
Record maximum temperatures are likely to be recorded in some locations over the next few months. Virtually all
areas of Australia will endure higher than average maximum temperatures from January to March. The CQ region
is no exception, with most areas having an 80% or higher probability of exceeding the long-term median.
Minimum temperatures will also be higher than average, with a similar probability of exceeding the long-term
median minimum temperature.
Higher temperatures will lead to increased evaporation, which can exacerbate dry conditions. High daytime
temperatures can also lead to reduced pasture growth in areas of marginal moisture, as soil moisture loss will
increased with higher temperatures.
What does this seasonal forecast mean for producers?
Medium to longer term forecasts are just that: forecasts. In any given summer in CQ there is always the chance of
an upper low-pressure trough bringing some rainfall events and thunderstorms that can result in higher than
forecast rainfall in some locations. Cyclones could also be a contributing factor in some locations. However, it may
be wise to consider probability, rather than possibility.
Due to the scattered and variable rainfall received from events such as TC Penny and storms, graziers in central
Queensland will need to evaluate their expectations of pasture growth and stocking density, starting now. As day
length reduces, pasture growth expectations will be reduced on a weekly basis from now on.
Maximum pasture growth can be expected if average wet season rainfall is spread from December to the end of
March. The later that this rainfall occurs, the less grass will be grown. Therefore, graziers will need to assess their
stocking density on an on-going basis, based on the rainfall received during this period.
Most producers have a pretty good idea of the amount of grass they can grow in an average season. Given the
seasonal outlook, it may be wise to assume a significant reduction in expected pasture growth in areas that have
not received good rainfall during the spring and early summer.
5Seasonal pasture growth map
LongPaddock provides a monthly seasonal pasture growth outlook map, for the whole of Australia and state by
state. The Queensland pasture growth outlook map for January to March is shown below.
Although this map is showing a very low probability
of above median growth in much of CQ for the
January to March period, recent rainfall from TC
Penny would not have been taken into
consideration at the time of the release of this map.
Therefore, the pasture growth expectation in some
locations in the Isaac, Central Highlands and Banana
LG regions may now be reasonable to good.
Pasture growth in LG regions south of the Fitzroy
basin were not impacted by TC Penny (or TC Owen),
so the low to medium forecast growth for these
regions will be a concern, unless good rainfall is
received by mid-February.
Average pasture growth in central Queensland
This map shows average pasture
growth across eight local government
regions in Central Queensland.
If your property is in a medium
pasture growth area (1,500 – 3,500
kgs/ha), you might consider that your
pasture growth this season may only
be 1,000 – 2,000 kgs/ha. This may
reduce your carrying capacity over
the next dry season by a significant
percentage.
In a situation such as this it may be
wise to reduce stock numbers now,
rather than wait until the autumn.
This would also allow wet season
spelling of some paddocks, which
would be a very good management
decision, as it is likely that some
grazing country has been pushed a
little harder than normal due to the
very dry year.
6LongPaddock property forage reports
Forage Property Reports are available from the LongPaddock website. A Forage report will indicate rainfall and
pasture growth outlook based on a number of data sources, including climate indicators, satellite imagery and
pasture growth models, and is available on a lot/plan scale.
Go the LongPaddock website by clicking on http://www.longpaddock.qld.gov.au then click on the Forage report
tab. Enter your lot/plan and download the PDF file.
Future updates and more information
Our next update will be early February. For more information, the following websites could be very useful. Click
on the links to take you there
Bureau of Meteorology
Climate drivers: a useful site that explains the influences on the Australian climate:
http://www.bom.gov.au/climate/about
Seasonal outlooks: updated on a monthly basis http://www.bom.gov.au/climate
Weekly forecast: MetEye http://www.bom.gov.au/australia/meteye. Put in your location or postcode for a 7-
day forecast for your location. The text view is probably the best way to use this service. Depending on your
location, this forecast can be reasonably accurate.
Australian CliMate
A free online program where landholders can get a whole lot of information about their local area, including
how’s the season, the drought situation, El Nino, rainfall and temperature trends, and much more.
https://climateapp.net.au
UK Met Office
For medium to longer term forecasts:
https://www.metoffice.gov.uk/research/climate/seasonal-to-decadal/gpc-outlooks/glob-seas-prob
ECMWF
Medium term forecasts:
https://www.ecmwf.int/en/forecasts/charts/catalogue/seasonal_system5_public_standard_rain?facets=Rang
e,Long%20(Months)&time=2019010100,2208,2019040300&stats=tsum
WX Maps
Useful US site for an alternative 6-day forecast and short-term outlook:
http://wxmaps.org/fcst.php
Further information
For more information or assistance, contact Peter Crawford on 0427 024 921, or e-mail at
peter.crawford@usq.edu.au.
7You can also read