Climate and Water Resources Summary for the Wellington Region - Warm Season (November to April) 2019-2020 Release date: 10 June 2020 - Greater ...
←
→
Page content transcription
If your browser does not render page correctly, please read the page content below
Climate and Water Resources Summary for the
             Wellington Region
   Warm Season (November to April) 2019-2020
          Release date: 10 June 2020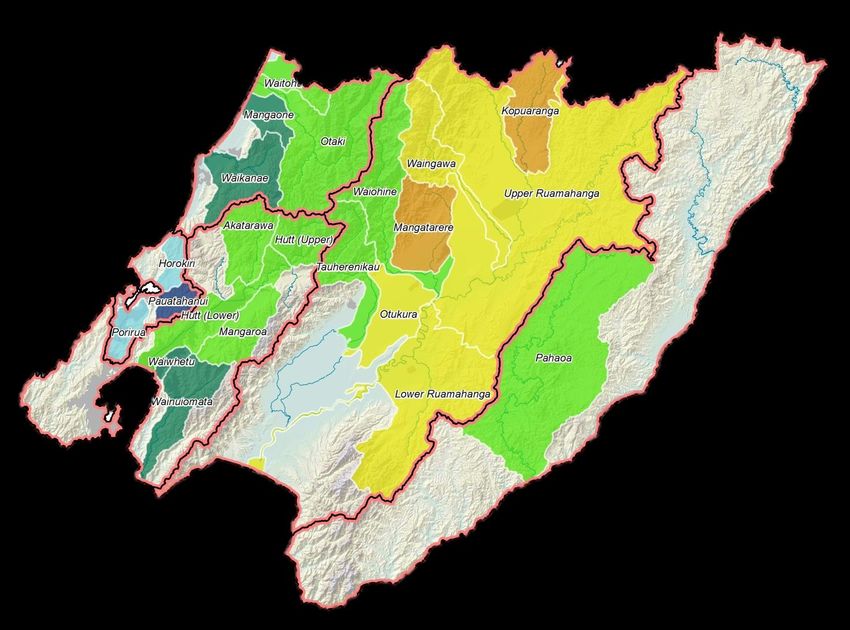
Contents

True colour satellite image showing a very rare occurrence with virtually the entire length of New
Zealand simultaneously cloud free, on 10th February 2020. It is very rare to see an image like this and
there is no verified record of when a similar condition was last observed. Most of the country
experienced very dry conditions during the warm season, with record low rainfall in Auckland,
Northland and also in the Wairarapa. Image Credits: MetService.
Regional overview

In this report you will find:
                                              Regional overview
                                              Global climate drivers
                                              Outlook update
                                              Whaitua summaries
                                              Summary tables and graphs

More information
For more information on monitoring sites and up-to-date data please visit http://www.gw.govt.nz/environmental-science/.
Several climate sites are operated by NIWA and/or MetService, and GWRC is grateful for permission to present the data in
this report.

Disclaimer
This report has been prepared by Environmental Science staff of Greater Wellington Regional Council (GWRC) and as such does not constitute Council policy.

In preparing this report, the authors have used the best currently available data and have exercised all reasonable skill and care in presenting and interpreting
these data. Nevertheless, GWRC does not accept any liability, whether direct, indirect, or consequential, arising out of the provision of the data and associated
information within this report. Furthermore, as GWRC endeavours to continuously improve data quality, amendments to data included in, or used in the
preparation of, this report may occur without notice at any time. GWRC requests that if excerpts or inferences are drawn from this report for further use, due
care should be taken to ensure the appropriate context is preserved and is accurately reflected and referenced in subsequent written or verbal communications.

Any use of the data and information enclosed in this report, for example, by inclusion in a subsequent report or media release, should be accompanied by an
acknowledgement of the source.

Report release date: June 2020

1480495-V1                                                                                                                                         PAGE 1 OF 25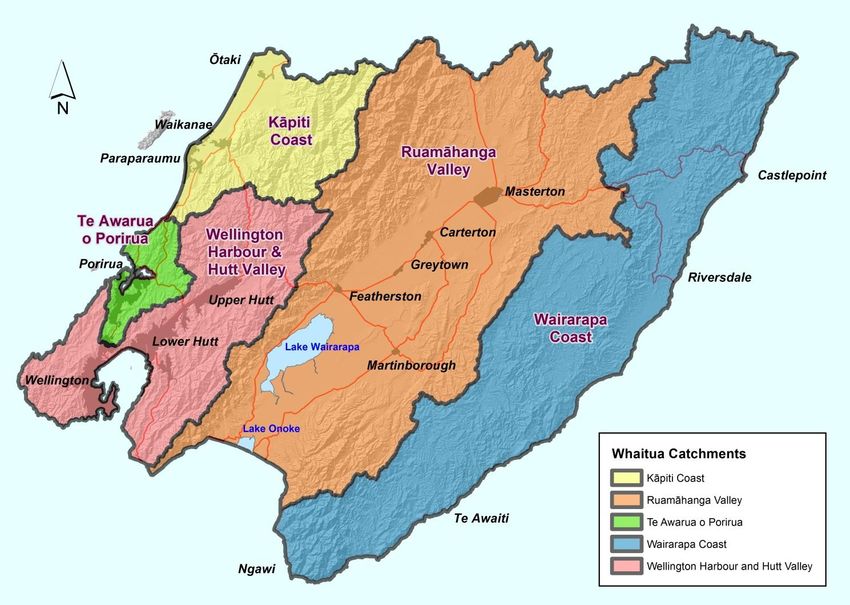
Regional overview                                                           Cold Season 2019

The cold season from November 2019 to April 2020 saw total rain across the region range from
around 70 to 100% of average over the entire six month period. However, a look into the rainfall
patterns on a monthly basis (see next page) shows that the rainfall anomaly had large variations from
month to month.

Rainfall (November to April)
The map below shows rainfall recorded during the entire November 2019 to April 2020 period as a
percentage of the long term average.

The pattern for the six month period is that of below average to average rainfall across the region.
Places that received average rainfall totals were around the Wellington, Hutt Valley and Porirua
areas. Overall drier conditions persisted over the entire Wairarapa area and the Kapiti Coast.

Separate monthly totals show a varied
picture (see the following page for
monthly rainfall percentage maps).
January, February and April were
very dry months with well below
average rainfall totals received
over much of the region but
particularly so in the
Wairarapa.

Analysis of the
number of days
that it rained can
be informative. If
more than 1mm
of rain is recorded
in a day this is called
a ‘Rain Day’ and if there
is more than 25mm this is                                                     November 2019 to April 2020
                                                                              total recorded rainfall as a percentage
termed a ‘Heavy Rain Day’.
                                                                              of the long-term average rainfall

The table below shows that the Kapiti
Coast, Porirua, Hutt Valley and Wellington
areas had slightly fewer rain days than normal. However, the Ruāmahanga and Eastern Wairarapa
had fewer rain days again, with 10 to 15 days fewer than normal.

Number of Rain Days and Heavy Rain Days during November to April across the region (long-term average in brackets.)

                                   Kāpiti Coast       Porirua       Hutt Valley &          Ruamāhanga               Eastern
                                                                     Wellington                                    Wairarapa

                               Lowland      Hills     Lowland    Lowland     Hills      Lowland         Hills

 Rain Days (>1mm)              48 [52]     74 [77]     44 [44]    41 [46]   62 [67]      34 [42]      67 [82]           39 [50]
 Heavy Rain Days(>25mm)          3 [4]     18 [21]      5 [4]      6 [4]     8 [10]       2 [3]       17 [24]            4 [4]

                                                                                                                        PAGE 1 OF 23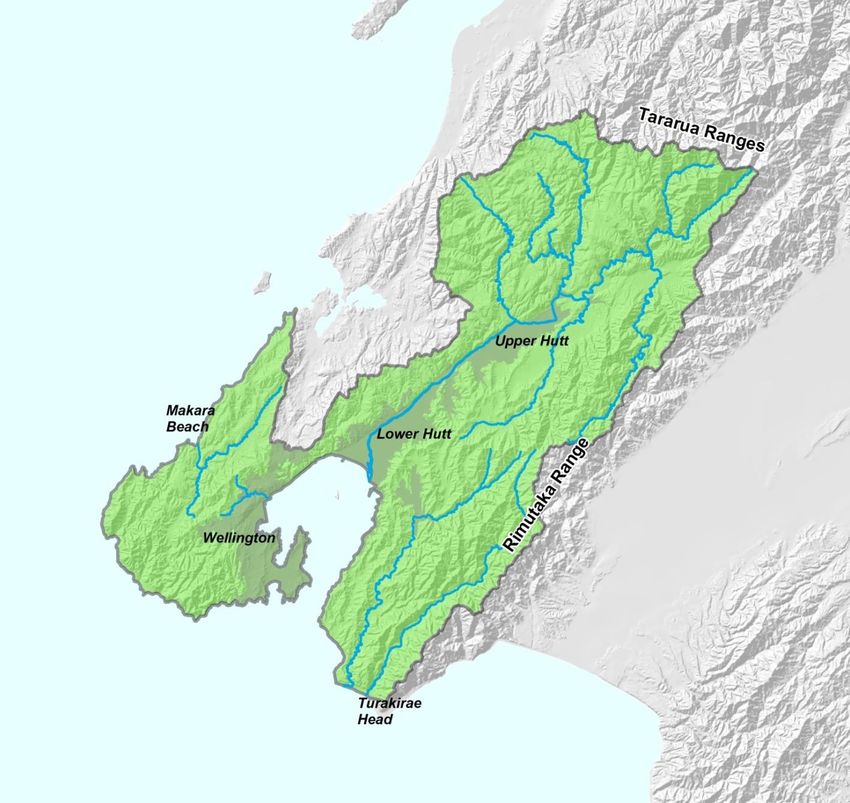
Regional overview                                                 Cold Season 2019

Rainfall by the month
November, January, February and April rainfall totals were well below average over eastern areas.
The significance of just a couple of heavy rainfall events is evident in the December and March
anomaly maps. Torrential rainfall on 8th December affected parts of the Hutt Valley and Porirua with
flooding, while solid rainfall from 27th to 29th March brought significantly large totals to eastern and
southern Wairarapa areas.

 November

                                                                                  December

    January

                                                                                  February

      March

                                                                                  April

                                                                                              PAGE 2 OF 23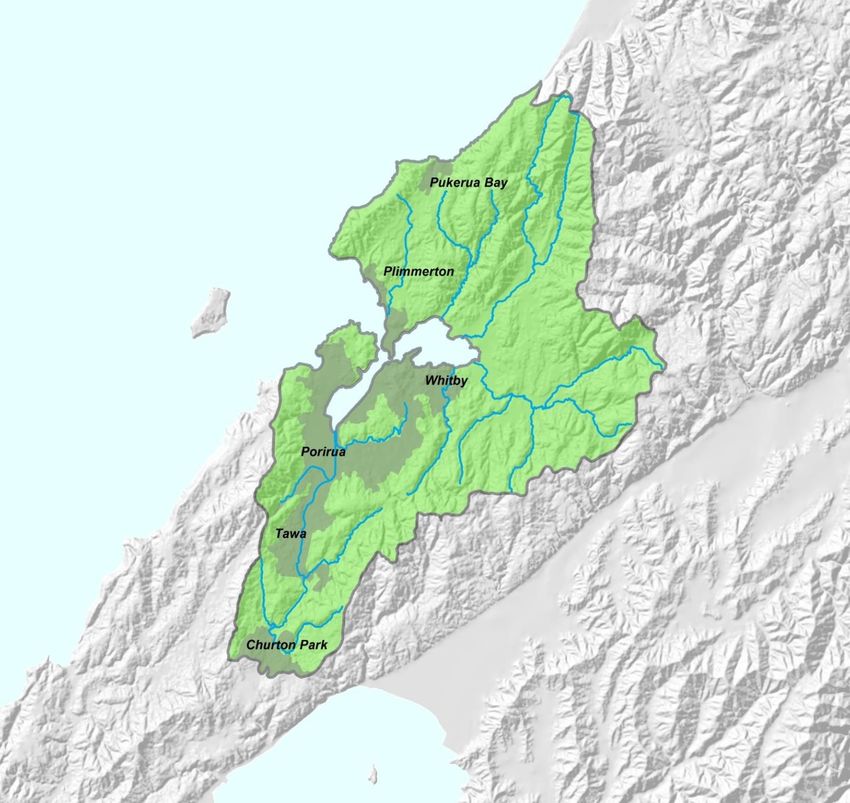
Regional overview                                              Cold Season 2019

River flow
The map below shows the average river and stream flow conditions over the November 2019 to April
2020 period, for various monitored catchments, as a percentage of the long-term average flow for the
same period.
The majority of the region’s stream and rivers experienced below average flows during the six month
period with the exception of streams in the Porirua area which were relatively higher.

                                                                                           PAGE 3 OF 23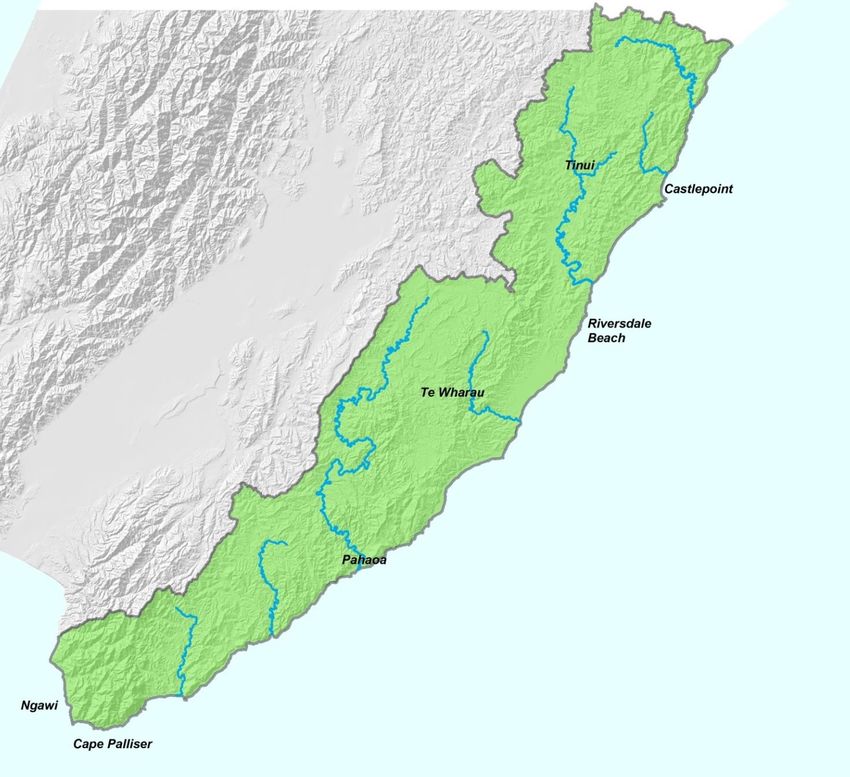
Regional overview                                                         Cold Season 2019

Air temperatures
Air temperature is measured at a number of meteorological monitoring sites across the region. It is
useful to look at the anomalies (i.e., departures from normal) in average temperatures month by
month, in order to understand the climate variability.

The graphs below show the monthly average daytime maximum and average nighttime minimum
temperature anomalies (i.e., based on every day of the month) for Kelburn (upper panel) and
Masterton (lower panel). We can see that the warm season was mostly warmer than normal,
especially in Masterton where the daytime maximum temperature for November was the hottest on
record for over 100 years of data (February was the third hottest on record). January and March were
relatively cold in Wellington.

    Average daytime and nighttime temperature anomalies for Kelburn (top) and Masterton (bottom) for the warm
    season period. The first half of the period was warmer than average, and the second half was either about
    average (Wellington) or colder than average (Masterton).
    SOURCE: Data from MetService meteorological stations.

                                                                                                           PAGE 4 OF 23
Regional overview Cold Season 2019
Global climate drivers
Climate variability and climate change
People often ask if the variable weather patterns in our region are a result of climate change. While
natural climate variability has always been quite pronounced in our region, weather extremes are
expected to get worse as a result of human-induced climate change and global warming caused by
greenhouse gas emissions (https://www.gw.govt.nz/climate-change/ ).
Some key observations about climate variability and change in our region during the period
November 2019 to April 2020 are:
The six-month period was warmer than normal, especially in the Wairarapa.
Masterton broke an all-time record for warm daytime temperatures in November, and
was close to breaking it again in February, for over 100 years of data;
The sea surface temperatures (following page) have been mostly warmer than normal
around and east of New Zealand;
The Southern Annular Mode (below) has been predominantly negative during spring
and positive in late summer, when the drought aggravated (graph below);
Low Pressures southwest of New Zealand and high pressure east of the country
helped develop northerly flows, with a strong westerly component persisting as a
result of the pressure gradient. A ridge of high pressure projecting towards the North
Island helped explain the unusually dry conditions that progressed into summer and
autumn.
The Southern annular mode (SAM) has been predominantly positive (red), but it had some marked negative (blue)
peaks until the end of 2019.
Source: https://niwa.co.nz/climate/information-and-resources/southern-annular-mode
PAGE 5 OF 23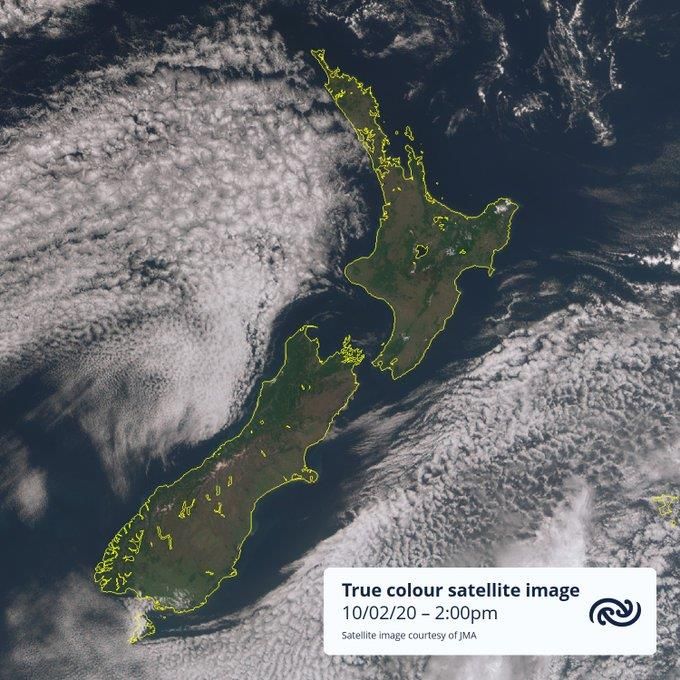
Whaitua summaries                                                                  Cold Season 2019

Global climate drivers and extreme weather events

Climate drivers are global mechanisms that can influence the weather in our region. The El
Niño/Southern Oscillation1 (ENSO) phenomenon has been neutral, and is expected to slowly tend
towards La Niña over the next few months. The sea surface temperature around New Zealand has
been mixed, influenced by a warm water pool to the east and north-east, as well as by cold eddies
propagating from the Indian Ocean and south of Australia. The sea ice extent around Antarctica has
recovered slightly in comparison to what was observed in 2019, but remains below average as of 17
May (full extension seen in white, bottom panel).

         Sea surface temperature anomalies on 1st Jan 2020 (left), 31th Mar 2020 (right) and 17th May 2020 (bottom). We
         can see the equatorial Pacific in a neutral phase in regards to ENSO, with a slight central cooling developing in
         May. Warmer than normal waters were seen east of New Zealand, especially at the beginning of the year. Source:
         NOAA/USA.

1   https://www.niwa.co.nz/education-+-and-training/schools/students/enln

                                                                                                                     PAGE 6 OF 23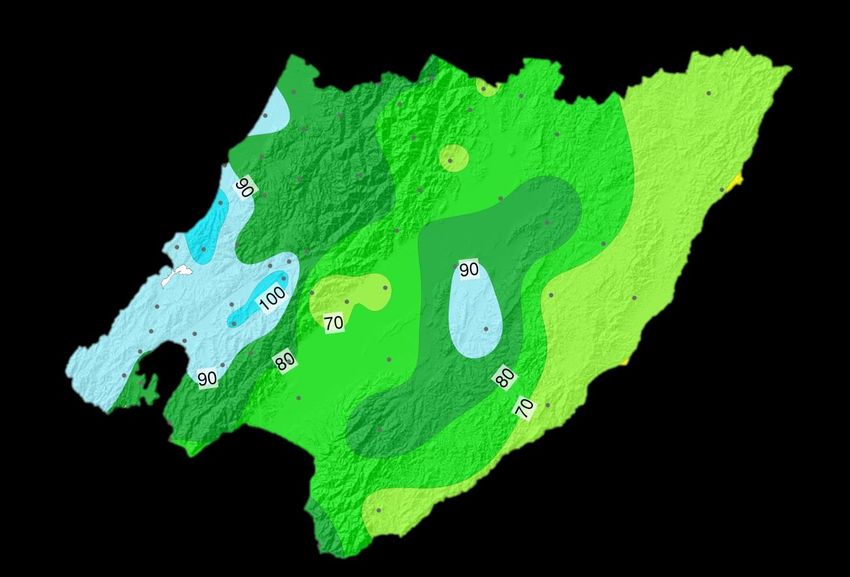
Whaitua summaries                                                         Cold Season 2019

The pressure anomalies over the six month period show two anticyclones (marked as H) and New
Zealand in between, dominated by low pressure to the southwest of the country. This pattern
contributed to a more frequent north-westerly flow, with variable temperatures on the west coast and
warmer temperatures in the Wairarapa. The ridge of high pressure northwest of New Zealand had a
marked influence on the North Island, contributing to the severe drought in Northland.

   Mean sea level pressure anomaly for Nov to Apr 2019-2020. High pressure anomalies dominated the oceanic
   areas south-east and north-west of New Zealand, with low pressure anomalies to the south-west. This pattern
   helped to enhance the westerly flow, creating conditions favouring drought for the north of the North Island.

   Source: NOAA (USA).

Another climate driver of interest has been the Indian Ocean Dipole, which has fallen back to normal
levels before Christmas, and is now expected to be slightly on the negative side during the winter
months. A potentially negative IOD over the coming months may imply a normal or above normal
winter rainfall pattern on the west coast, even though the statistical significance is very low.

                                                                                                          PAGE 7 OF 23
Whaitua summaries Cold Season 2019
Seasonal climate outlook update
The ENSO phenomenon is expected to remain borderline between neutral and La Niña until spring,
while the IOD is expected to be borderline between normal and negative. The waters around New
Zealand have been warmer than normal towards the east and northeast of the country. These
modes combined tend to suggest higher chances of normal to above normal rainfall on the west
coast during winter, with drier conditions over the Wairarapa.
The following points summarise the expected pattern over the next three months:
ENSO phenomenon likely remaining neutral or borderline La Niña during the winter season;
Mixed rainfall anomalies, likely wetter on the west coast and drier in the Wairarapa, with
high chance of extreme rainfall events (low confidence for rainfall totals);
Warmer than average Sea Surface Temperature likely east of New Zealand;
Warmer than average daytime temperatures to persist, especially in the Wairarapa;
Predominant winds from the northerly quadrant, with occasional strong southerly events
and frosts, but unlikely to be too prolonged;
Westerly flow regime likely to continue for the west coast, but in between long anticyclonic
periods dominating the region.
The full climate outlook for winter and early spring will be released with our next seasonal briefing for
autumn, to be released by the end of June.
ENSO predictions as of 9 May 2020, showing that the ENSO phenomenon has been neutral, and is
expected to tend towards La Niña over the next few months. Source: BOM (Australia)
PAGE 8 OF 23Whaitua summaries Cold Season 2019
What happened in each whaitua catchment?
Climate and water resource summaries are provided in the following sections for each of the five
Wellington region whaitua catchment areas (as shown below). The whaitua catchments provide an
important sub-regional basis for environmental management in the Wellington region2, and roughly
coincide with the different climate and water resource zones.
Click the following links for:
Wellington Harbour and Hutt Valley
Te Awarua-o-Porirua
Kāpiti Coast
Ruamāhanga Valley
Wairarapa Coast
Map of the five whaitua catchment areas in the Wellington region. Each whaitua roughly coincides with a
climatic zone, expressing the marked east-to-west contrast that we experience in our region.
2 http://www.gw.govt.nz/whaitua-committees/
PAGE 9 OF 23Whaitua summaries Cold Season 2019
Wellington Harbour and Hutt Valley climate summary
Total rainfall was near average, but extremely variable on a month to month basis
Drought affecting the region during late summer followed by a deluge in late March
Temperatures have been average to above
Vigorous westerly flow, making it feel cool
Torrential rainfall Hot February
On 8th December a band of intense rain band brought a Upper Hutt had the third highest average
deluge to the Hutt valley. temperature, since 1939
42mm of rain was recorded in just one hour at
Haywards Hill
6 hour rainfall totals of 90mm and 79mm respectively
at Haywards Hill and Pinehaven Reservoir
Low aquifer
The Waiwhetu Aquifer reached low levels
during February and March but was
closely monitored and managed
High swells Dry rivers in January
5.5 metre swells on 15 and February
April on the southern Recorded flow in the Hutt
coast River over the two months
was just 34% of average
and the third lowest since
1978.
Over the same period the
Wainuiomata River had
the second lowest flow
Hot November since 1983 (and the
Wellington Airport had the second lowest since 2000/01)
highest average temperature for
November since 1962.
Kelburn had the highest average minimum (nighttime) temperature on record (since
1927), and the second highest on record maximum (daytime) average
Want to look at the summary tables and graphs?
Rainfall
River flows
PAGE 10 OF 23Whaitua summaries Cold Season 2019
Te Awarua-o-Porirua climate summary
Total rainfall was near average, but extremely variable on a month to month basis
Drought affecting the region during late summer followed by a deluge in late March
Temperatures have been average to above
Vigorous westerly flow, making it feel cool
Torrential rainfall
On 8th December a band of intense rain band brought a
very heavy downpour to the Porirua area:
1 hour 2 hour
Battle Hill 37mm 54mm
Whitby 30mm 51mm
Whitireia Park 38mm 49mm
Whenua Tapu 42mm 64mm
42mm of rain was recorded in just one hour at
Haywards Hill
6 hour rainfall totals of 90mm and 79mm respectively
at Haywards Hill and Pinehaven Reservoir
Stream flows up and down
A wet December saw recorded stream
flow well above average across Porirua:
Porirua Stream 183%
Pauatahanui Stream 290%
Horokiri Stream 250%
Quite dry conditions during January, February
and April lead to low stream flows:
Feb Apr
Porirua Stream 61% 42%
Pauatahanui Stream 50% 54%
Horokiri Stream 32% 47%
Want to look at the summary tables and graphs?
Rainfall
River flows
PAGE 11 OF 23Whaitua summaries Cold Season 2019
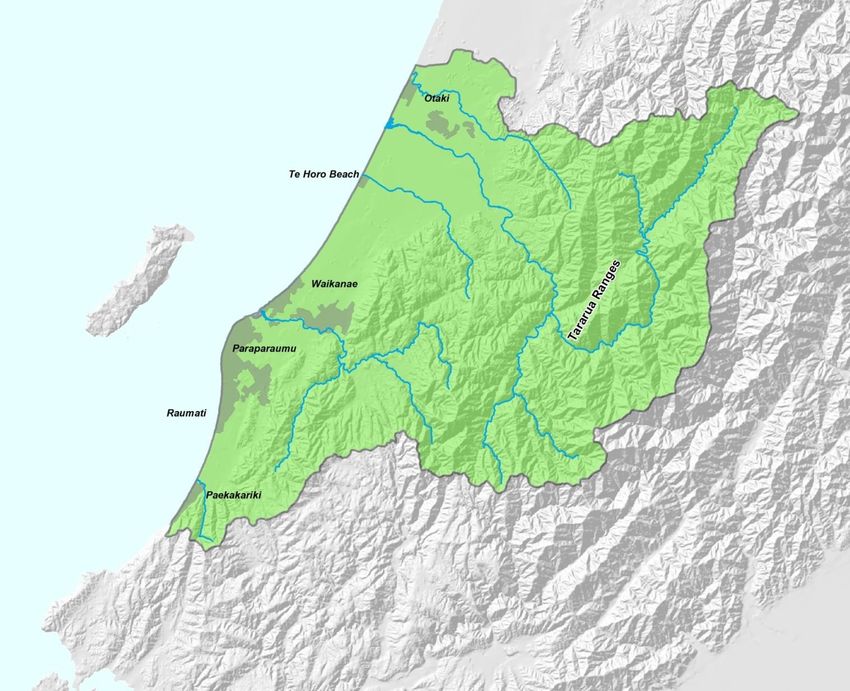
Kāpiti Coast climate summary
Total rainfall was near average, but extremely variable on a month to month basis
Drought affecting the region during late summer followed by a deluge in late March
Temperatures have been average to above
Vigorous westerly flow, making it feel cool
Daytime cold in March
13.8°C on the 28th was the equal third lowest daily
maximum temperature for March since 1972 in
Paraparaumu.
Nighttime cold and warm:
-0.6°C on the 4th of October c
3.5°C on the 15th of January
17.0°C on the 10th of
November
These were all either the 4th
or 3rd lowest and highest on
record minima for
Paraparaumu since 1972
Rivers and stream below average The mean recorded
Over the six month period recorded river and stream flows flow in the Waikanae
were around 75 to 85% of long term averages. River over January and
January and February had particularly lower flows: February was the third
Jan Feb lowest for this period
Waikanae River 42% 36% since records started in
Otaki River 44% 53% 1978, and is the lowest
Waitohu Stream 40% 38% since 1988/89
Want to look at the summary tables and graphs?
Rainfall
River flows
PAGE 12 OF 23Whaitua summaries Cold Season 2019
Ruamāhanga Valley climate summary
Below average rainfall
Drought affecting the region followed by a deluge in late March
Temperatures have been well above average
Vigorous westerly flow enhancing the dryness
Hot and dry
Masterton had the hottest
mean daytime maximum
temperature in November and
the third highest in February
for over 100 years of record
(since 1906)
22.4°C on the 4th of February
was Masterton’s highest
minimum nighttime
temperature since 1943
34.9°C on 28th January was Dry and wet
the third hottest temperature 4mm in April was the lowest
ever measured in Masterton on record since 1926, and
since 1906 – that’s hot!! 96mm on 28th March was the
2nd highest 24-hour rainfall
accumulation for Masterton
Drought was declared by MPI
on 12 March, just 16 days
before the deluge
Extended heavy rain 27-29 March
Low river flow Heavy rainfall brought big totals across the
River and stream flow across the entire Valley were Ruamahanga Valley. High 1-day rainfall totals include:
below average the entire six month period. Masterton 94mm
The Ruamahanga River recorded only 25% of the Longbush 128mm
long-term average flow during January and February – Ruakokopatuna 157mm
and this was the lowest since records started in 1977
Want to look at the summary tables and graphs?
Rainfall
River flows
PAGE 13 OF 23Whaitua summaries Cold Season 2019
Wairarapa Coast climate summary
Below average rainfall
Drought affecting the region followed by a deluge in late March
Temperatures have been well above average
Vigorous westerly flow enhancing the dryness
Hot November and February
Ngawi had the hottest on record mean temperature
for November, and the third hottest in February
(since 1972)
Castlepoint registered the third hottest November
on record
Cold daytime during deluge
Ngawi had a maximum temperature of only 12.5C
on 28 March, the second lowest on record since
1972. This coincided with the cold upper level
vortex that brought the deluge to the Wairarapa,
finally breaking the drought spell
River and stream flow below
average most of the time
Recorded flow in the Pahaoa
River shows very low flows
during December, January,
February and April.
The only exception was March
when flows were twice the
average largely in response to
the heavy rain over 27-29th
Extended heavy rain 27-29 March
Heavy rainfall brought big totals across the whole of the Wairarapa
Coast area. Notable totals:
1-day 2-day
Te Wharau 190mm 247mm
Hinakura 138mm 182mm
Stoney Creek 195mm 248mm
Want to look at the summary tables and graphs?
Rainfall
Soil moisture
PAGE 14 OF 23Summary tables and graphs Cold Season 2019
Rainfall statistics
Rainfall was variable over individual six months in the November to April, but ended near average for the Wellington, Hutt
Valley, Porirua and Kapiti areas and below average in the Ruāmahanga and Wairarapa Coast areas.
Nov Dec Jan Feb Mar Apr Nov-Apr
Whaitua Location
% % % % % % (mm) %
Wellington Kaitoke 88 153 19 72 121 54 964 88
Harbour & Hutt Lower Hutt 110 152 29 42 202 36 489 94
Valley
Wainuiomata 77 120 21 52 245 25 735 91
Click to see
cumulative rainfall Karori 113 172 39 67 157 21 518 95
plots
Wellington 133 220 43 49 163 11 469 90
Te Awarua-o- Battle Hill 128 211 52 74 115 43 553 104
Porirua
Click to see Whenua Tapu 96 248 33 39 122 44 445 99
cumulative rainfall
plots Tawa 104 187 32 68 152 33 411 100
Otaki 102 117 64 63 142 58 457 90
Kāpiti Coast Waikanae 85 103 57 39 134 40 553 77
Click to see
cumulative rainfall Paekakariki 144 189 68 85 149 42 429 115
plots Tararua (Otaki
81 84 53 84 142 75 2294 86
headwaters)
Masterton 72 97 24 17 240 13 374 80
Ruamāhanga Featherston 57 118 19 67 163 30 426 78
Click to see
cumulative rainfall Longbush 78 80 30 48 355 8 373 98
plots Tararua (Waiohine
96 83 38 65 97 76 1919 78
headwaters)
Wairarapa Coast Tanawa Hut 35 91 52 15 161 20 503 66
Click to see
cumulative rainfall
Ngaumu 56 65 32 14 239 9 300 72
plots
Click the following links to return to climate summaries for:
Wellington Harbour & Hutt Valley
Te Awarua-o-Porirua
Kāpiti Coast
Ruamāhanga
Wairarapa Coast
PAGE 15 OF 23Summary tables and graphs Cold Season 2019
Cumulative rainfall plots
Cumulative rainfall totals for the November to April 2020 period are detailed for various rain gauges
sites across the regional whaitua areas, as denoted by the blue trace on the following plots. The
November to April 2019 period is denoted by the red trace and the black trace represents the long-
term average rainfall accumulation.
Wellington and Hutt Valley
The plots highlight that the rainfall accumulation during the November to April period was about average in Wellington and
below average in the Hutt Valley.
800 600
Karori Reservoir Lower Hutt
700
500
Cummulative Rainfall Total (mm)
Cummulative Rainfall Total (mm)
600
400
500
400 300
300
200
200
100
100
0 0
Nov Dec Jan Feb Mar Apr Nov Dec Jan Feb Mar Apr
Porirua Harbour
The plots show that the rainfall accumulation evolution over the November to April period at the two sites within the Te
Awarua-o-Porirua whaitua area. A large increase during December put the accumulation well above average but drier
conditions through January and February brought it back close to normal.
700 600
Battle Hill Tawa Pool
600
500
Cummulative Rainfall Total (mm)
Cummulative Rainfall Total (mm)
500
400
400
300
300
200
200
100
100
0 0
Nov Dec Jan Feb Mar Apr Nov Dec Jan Feb Mar Apr
PAGE 16 OF 23Summary tables and graphs Cold Season 2019
Kāpiti Coast
Rainfall recorded at Otaki tracked near to the average throughout the November to April period while Waikanae fell below
normal from late January onward.
500 600
Otaki Depot Waikanae (Water Treatment Plant)
450
500
400
Cummulative Rainfall Total (mm)
Cummulative Rainfall Total (mm)
350
400
300
250 300
200
200
150
100
100
50
0 0
Nov Dec Jan Feb Mar Apr Nov Dec Jan Feb Mar Apr
Ruamāhanga
Rainfall accumulation at these two locations shows clearly the effect of the very dry conditions from late December to late
March.
700 600
Featherston Longbush
600
500
Cummulative Rainfall Total (mm)
Cummulative Rainfall Total (mm)
500
400
400
300
300
200
200
100 100
0 0
Nov Dec Jan Feb Mar Apr Nov Dec Jan Feb Mar Apr
Wairarapa Coast
800
Tanawa Hut - NE Wairarapa Hill County
700
Cummulative Rainfall Total
The Tanawa Hut rain gauge in the Wairarapa Coast
600 area showed a similar rainfall accumulation trend to
500 the Longbush gauge (above), but finished the period
with a well below average total.
(mm)
400
300
200
100
0
Nov Dec Jan Feb Mar Apr
PAGE 17 OF 23Summary tables and graphs Cold season 2019
River flows - averages
The average river flows over the entire November to April period were below average across much of the region. Flows in
the Ruāmahanga Valley were as low as 30 to 60% of normal over the 6 month period. January and February saw very low
flow conditions everywhere.
Flow as a percentage of average
Whaitua River Nov Dec Jan Feb Mar Apr Nov-Apr
Hutt River - Kaitoke 88 101 31 37 112 59 74
Hutt River - Taita Gorge 84 102 35 34 90 47 69
Wellington Akatarawa River 95 101 38 47 84 62 75
Harbour & Hutt
Valley Mangaroa River 82 112 28 27 96 28 66
Waiwhetu Stream 105 162 49 30 94 39 82
Wainuiomata River 82 115 41 37 144 58 81
Porirua 96 187 71 60 115 50 99
Te Awarua-o-
Pauatahanui 131 299 75 50 97 54 129
Porirua
Horokiri 96 244 71 34 66 45 95
Waitohu 126 60 41 48 97 64 78
Otaki 103 59 45 64 117 87 78
Kāpiti Coast
Mangaone 84 59 90 79 154 132 89
Waikanae 122 105 39 36 89 63 80
Kopuaranga 42 47 28 16 59 34 37
Waingawa 78 70 24 31 50 63 56
Waiohine 82 70 29 37 80 69 64
Ruamāhanga Mangatarere 44 60 19 11 57 39 40
Tauherenikau 75 81 21 26 104 71 66
Otukura 71 55 21 5 61 104 57
Ruamāhanga 74 65 25 25 61 60 55
Wairarapa Coast Pahaoa 32 13 4 1 225 62 79
Click the following links to return to climate summaries for:
Wellington Harbour & Hutt Valley
Te Awarua-o-Porirua
Kāpiti Coast
Ruamāhanga
Wairarapa Coast
PAGE 18 OF 23Summary tables and graphs Cold Season 2019
River flows – lowest
Minimum river and stream flows recorded during the November to April 2020 period.
Minimum Flow
Whaitua River
Flow (m3/s) Date Comment
4th lowest on record (from
Hutt (Kaitoke) 0.895 15-Mar 1968)
Hutt (Taita Gorge) 3.13 10-Feb
Wellington Harbour
& Hutt Valley Akatarawa 1.092 8-Feb 102% of average low flow
Mangaroa 0.351 17-Mar
Wainuiomata 0.143 10-Mar
Porirua 0.137 14-Mar
Te Awarua-o-
Pauatahanui 0.114 14-Mar
Porirua
Horokiri 0.089 16-Mar
Waitohu 0.106 22-Apr
Otaki 5.477 10-Feb 107% of average low flow
Kāpiti Coast
Mangaone 0.207 3-Nov 29% of average low flow
Waikanae 1.084 15-Mar
Kopuaranga 0.228 26-Feb Approx. a 1 in 5-year low flow
Waingawa 0.91 13-Mar
Waiohine 2.68 10-Feb
Mangatarere 0.063 14-Mar 38% of average low flow
Ruamāhanga
Tauherenikau 0.619 27-Jan 47% of average low flow
Otukura 0.004 13-Feb 6% of average low flow
Ruamāhanga (Upper) 1.699 14-Mar Approx.. a 1 in 10-year low flow
Ruamāhanga (Lower) 5.169 14-Mar Approx.. a 1 in 20-year low flow
Wairarapa Coast Pahaoa 0.006 10-Mar Approx.. a 1 in 15-year low flow
* Analyses have been completed on provisional data which may be subject to change once it is processed and archived.
Click the following links to return to climate summaries for:
Wellington Harbour & Hutt Valley
Te Awarua-o-Porirua
Kāpiti Coast
Ruamāhanga
Wairarapa Coast
PAGE 19 OF 23Summary tables and graphs Cold season 2019
River flows – highest
Maximum river and stream flows recorded during the November to April 2020. The estimated return period is given for each
event.
Maximum Flow
Whaitua River
Return Period
Flow (m3/s) Date
(years)
Hutt (Kaitoke) 201 20 December 1
Hutt(Taita Gorge) 465 8 December 1
Wellington Harbour Akatarawa 164 8 December 1
& Hutt Valley Mangaroa 62 8 December 1
Waiwhetu 12 8 December 2
Wainuiomata 31 8 December 2
Porirua 29 8 December 1
Te Awarua-o-
Pauatahanui 78 8 December 20
Porirua
Horokiri 19 8 December 1
Otaki 524 20 December 1
Kāpiti Coast Mangaone 5 15 November 1
Waikanae 80 8 December 1
Kopuaranga 6 29 March 1
Waingawa 251 20 December 1
Waiohine 714 20 December 1
Mangatarere 29 20 December 1
Ruamāhanga
Tauherenikau 238 20 December 1
Otukura 2 28 March 1
Ruamāhanga (Upper) 371 20 December 1
Ruamāhanga (Lower) 647 20 December 1
Wairarapa Coast Pahaoa 384 29 March 1
* Analyses have been completed on provisional data which may be subject to change once it is processed and archived .
Click the following links to return to climate summaries for:
Wellington Harbour & Hutt Valley
Te Awarua-o-Porirua
Kāpiti Coast
Ruamāhanga
Wairarapa Coast
PAGE 20 OF 23Summary tables and graphs Cold season 2019
Soil moisture content
Wairarapa Coast
November 2019 to April 2020 moisture content at monitoring sites at Tanawa Hut in north-east Wairarapa (Wairarapa Coast
whaitua) and Tauherenikau racecourse (Ruamāhanga whaitua) are plotted below.
Soil moisture at Tanawa Hutt started to dip below average in late November before recovering only to fall well below normal
through February and March.
Tanawa Hut (North-eastern Wairarapa hill country) Historical min and max range
60
Long-term average
7-day mean Soil Moisture Content (%)
2018/19
50 2019/20 Field capacity
(estimate only)
40 Stress point
(estimate only)
30
Permanent wilting point
(estimate only)
20
10
Nov Dec Jan Feb Mar Apr May
40
Tauherenikau Racecourse
2017/18 2018/19 2019/20
7-day mean Soil Moisture Content (%)
30
20
10
0
Nov Dec Jan Feb Mar Apr May
Drought monitoring
GWRC maintains a drought check webpage with regional anomaly maps and links to live data across the
region:
http://www.gwrc.govt.nz/drought-check/
Climate Briefings
Additionally to the extended water resources reports, the Environmental Science department, GWRC, also
produces seasonal updates specifically targeting the farming community. Those can be accessed from the
main Climate and Water Resource webpage:
http://www.gw.govt.nz/seasonal-climate-and-water-resource-summaries-2/
PAGE 21 OF 23Summary tables and graphs Cold season 2019
Environmental data
GWRC maintains a comprehensive online environmental data server providing real time data across the
region for several climatic and hydrological variables
http://graphs.gw.govt.nz
Interactive Climate Change Mapping
The Environmental Science department at GWRC has produced one of the first comprehensive climate
change mapping tools publicly available in New Zealand. The online mapping tool is fully interactive and
easy to understand, allowing users to plot over twenty different variables, projected over every available
IPCC scenario for both mid and late century
https://mapping1.gw.govt.nz/gw/ClimateChange/
Sea level Rise Mapper (New)
The Environmental Science department at GWRC is also making available a comprehensive sea level rise
(SLR) mapper for the whole region. The tool allows users to have a view of sea level rise impacts, for values
between zero and 5m SLR, including the effects of storm surge for selected heights. We encourage
community and stakeholders to use this tool as a first screening of likely impacts that the region will be
dealing with, as sea levels continue to rise.
https://mapping1.gw.govt.nz/GW/SLR/
PAGE 22 OF 23Summary tables and graphs Warm Season 2017/2018
PAGE 23 OF 23You can also read