Thematic Maps: Visualizing Spatial Variability and Shared Benefits
←
→
Page content transcription
If your browser does not render page correctly, please read the page content below
Thematic Maps: Visualizing
Spatial Variability and Shared
Benefits

S   patial variability is at the heart of geography, a field dedicated to
   understanding where things are and why. It is also a critical
component in understanding many complex systems, particularly
those which include interactions between wildly disparate sets of
forces.
    Water systems, for example, can act as a powerfully unifying
resource, so it is ironic to the point of absurdity that water educa-
tion, management, and discourse are so fragmented. To truly assess
water resources in their most holistic sense, one needs to include
the many aspects of the hydrologic cycle, from meteorology to
surface hydrology to soil sciences to groundwater to limnology to
aquatic ecosystems. And that is just the physical system. One should
also have an integral sense of the human dimensions, from eco-
nomics to law to ethics to aesthetics to sociology and anthropology.
Universities and management institutions are simply not organized
along these lines; often they are fragmented to the point where even
surface water and groundwater, quality and quantity, are separated
out as if they were not inextricably inter-related.
    Fortunately, nature has given us a unit for analysis in which all of
these components coalesce — the river basin.1 Unfortunately, many
analysts have a tendency to ignore this hydro-centric unit, especially
when including socio-economic or geo-political variables, in favor
of units for which one can actually find data, notably the nation-
state.2 The fact that water resource issues manifest themselves within
basins, while analyses are often based on country boundaries, can
lead to fundamental misunderstandings. Take, for instance, the most
widely cited measure for water resources management — Malin

1
  A “river basin” is defined as the area which contributes hydrologically (including
both surface- and groundwater) to a first order stream, which, in turn, is defined
by its outlet to the ocean or to a terminal (closed) lake or inland sea. Thus, “river
basin” is synonymous with what is referred to in the US as a “watershed” and in
the UK as a “catchment.”
2
 A useful exception is Revenga, C., S. Murray, J. Abrams, and A. Hammond.
Watersheds of the World (Washington, DC: World Resources Institute, 1998),
which describes 15 biophysical variables for 145 of the world’s major river
basins.

                                                          Thematic Maps           9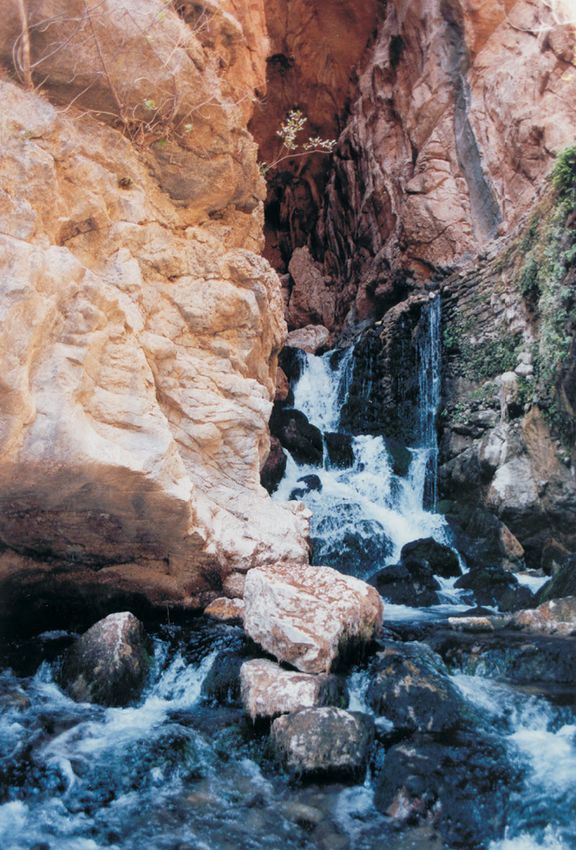
data layers alone allow us to visualize representa-
                                                            tions of interactions between the location of headwa-
                                                            ters, economic development, national water scarcity,
                                                            likely dam sites and agricultural land and, perhaps as
                                                            a result of these interactions, allow us to gain some
                                                            insight into each basin country’s vote in the UN
                                                            General Assembly on the 1997 Convention on the
                                                            Law of the Non-Navigational Uses of International
                                                            Watercourses (represented in the top layer).
                                                               What does this have to do with treaties? What one
                                                            notices in the global record of water negotiations is
                                                            that many begin with parties basing their initial
                                                            positions in terms of rights — the sense that a ripar-
                                                            ian is entitled to a certain allocation based on
                                                            hydrography or chronology of use. Up-stream
                                                            riparians often invoke some variation of the Harmon
                                                            Doctrine, claiming that water rights originate where
                                                            the water falls. Down-stream riparians often claim
                                                            absolute river integrity, claiming rights to an undis-
                                                            turbed system or, if on an exotic stream, historic rights
  Figure 4. Spatial variation.                              based on their history of use.
                                                                In almost all of the disputes that have been
Falkenmark’s (1989) Water Stress Index. This index,         resolved, however, particularly on arid or exotic
which divides the volume of available water re-             streams, the paradigms used for negotiations have
sources for each country by its population, was             not been ‘rights-based’ at all — neither on relative
originally only meant for preliminary, comparative          hydrography nor specifically on chronology of use —
purposes. Yet, as with many elegant measures, it has        but rather ‘needs-based.’ ‘Needs’ are defined by
taken on a life of its own, often pointed to in security    irrigable land, population, or the requirements of a
studies as an indicator of future conflict.
    The top of Figure 4 shows a river basin shared by
two nations, neither of which is particularly “water
stressed,” at least if assessed on a national basis.
Yet, as presented in the lower figure, when we break
down the data by basin and further include spatial
variability (in this case, of precipitation), we obtain a
much more accurate picture of the stresses in the
lower Colorado River, shared by the United States
and Mexico..
    By superimposing several different data sets within
a Geographic Information System (GIS), unified by
the river basin, one can often increase understanding
of the complex systems at work. Figure 5, for ex-
ample, superimposes Ohlsson’s Social Water Stress
Index (“water stress” essentially weighted for level of
economic development by a factor based on UNDP’s
Human Development Index), in the middle layer, over
topography (which shows where the headwaters, dam             Figure 5. GIS and visualization: from bottom to top — topography,
sites, and agricultural land all lie), on the bottom          social water stress index, and country votes on 1997 UN Conven-
layer, for the Ganges-Brahmaputra basin. These two            tion. Green states voted “yes,” red voted “no,” pink “abstained,”
                                                              and states in white were absent..

10      Atlas of International Freshwater Agreements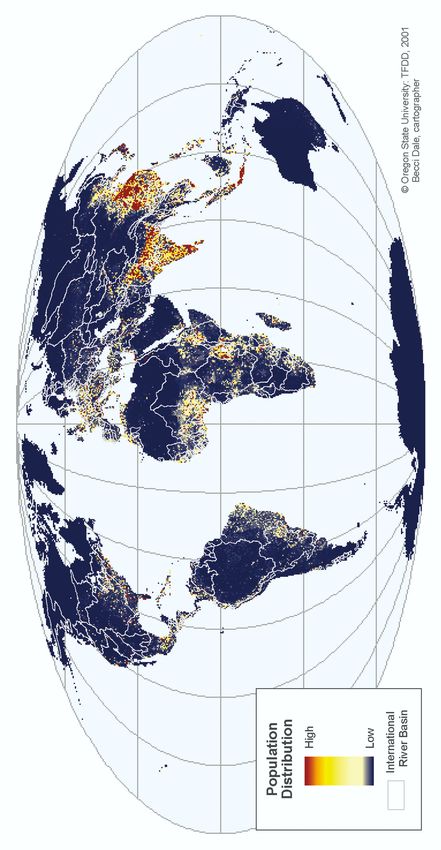
specific project. Occasionally, rare agreements go
beyond ‘needs’ to ‘interests’ — the underlying
incentives which influence individual and political
behavior, such as the political capital gained through
addressing a particular set of constituents’ water
issues.
    In other words, the process of conflict resolution
involves understanding the characteristics of a basin,
in all of its bio-physical, socio-economic, and geo-
political complexity, and then identifying the potential
for positive-sum solutions based on the disparate
interests of each party. Occasionally, this comprehen-
sive approach has allowed riparians to move beyond
looking at water as a commodity to be divided – a
zero-sum, rights-based approach – and rather to
develop an approach that equitably allocates not the
water, but the benefits derived therefrom – a positive-
sum, integrative approach, as seen below:
    • Agreements developed under the Boundary
Waters Agreement between Canada and the United
States of America, for example, allocate not water,
but equal benefits, usually defined by hydropower
generation and flood control. This allocation of
benefits results in the seemingly odd arrangement                               Iron Creek Falls, Columbia River tributary. Photo credit: Bryan P. Bernart.
that power may be exported out of the basin for gain,
but the water itself may not. In the 1964 treaty on the                         per cubic meter than the alternate use in hydropower
Columbia, an arrangement was worked out where                                   generation.
the United States paid Canada for the benefits of                                  • In 1957, the creation of the Mekong Com-
flood control and Canada was granted rights to                                  mittee for Coordination of Investigations of the Lower
divert water between the Columbia and Kootenai                                  Mekong Basin was the first example of UN involve-
rivers for hydropower. The relative nature of “benefi-                          ment in a program to develop an international river
cial” uses is exhibited in a 1950 agreement on the                              basin. The new Mekong Agreement was signed in
Niagara, which provides a greater flow over the                                 1995, after a relatively short period of negotiation
famous falls during the “show times” of summer                                  benefiting from a shared data base, long-established
daylight hours, when tourist dollars are worth more                             relationships, and the familiarity of the key players

American Falls of Niagara River (left). Photo credit: Camille Freitag. Garganta del Diablo in Iguazu Falls. Photo credit: Rolando León.

                                                                                                                             Thematic Maps               11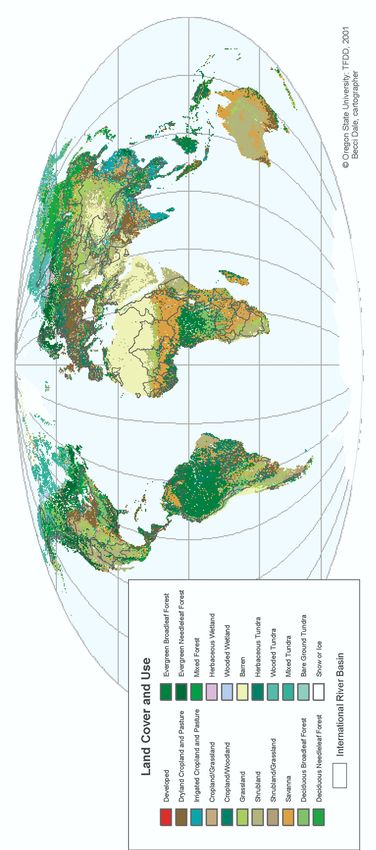
grated watershed management and environmental
                                                               protection along a waterway with otherwise wide-
                                                               spread potential for disputes. The Environmental
                                                               Program for the Danube River is also a basin-wide
                                                               international body that actively encourages public
                                                               and NGO participation throughout the planning
                                                               process. This proactive stakeholder participation may
                                                               help preclude future disputes both within countries
                                                               and as a consequence, internationally.
                                                                  • Even while Israel and Jordan were legally at
                                                               war, Israeli and Jordanian water officials met several
                                                               times a year at so called “Picnic Table Talks.” As a
                                                               result, when the Jordan-Israel Peace Treaty was
Columbia River tributary. Photo credit: Bill Anderson.         signed in 1994, it was possible to include a well-
                                                               developed annex acknowledging that, “water issues
     with the provisions of relevant international jurispru-   along their entire boundary must be dealt with in their
     dence. The Mekong Agreement clearly states the            totality.”
     mutual commitment to cooperate. It establishes the            Part of the process of identifying options for joint
     Mekong River Commission as the international body         gains is “simple” visualisation. One needs to be able
     that implements the Agreement and seeks coopera-          to see both the spatial diversity of the problems, and
     tion on all aspects of water management.                  the unifying forces of the watershed to be able start to
         • Despite three wars and numerous skirmishes          comprehend mutually beneficial trade-offs. To that
     since 1948, India and Pakistan, with World Bank
     support, have managed to negotiate and implement
     a complex treaty on sharing the waters of the Indus
     River system. The Indus Water Treaty was finally
     signed in 1960. During periods of hostility, neither
     side targeted the water facilities of the other nor
     attempted to disrupt the negotiated arrangements for
     water management.
         • The political will to achieve a basin-wide
     agreement and framework for long-term cooperation
     on the part of the ten Nile Basin riparian states is
     gathering momentum. In 1992, representatives of all
     ten states agreed upon a Nile River Basin Action
     Plan, with the task of developing a cooperative
     scheme for the management of the Nile. In 1995, the
     World Bank, together with UNDP and the Canadian
     International Development Agency, accepted the
     request from the Nile riparian states to give impetus
     to the project. In 1999, the Nile Basin Initiative was
     launched, with the participations of all the basin
     states. The international community has facilitated an
     ongoing dialogue between the riparians of the Nile
     Basin, to develop a process of joint planning and
     institutional capacity-building.
        • The Danube Convention is a vital legal
     continuation of a tradition of regional management
     along the Danube dating back 140 years. As a
     document, it provides a legal framework for inte-           Tigris River tributary. Photo credit: Babak Sedighi.

      12        Atlas of International Freshwater Agreements
end, we include the following thematic world maps.                             basin. It is our hope that, by seeing sometimes
These ten maps, which include some traditional                                 familiar information within these new delineations,
hydrologic data, and some less-traditional (as well as                         these maps may help spark some new approaches to
less hydrological), are broken down spatially but                              a problem as old as history — how do we share this
unified by one delineation — the international river                           critical resource on which everything we do relies?

Clockwise, from top left: Urubamba River (M. Giordano); Vltava River (S. Yoffe); Tonle Sap (M. Giordano); Entiat River (T. Davis); Meuse River
(B. Miraglia); Blue Nile River (B. Bishaw); La Plata River (R. León); Tigris River tributary (B. Sedighi); Amazon River (G. Bracher). Center:
Wenatchee River (T. Davis); Congo/Zaire River (D. Thomas).

                                                                                                                           Thematic Maps         13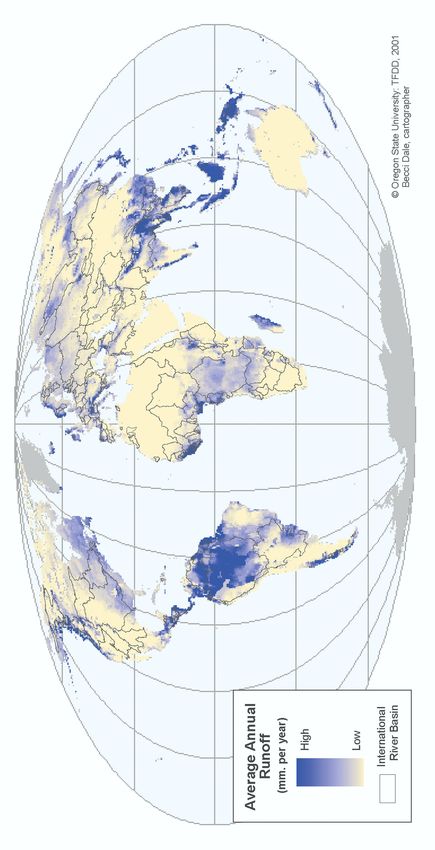
14
                                               Number of Agreements per
                                               International River Basin

Atlas of International Freshwater Agreements
                                               Data source: Treaties- Wolf (1999b).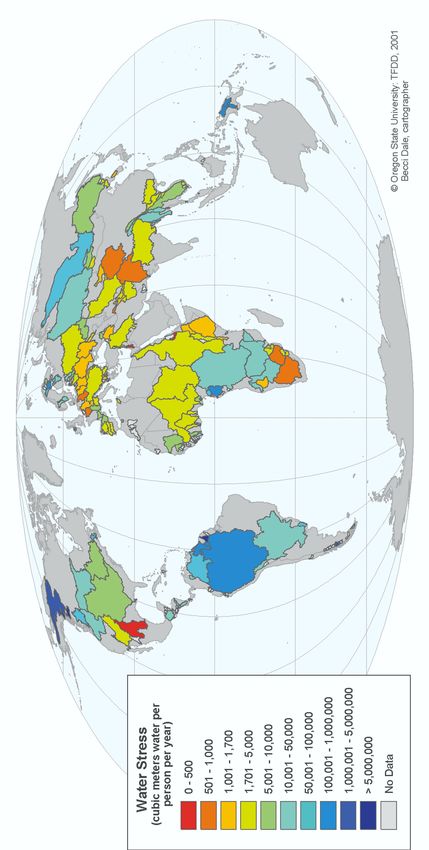
Gross Domestic Product
                per Capita

Thematic Maps
                Data source: GDP- World Resources 1998-1999 Database (1998).

15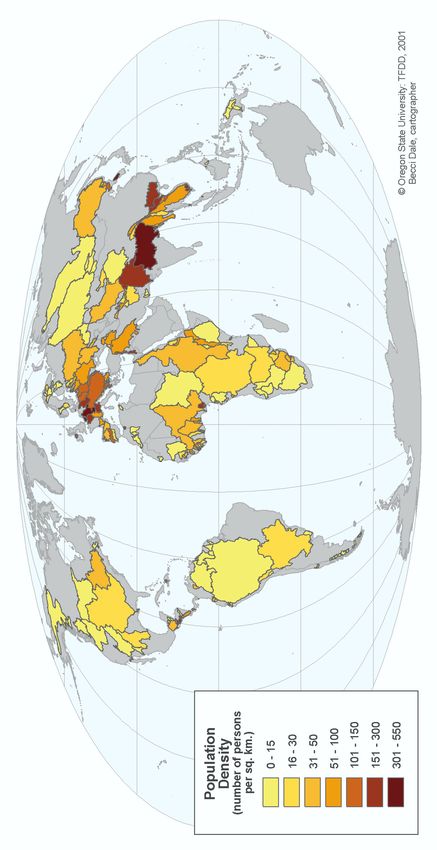
16
                                               Population Distribution

Atlas of International Freshwater Agreements
                                               Data source: Population- Dobson et al. (2000).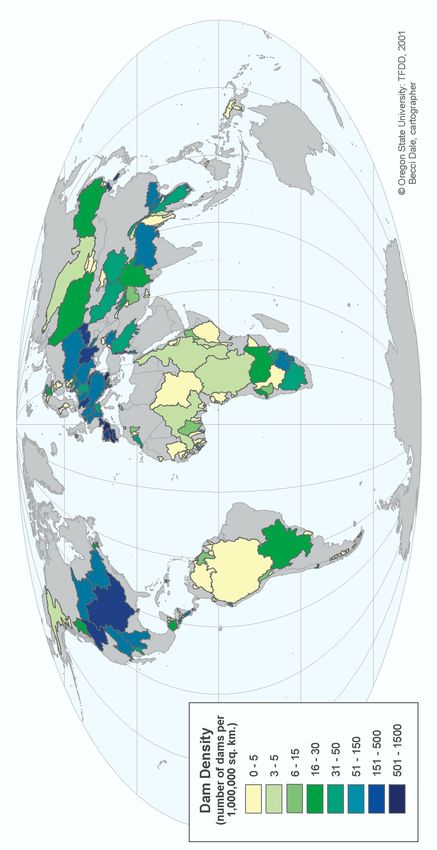
Population Density per
                International River Basin

Thematic Maps
                Data sources: Population- Dobson et al. (2000); Density by basin- Fiske and Yoffe (2001).

17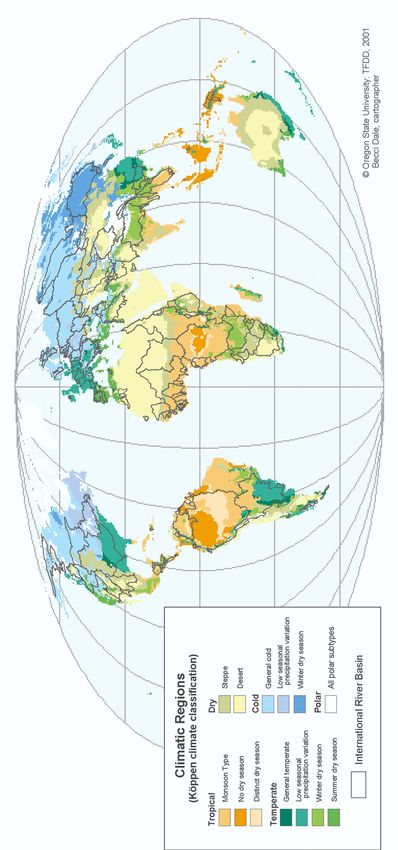
18
                                               Climatic Regions

Atlas of International Freshwater Agreements
                                               Data source: Köppen climate zones- FAO-SDRN Agrometeorology Group (1997).
Land Cover and Use
Thematic Maps
Data source: Land cover and use- United States Geological Survey (USGS), the University of
Nebraska-Lincoln (UNL), and the European Commission’s Joint Research Centre (JRC) (1997).
1920
Irrigated Areas,
circa 1995
Atlas of International Freshwater Agreements
Data source: Irrigated agriculture- Döll and Siebert (2000), Siebert and Döll (2001).Dam Density per
International River Basin
Thematic Maps
Data sources: Dams- Ph.D. Associates Inc. (1998); Density by basin- Fiske and Yoffe (2001).
2122
Average Annual Runoff
Atlas of International Freshwater Agreements
Data source: Runoff- Fekete et al. (2000).Water Stress per
International River Basin
Thematic Maps
Data sources: Runoff- Fekete et al. (2000); Population- Dobson et al. (2000); Water stress by basin-
Fiske and Yoffe (2001).
23You can also read