Nowcasting Applications - African SWIFT Summer School Morné Gijben Weather Research - GCRF African SWIFT
←
→
Page content transcription
If your browser does not render page correctly, please read the page content below
Nowcasting Applications

               African SWIFT Summer
                        School
                               Morné Gijben
                       morne.gijben@weathersa.co.za
                            Weather Research
                      South African Weather Service

                Doc Ref no: RES-PPT-SWIFT-20190729-GIJ002-001.1
2020/01/10                                                        1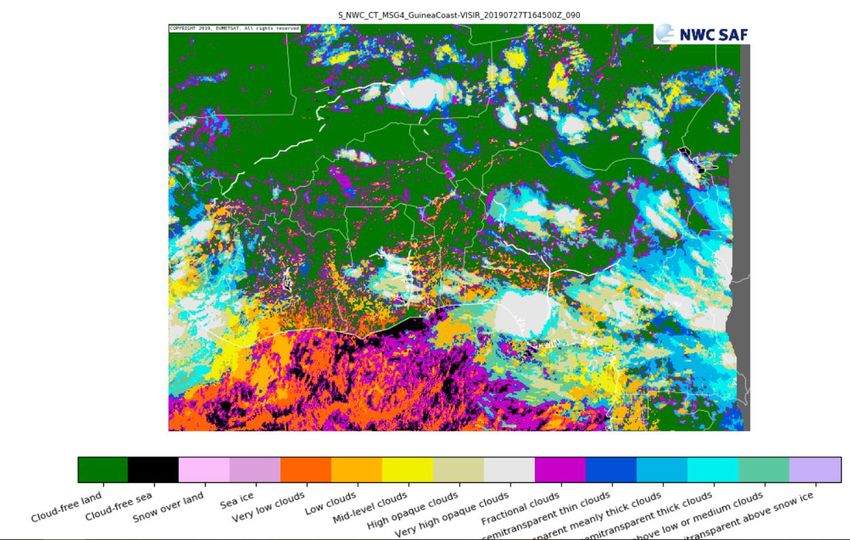
What is the difference
     between nowcasting and
          forecasting?

2020/01/10                     2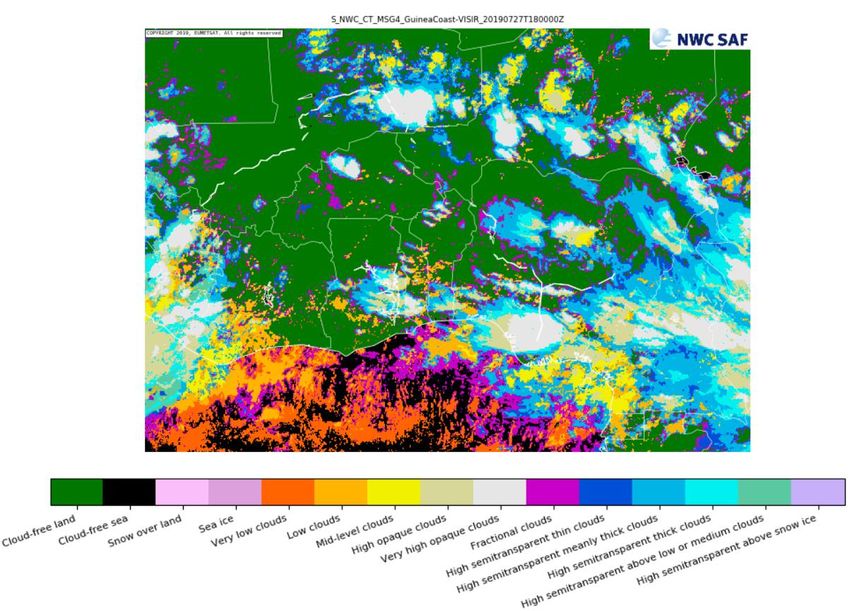
Definition of time ranges

• Nowcasting: A description of current weather parameters and 0
  to 2 hours’ description of forecast weather parameters
• Very short-range weather forecasting: Up to 12 hours’
  description of weather parameters
• Short-range weather forecasting: Beyond 12 hours’ and up to
  72 hours’ description of weather parameters
• Medium-range weather forecasting: Beyond 72 hours’ and up
  to 240 hours’ description of weather parameters
• Extended-range weather forecasting: Beyond 10 days’ and up
  to 30 days’ description of weather parameters. Usually averaged
  and expressed as a departure from climate values for that period

   2020/01/10                                                 3
Definition of time ranges
• Long-range forecasting: From 30 days up to two years
• Month forecast: Description of averaged weather parameters
  expressed as a departure (deviation, variation, anomaly) from
  climate values for that month at any lead-time
• Seasonal forecast: Description of averaged weather parameters
  expressed as a departure from climate values for that season at
  any lead-time
• Climate forecasting: Beyond two years
• Climate variability prediction: Description of the expected
  climate parameters associated with the variation of interannual,
  decadal and multi-decadal climate anomalies
• Climate prediction: Description of expected future climate
  including the effects of both natural and human influences

   2020/01/10                                                  4
Why do we need nowcasting?
• Mandate of all weather services globally is to save lives and
  prevent losses
• Monitoring weather events in real time and where they will
  move to in the next 2 hours (nowcasting) should lead to
  warnings to the public on the action which is needed to save
  lives and prevent damage to property
• Nowcasting can warn the public on the impact of severe
  weather events (such as local flooding or wind/hail etc)
• International trends are focusing more and nowcasting due
  to the impact this has on people

   2020/01/10                                               5
• On the nowcasting to very short range forecasting time scale
  (first 12 hours):
   – we rely heavily on remote sensing since this gives us real
      time information
   – This is used for warnings
• On the short to medium (and longer time scales):
   – NWP/EPS is more important
   – This is used for watches and advisories (more than a day
      ahead)
• Between real time and 12 hours we can make use of remote
  sensing blended/combined with NWP to extend the remote
  sensing tools

   2020/01/10                                              6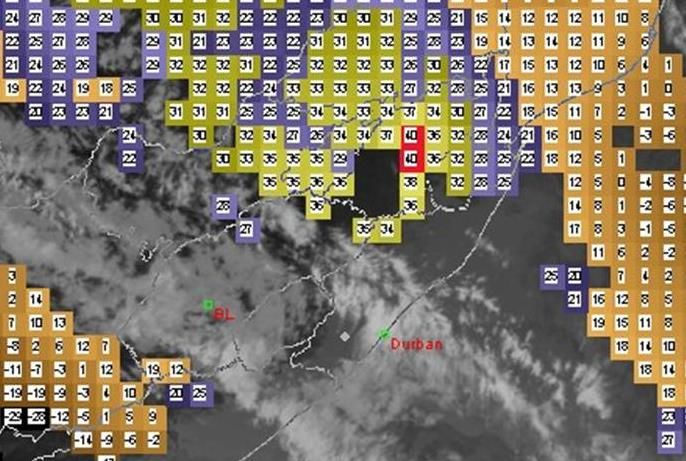
Improved observation of real time
            events:
What can satellite provide to us for
     nowcasting purposes?

 2020/01/10                      7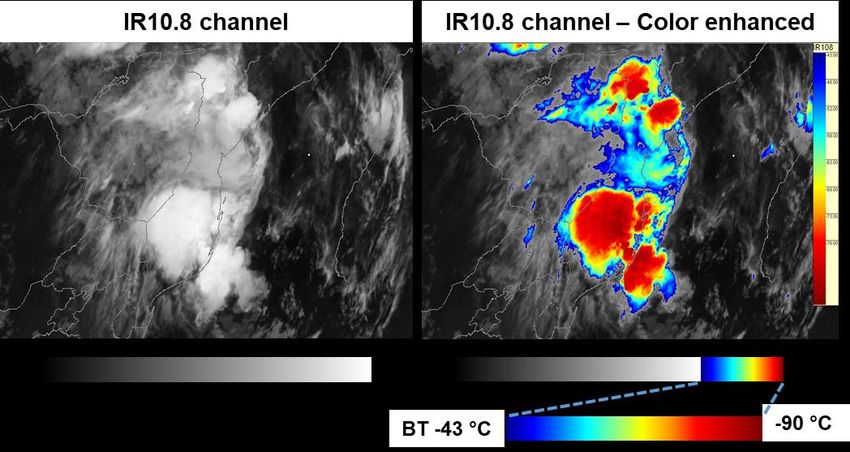
The Meteosat Satellite channels
                    Channel             Band (μm)
                    VIS0.6              0.56 – 0.71
                    VIS0.8              0.74 – 0.88
                    NIR1.6              1.50 – 1.78
                     IR3.9              3.40 – 4.20
                     IR8.7              8.30 – 9.10
                    IR10.8             9.80 – 11.80
                    IR12.0             11.00 – 13.00
                    WV6.2               5.35 – 7.15
                    WV7.3               6.85 – 7.85
                     IR9.7              9.38 – 9.94
                    IR13.4             12.40 – 14.40
                     HRV                 0.4 – 1.1

~3 km data sampling intervals, except HRV (~1 km)
Images every 15 minutes
 2020/01/10                                            8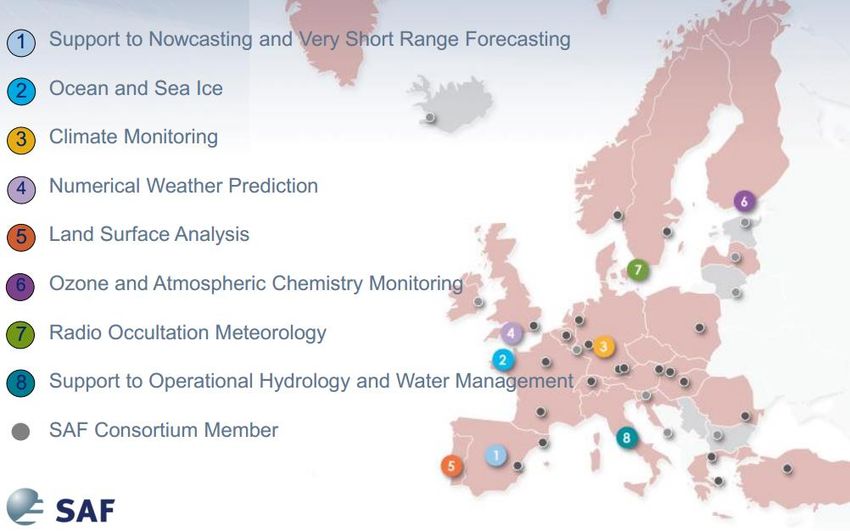
Single Channels

             IR10.8 channel

                                   • Gives some idea of the
                                     type of clouds
                                   • Bright white color cold
                                     temperatures
                                   • Grey colors warmer
                                     clouds

2020/01/10                                              9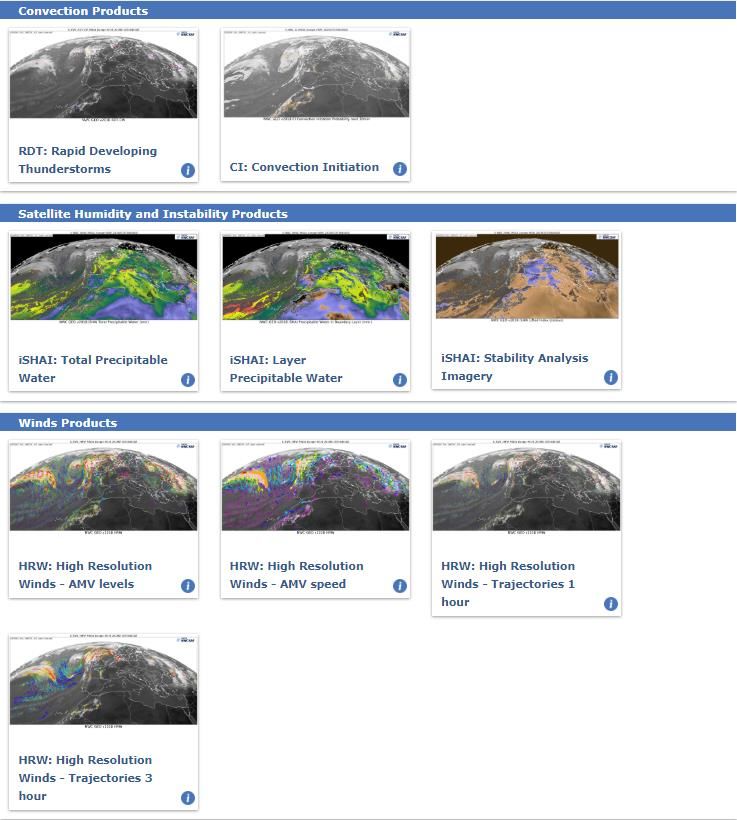
Color enhancement of IR imagery
• A color palette can be added to IR channel displays to enable forecasters
  to see cloud top temperatures in color
• This color palette makes it easier to see cloud top features
• Since tall, cold clouds can be associated with severe weather, this is of
  interest to us all.

   2020/01/10                                                        10
Cold-U/V & Cold-ring shaped storms
Definitions:

Embedded warm area (spot):
   • smaller region of higher BT,
   • enclosed by a (more or less) continuous region of lower temperatures,
   • forms downwind of overshooting tops or in vicinity of elevated domes.

The cold-U/V and cold-ring:
    • features are cold parts of a regular storm anvil only,
    • surrounding longer-lived (~ 30-40 minutes at least) and
    • larger-sized embedded warm areas.
    • It is the character and form of the embedded warm area which determines if the storm
       is labeled as a cold-ring-shaped or cold-U/V-shaped one.

    2020/01/10                                                                     11
Cold-U/V & Cold-ring shaped storms
• Short-lived embedded warm spots/areas (~ 5-20 minutes)
• More frequent
• Do not indicate possible severe weather
• Long-lived embedded warm spots/areas (~ 1-2 hours)
• Do indicate possible severe weather
Documented cases showed a very close correlation with severe weather or supercells.
However, this feature alone does not automatically classify a storm as a supercell !!!
If observed, it indicates a possible severity of the storm, it is not a prove of the severity!
2020/01/10 12Cold-U/V & Cold-ring shaped storms
• Mechanism of cold-U/V and cold-ring formation still not quite well
(unambiguously) explained.
• Both types are most likely generated by similar mechanisms.
It seems that their occurrence is supported by some specific airmass types:
A strong thermal inversion above the tropopause.
Upper-level wind shear (cold rings typical for lower shear, cold-U/V for
higher values of wind shear.
2020/01/10 13Cold-U/V & Cold-ring shaped storms
• Embedded warm area (spot) - part of the storm above the tropopause, with
warmer temperatures due to the temperature inversion above the tropopause.
• The highest tops are located at the upwind side of the cold ring, and the central
warm spot develops with time downwind of these, above the stratiform part of the
anvil.
2020/01/10 14Cold-U/V & Cold-ring shaped storms
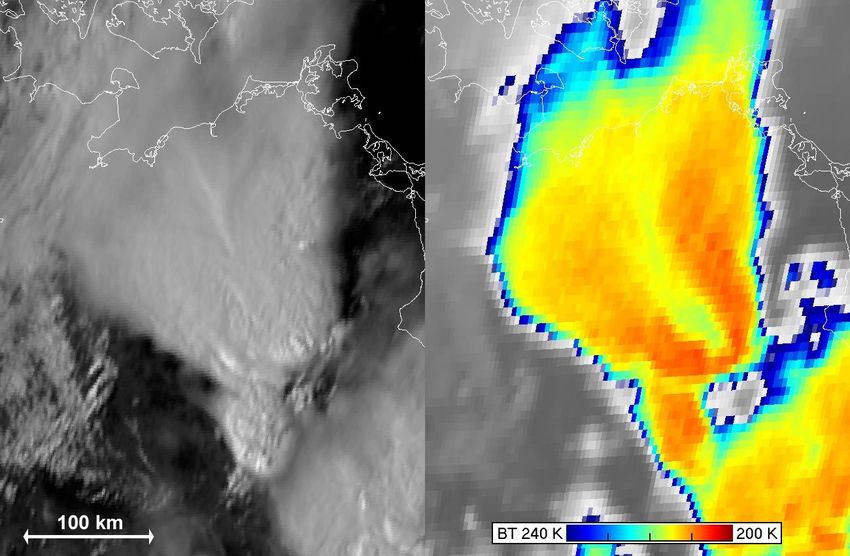
HRV Meteosat-9 (MSG2) 15:00 UTC IR 10.8 BT ENH
DISTANT WARM AREA
(DWA)
CLOSE-IN WARM AREA
(CWA)
COLD-U
2020/01/10 26 May 2007, Germany 15Cold-U/V & Cold-ring shaped storms
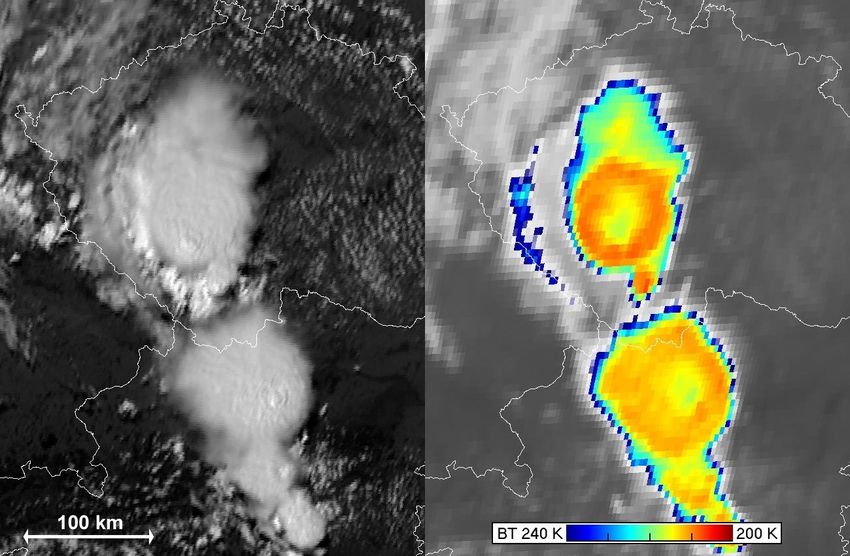
HRV Meteosat-8 (MSG1) 13:45 UTC IR 10.8 BT ENH
CENTRAL WARM SPOT
(CWS)
COLD RING
25 June 2006, Czech Republic and Austria
2020/01/10 16MSG Channel Differences Useful to Monitor
Convection
Channel Diff. Application
IR8.7 - IR10.8 Day/Night: optical thickness, phase
IR10.8 - IR12.0 Day/Night: optical thickness
NIR1.6 - VIS0.6 Day: phase (ice index), particle size
IR3.9 - IR10.8 Day: particle size
Night: particle size (only for warm clouds)
WV6.2 - IR10.8 Day/Night: overshooting tops
2020/01/10 17IR10.8 – IR12.0
• Uses two MSG channels (IR 10.8 and 12.0)
• Identify moisture ridges and drylines
• BTD IR10.8-12.0 gives indication of total moisture content
• Focuses on surface features
recommended by EUMETSAT
Dry Moist
0600Z 0 to +1 K +2 to +4 K
1200Z 0 to +2 K +4 to +6 K
2020/01/10 18IR10.8 – IR12.0
MOIST
DRY
2020/01/10 19IR10.8 – IR12.0
• 09:00 UTC • 13:00 UTC
MOIST
DRY
2020/01/10 20IR10.8 – IR12.0 limitations • Clear skies • Influenced by diurnal variations • Low moisture hot surface = high moisture cold surface • Does not work at night • Does not work in high mountain areas • Contaminated by sandy surfaces 2020/01/10 21
MSG Red-Green-Blue(RGB)
         combinations

2020/01/10                    22
Standard RGBs
RGB Composite Applications Time
RGB 10-09,09-07,09: Dust, Clouds (thickness, phase), Contrails Day & Night
Fog, Ash, SO2, Low-level Humidity
RGB 05-06,08-09,05 Severe Cyclones, Jets, PV Analysis Day & Night
RGB 10-09,09-04,09: Clouds, Fog, Contrails, Fires Night
RGB 02,04r,09: Clouds, Convection, Snow, Fog, Fires Day
RGB 05-06,04-09,03-01: Severe Convection Day
RGB 02,03,04r: Snow, Fog Day
RGB 03,02,01: Vegetation, Snow, Smoke, Dust, Fog Day
2020/01/10 23RGB 05-06, 04-09, 03-01 (Convective Storms)
R = Difference WV6.2 - WV7.3
G = Difference IR3.9 - IR10.8
B = Difference NIR1.6 - VIS0.6
Applications: Severe Convective Storms
Area: Full MSG Viewing Area
Time: Day-Time
2020/01/10 24RGB 05-06,04-09,03-01: Interpretation of Color
Deep precipitating cloud Deep precipitating cloud Thin Cirrus cloud Thin Cirrus cloud
(precip. not necessarily (Cb cloud with strong
reaching the ground) updrafts and severe (large ice particles) (small ice particles)
weather)*
- high-level cloud - high-level cloud
- large ice particles - small ice particles
*or thick, high-level lee
cloudiness with small ice
particles
Ocean Land
2020/01/10 25RGB 05-06, 04-09, 03-01 (Convective Storms)
Thin Ice Cloud
(small ice)
Maputo
Thin Ice Cloud
(large ice)
Thick Ice Cloud Thick Ice Cloud
(large ice) (small ice)
MSG-1, 6 November 2004, 12:00 UTC, RGB 05-06, 04-09, 03-01
2020/01/10 26Overshooting Top RGB • Overshooting tops are the most intense part of thunderstorms • This is where the strongest updrafts are and thus also possible severe weather • To identify this part of the thunderstorm can help with severe weather warnings. 2020/01/10 27
Overshooting Top RGB Recipe

2020/01/10                                 28
Example Overshooting Top RGB

                               = Overshooting Tops

             Airmass RGB          Overshooting Top RGB
14 September 2010, 19:45 UTC
(Hurricane Julia)                      Slide by Jochen Kerkmann
2020/01/10                                                        29
Satellite based instability indices 2020/01/10 30
Instability Indices
• Why do we need to measure instability in the
  atmosphere?
• How do we do it?
• Is this good enough?
• Typical indices?

  2020/01/10                                     31
Instability Indices
• The Global Humanitarian Forum states:
    • “Developing countries, which are most likely to suffer the brunt of
      climate change impacts, have the least number of ground-level
      weather data observation systems, the critical basis for efficient
      delivery of weather information.
    • Despite covering a fifth of the world's total land area, Africa has the
      least developed land-based weather observation system of all
      continents, and one that is in a deteriorating state.
    • Many existing weather stations do not operate properly, or do not
      operate at all.
    • WMO estimates that in an ideal scenario, 10 000 weather stations
      should be operating in Africa. Currently, there are only around 744
      stations operational, less than a quarter of which provide observations
      that meet WMO requirements for standard and frequency of data.”

    2020/01/10                                                         32
Upper air ascents world wide 2020/01/10 33
Typical instability indices

• Lifted Index (LI)
   • A measure of the
     thunderstorm potential which
     takes into account the low
     level moisture availability

• K Index (KI)
   • Large K means a lot of
     moisture available to drive
     cumulus cloud

   2020/01/10                                  34
1. Sounding based instability indices
• The analysis of the atmosphere
during times of thunderstorms has
prompted meteorologists to develop
parameters that would indicate
whether or not the conditions are
favourable for thunderstorm
development.
• These parameters describe how
unstable the atmosphere is or
indicate the likelihood of convection.
• Traditionally, these indices are
taken from temperature and
humidity soundings by radiosondes.
2020/01/10 353. The Global Instability Index (GII)
• As radiosondes are only of very limited temporal and
spatial resolution there is a demand for satellite-
derived indices.
• The basis of the GII methodology is:
• Together with the satellite measured brightness
temperatures and some a priori information of the
atmospheric profile (from the Numerical Weather
Prediction model) a local profile is derived, and instability
indices are computed from this local profile.
• One of the products disseminated by EUMETSAT to all MSG
receivers.
2020/01/10 36• MSG channels 5,6,( WV) 7,9,10 and 11 (IR) are currently used for calculations • The GII product consists of a set of instability indices which describe the layer stability of the atmosphere: • K index, • Lifted Index, • Precipitable Water • The retrieval of these parameters from satellite data is only possible under cloud-free conditions. 2020/01/10 37
MSG MPEF Product: Global Instability Index
                 GII

                             10

                                  16                        Example of a total precipitable
                        16                  14
                                                            water retrieval, co-located
                       12                                   radiosonde observations are
                                                 13   13
                                                            also shown
                                                       21
                  34

                                  41                        INFORMATION about
59
       52
                                                            PW for the
      35
                                                 14         entire African
                                       15

                                                            continent!

     2020/01/10                                                                          38
Example: 26 October 2006
• High K-Index over South Africa
26 October 2006, 0800 UTC
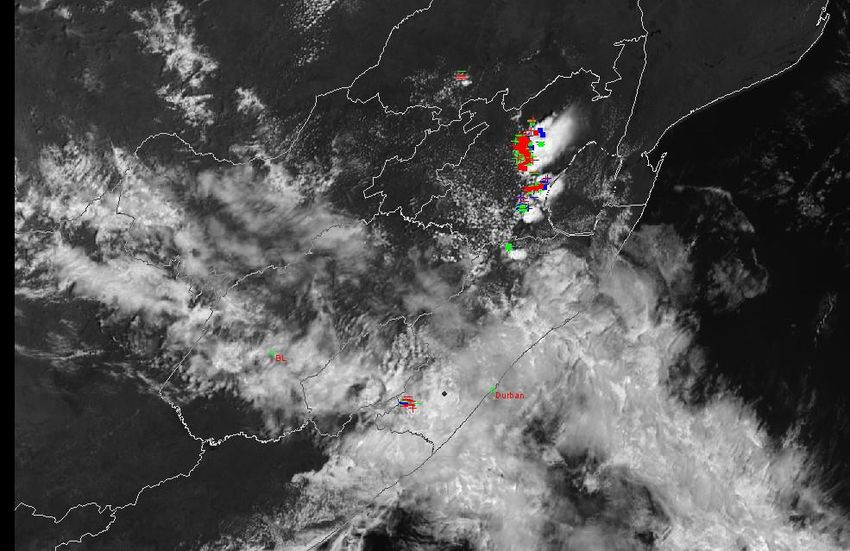
2020/01/10 39Example: 26 October 2006
Lightning Observations 2.5 Hours Later – KI added lead time!
SAWS Lightning Observations and MSG HRV Image 26 October 2006, 1030 UTC
2020/01/10 40Nowcasting SAF software 2020/01/10 41
SAF’s
• Satellite Application Facilities (SAF’s) are dedicated centers
  of excellence for processing satellite data, utilizing specialist
  expertise from the European Union Member States.

   2020/01/10                                                  42
SAF’s

                     The     Nowcasting     SAF
                     started in February 1997
                     aiming to produce the
                     software to deal with the
                     Nowcasting     and     Very
                     Short Range Forecasting
                     using the characteristics of
                     the MSG SEVIRI data.

2020/01/10                                 43
Nowcasting SAF products 2020/01/10 44
Nowcasting SAF products

2020/01/10                             45
Nowcasting SAF products

       Input data
       1. Satellite data – Compulsory
       2. NWP data – Mandatory for most products
       3. Observational data such as lightning data - Optional

2020/01/10                                                       46
Cloud products 2020/01/10 47
Cloud Mask
• Simple product that identifies cloudy/cloud free areas
• All types of clouds
• Not so useful for nowcasting as single image

   2020/01/10                                       48
Cloud Mask
• Extrapolations for next 90-minute available
• This can be useful to estimate where clouds will move.
16:45 Observed 18:00 Nowcast
18:00 Observed
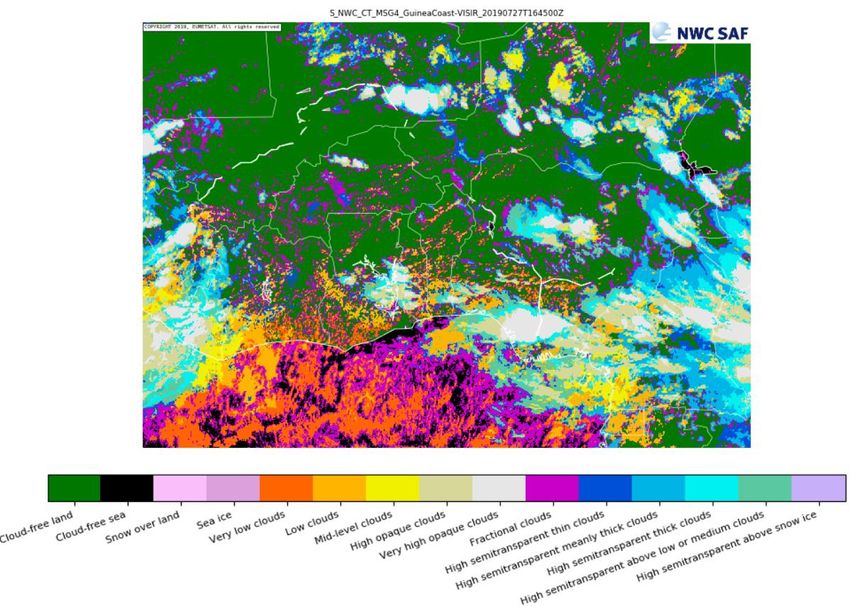
2020/01/10 49Cloud Type • Cloud type identifies clouds based on transparency and height. • Can be extrapolated 90-minutes ahead in time. 2020/01/10 50
Cloud Type
      16:45 Observed
• C                                     18:00 Nowcast

                       18:00 Observed

  2020/01/10                                            51
Instability Products 2020/01/10 52
• Instability Indices gives an indication where thunderstorms
  are possible.

                K Index
                                        Lifted Index

   2020/01/10                                              53
Convection Products 2020/01/10 54
Rapidly Developing Thunderstorms (RDT)
• The RDT product was developed by Meteo-France in the
  framework of the EUMETSAT SAF in support to nowcasting

• Using mainly geostationary satellite data, it provides
  information on clouds related to significant convective
  systems, from meso-scale (200 to 2000 km) down to smaller
  scales (tenth of km).

• The objectives of RDT are twofold:
  – The identification, monitoring and tracking of intense
    convective system clouds
  – The detection of rapidly developing convective cells

   2020/01/10                                                55
Rapidly Developing Thunderstorms
• The RDT makes use of an object-
orientated approach.
• Adds value to a satellite image by
characterizing convective systems
with various parameters of
interest:
• Motion vector (speed and direction)
• Cooling and expansion rate
• Cloud top height and temperature
• Phase of the storm
• Rain rate
• Etc.
• Associated time-series of these
parameters.
2020/01/10 56Rapidly Developing Thunderstorms
• There are 3 stages in the process:
1. The detection of cloud systems
• The detection algorithm defines “cells” which represents cloud
systems
2. The tracking of cloud systems
• The tracking algorithm is mainly built on the overlapping between
cells in two successive images. The previous cells are moved in
the speed and direction analyzed.
3. The discrimination of convective cloud systems
• The goal of the discrimination method is to identify the
convective RDT objects among all cloud cells.
2020/01/10 57Rapidly Developing Thunderstorms
• The main and non-optional satellite channel is IR10.8 μm (used for
detection, tracking and discrimination). Additionally WV6.2, WV7.3, IR8.7
and IR12.0 μm channels are used for convective discrimination.
• Other SAF-NWC products allow to establish a cloud mask (to operate
RDT detection only on cloudy areas) and to describe RDT attributes
(pressure and temperature at the cloud top, cloud type, Convective Rain
Rate)
• NWP data can be used as instability masks, improving the detection of
warm systems by RDT.
• Lightning data, if available in real time, greatly contribute to the
discrimination of convective systems.
2020/01/10 58Example RDT 2020/01/10 59
Example RDT

2020/01/10                 60
Example RDT

2020/01/10                 61
RDT Nowcasts
      15, 30, 45 and 60 minute nowcasts available (forecast tracks)

2020/01/10                                                            62
Convection Initiation
• Provides probability of convection initiation in the next 30-minutes (ie the
likelihood of convection to develop)
2020/01/10 63Rainfall Products 2020/01/10 64
Rainfall Estimation - CRR
• Convective Rainfall Rate (CRR) product developed in the SAF NWC
  context, is a Nowcasting tool that provides information on convective,
  and stratiform associated to convection from MSG-SEVIRI channels.
• CRR uses either 2 or 3 of the MSG SEVIRI channels:
    • Two dimensional matrices with IR108 and (IR108 – WV062)
    • Three dimensional matrices with IR108, (IR108 – WV062) and
      VIS006
• The empirical relationship than the higher and thicker are the clouds the
  higher is the probability of occurrence and the intensity of precipitation is
  used in the CRR algorithm.
• Information about cloud top height and about cloud thickness can be
  obtained, respectively, from the infrared brightness temperature (IR) and
  from the visible reflectance's (VIS)

    2020/01/10                                                            65
Rainfall Estimation - CRR
• IR-WV brightness temperature difference is a useful parameter for
extracting deep convective cloud with heavy rainfall. Negatives values of
the IR-WV brightness temperature difference have been shown to
correspond with convective cloud tops that are at or above the tropopause
• To take into account the influence of environmental and orographic effects
on the precipitation distribution, some corrections can be applied to the
basic CRR value, based on input from numerical weather prediction
models (ECMWF):
• the moisture correction,
• the cloud top growth/decaying rates or evolution correction
• the cloud top temperature gradient correction
• the parallax correction
• the orographic correction
• At the end of the process CRR product produces information on the
instantaneous rain rate in mm/h in each pixel of the image.
2020/01/10 66Example CRR 2020/01/10 67
CRR Example

             CRR                 Rain gauges

2020/01/10                                     68
6 Oct 2014 0600-1100 UTC: T/S over Namibia 2020/01/10 69
CRR – 27 July 2019

2020/01/10                        70
CRR – 27 July 2019
   16:30 Observed                    16:30 Nowcast

                    18:00 Observed

2020/01/10                                           71
Probability of Precipitation
Probability of precipitation in cloud, can also be extrapolated up to 90-minutes ahead
2020/01/10 72Summary • Satellite observations provide useful tools for nowcasting and very short-range forecasting especially in data sparse regions such as Africa. • Individual channels provide some information on thunderstorms. • Color-enhanced channels provide even more detail and cold ring/u-shaped storms can be an indicator of severe storms. • Channel differences can also be very useful to identify certain weather features including thunderstorms and the areas where they can develop. • RGB’s also provide easier visualizations of thunderstorms to assist in nowcasting. 2020/01/10 73
Summary
• Satellite together with NWP can provide instability indices to
  nowcast/forecast where thunderstorms can develop.
• The nowcasting SAF software developed in Europe provides
  sophisticated software for nowcasting purposes with several
  products available.
• The RDT product detects, tracks, discriminates and provides
  nowcasts of rapidly developing and intense thunderstorms.
• The Convection Initiation product provides the probability of
  thunderstorm development
• The CRR product provides rainfall estimates in
  thunderstorms useful for the monitoring and determining the
  intensity of storms.

   2020/01/10                                               74
Thank you

2020/01/10               75
You can also read