Case studies of various types of storms using satellite, radar and lightning data - André Simon, Mária Putsay and Zsófia Kocsis Hungarian ...
←
→
Page content transcription
If your browser does not render page correctly, please read the page content below
Case studies of various types of storms using
                       satellite, radar and lightning data

Photo: Zoltán Goda

                      André Simon, Mária Putsay and Zsófia Kocsis
                           Hungarian Meteorological Service
        2018 Convection Working Group Workshop, Ljubljana, Slovenia, 17-19 April 2018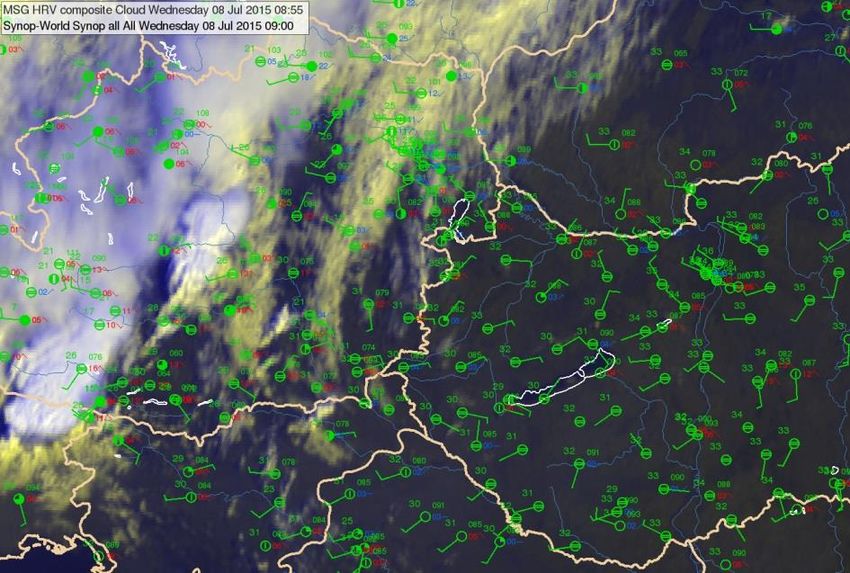
Outlines

Introduction
Five case studies
    Supercell, hailstorm (09 June 2012)
    Hybrid multicell-supercell storm, windstorm (08 July 2015)
    Tornadic storm (16 August 2010)
    Multicell storm and flashflood (31 July 2016)
    Single cell, short-lived local thunderstorm (23 July 2016)
Summary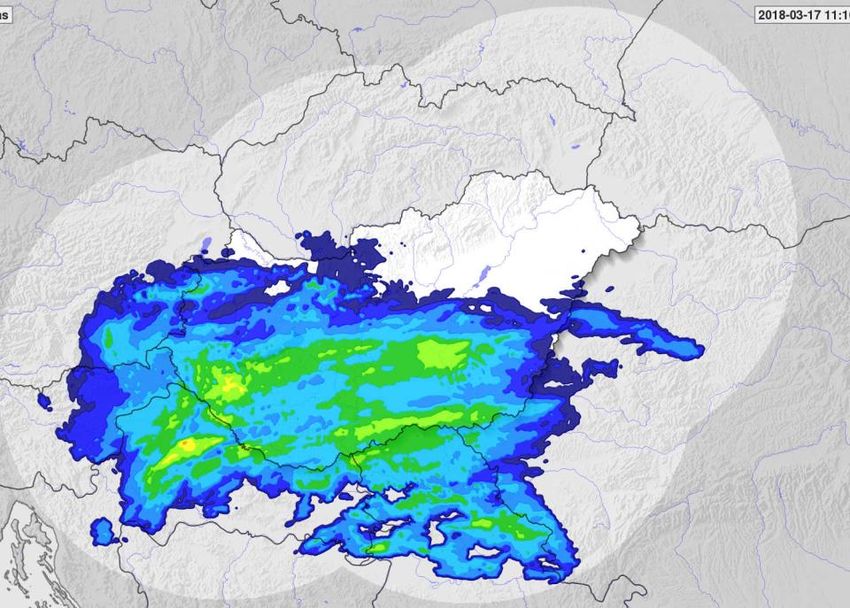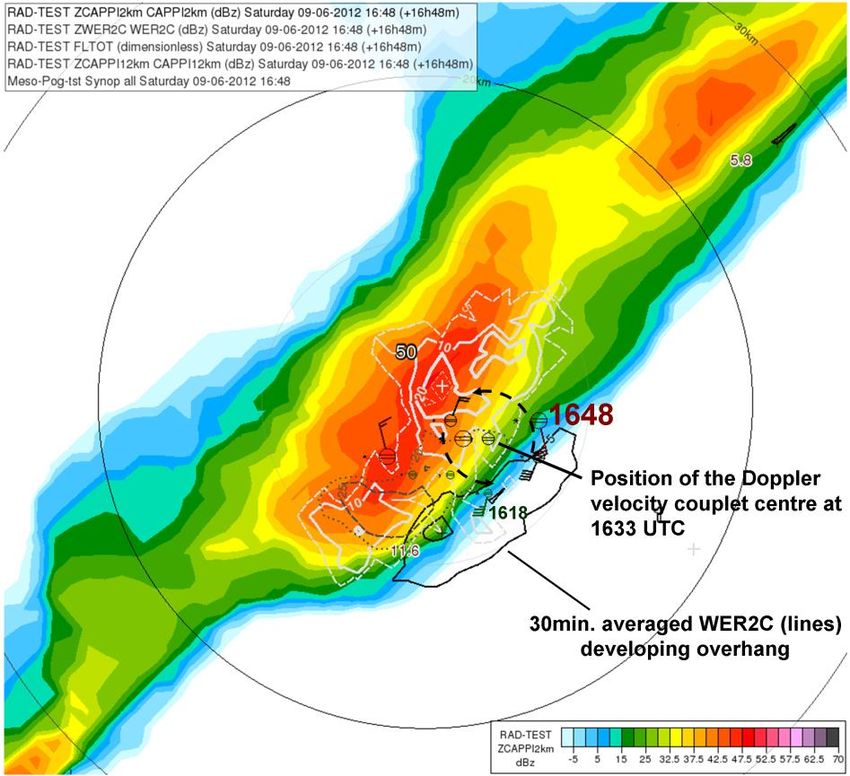
A part of a 2017 year EUMETSAT study: ‘Investigation of MSG SEVIRI and EPS IASI
             derived atmospheric instability in relation of other observations’

                 Motivation: MTG - Lightning Imager

We posed the following questions:

• How much are the lightning characteristics related to other severe storm
  features on radar and satellite imagery?
   • Is there any correlation between the radar, satellite parameters, features and
      lightning rate or density?

Are the observed lightning characteristics pre-cursors of severe weather?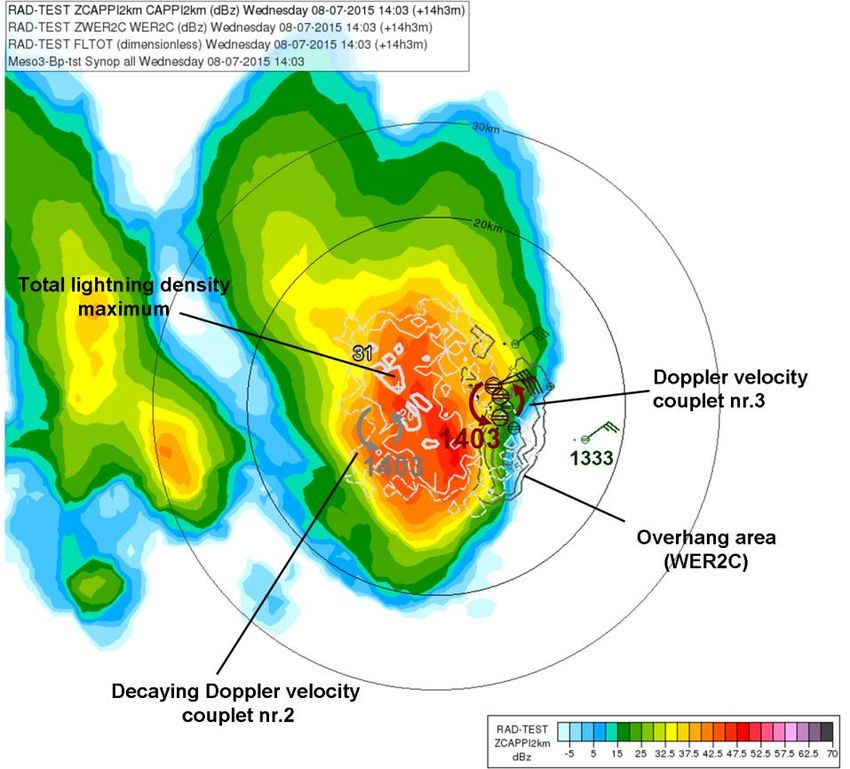
Outlines

Introduction
Five case studies
    Supercell, hailstorm (09 June 2012)
    Hybrid multicell-supercell storm, windstorm (08 July 2015)
    Tornadic storm (16 August 2010)
    Multicell storm and flashflood (31 July 2016)
    Single cell, short-lived local thunderstorm (23 July 2016)
Summary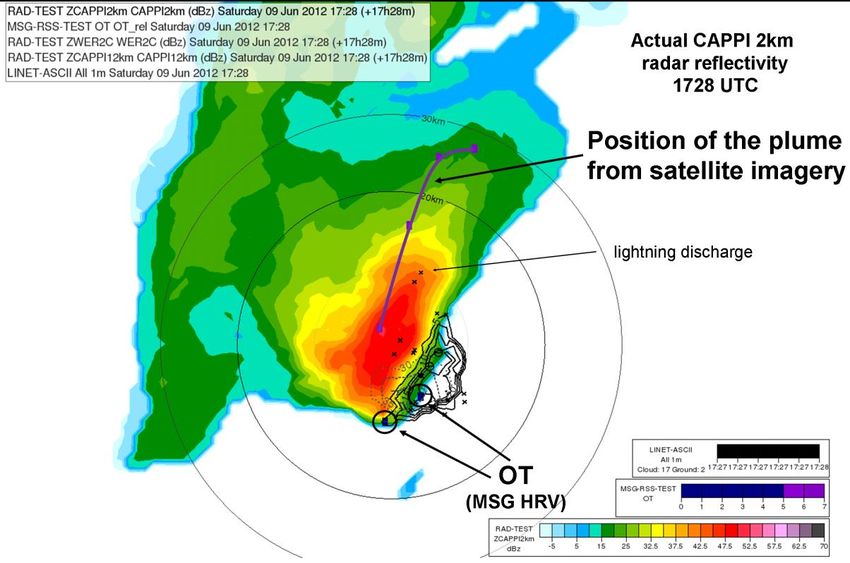
5 cases of different kinds of storms developed in the Carpathian Basin
Synoptic situation
Environment
Radiosonde, NWP, GII, IASI
Development of the storms
Storm tracking temporal courses of satellite, radar,
lightning parameters + features and severe weather reports
Spatial distribution of the lightning density within the storm
structure (ECSS poster – Simon et al., 2017)
Satellite - METEOSAT SEVIRI RSS (5 minute data)
Lightning – data of LINET network
Hungarian radar system - Three/four Doppler dual-polarization DWSR radars
• 5 minute reflectivity data
• 15 minute Doppler wind measurement
Severe weather reports from ESWDB or from surface measurements – no hail pad data
NWP, GII, IASI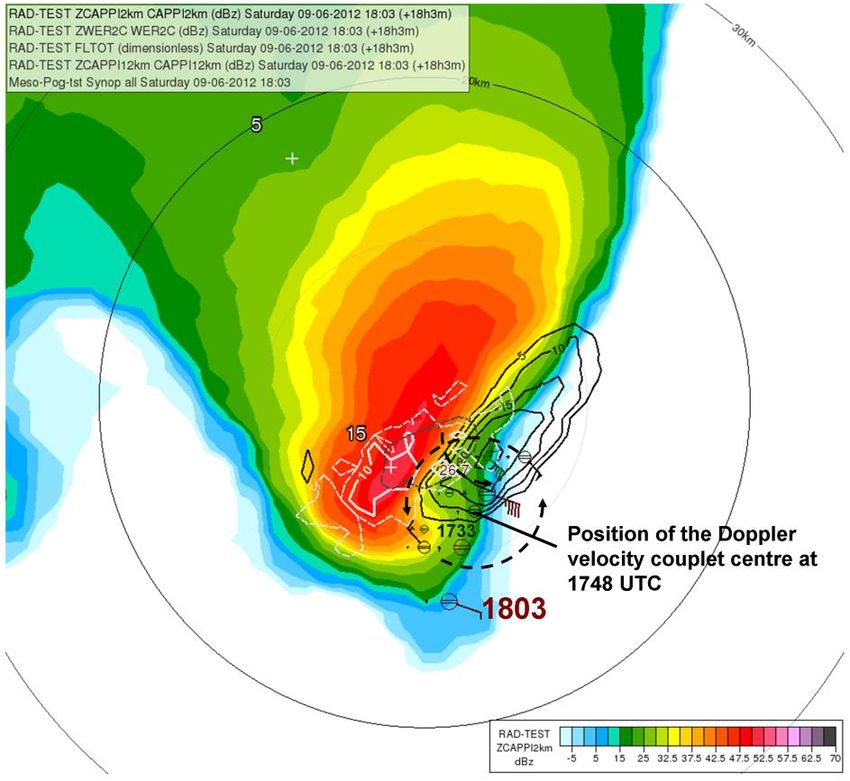
Outlines

Introduction
Five case studies
    Supercell, hailstorm (09 June 2012)
    Hybrid multicell-supercell storm, windstorm (08 July 2015)
    Tornadic storm (16 August 2010)
    Multicell storm and flashflood (31 July 2016)
    Single cell, short-lived local thunderstorm (23 July 2016)
Summary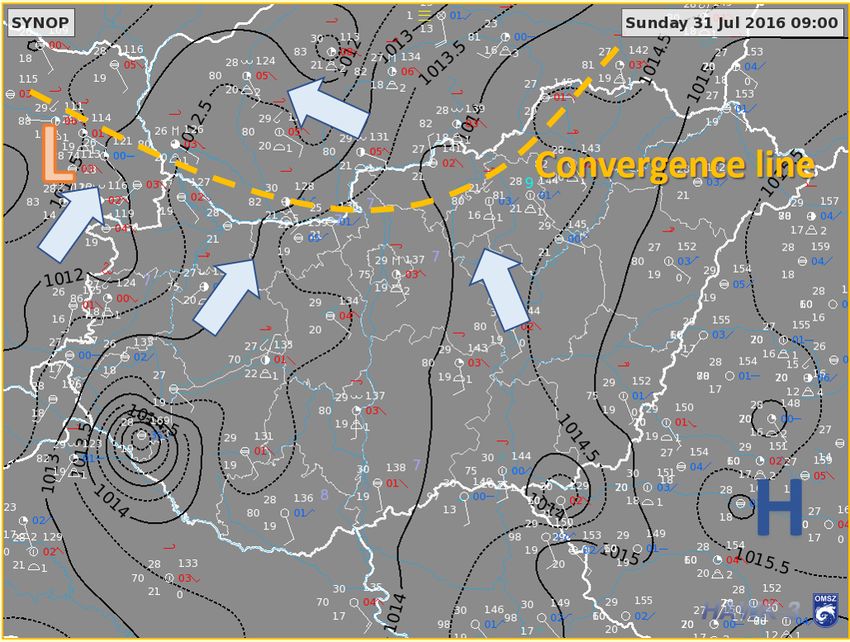
What happened?
  The storm (classic or HP supercell) passed over southern
  Hungary (16-21 UTC), causing large hail (3-6 cm) at many
  places.

Synoptic situation
The studied convective system
developed at a wavy front.

 Photo: Zoltán Goda

View of the cell from East, at the city of Baja (~19:00 UTC)

  Environment at the southern part of Hungary
    Moist atmosphere, Moderate instability
          Strong 0-6 km wind shear
                                                               Storm track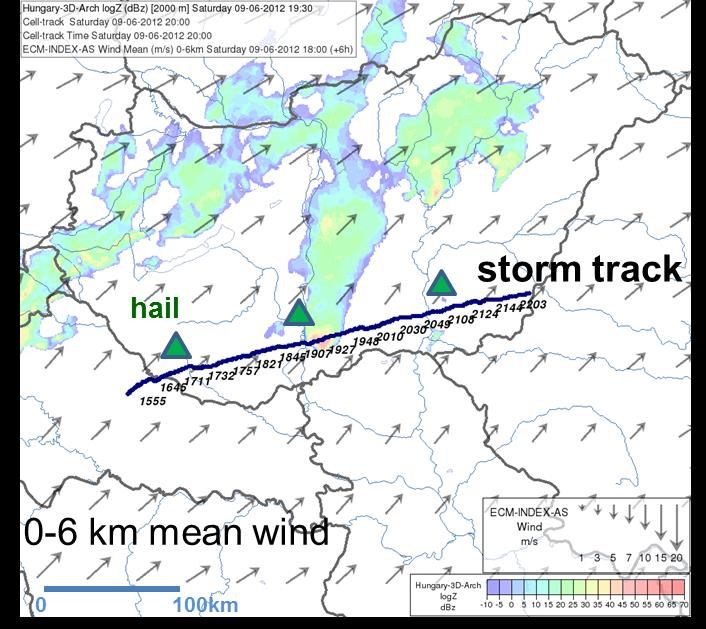
5 hour lightning
        Storm development
       Severe storm features

Lightning features indicating possible
severity:
• ‘Lightning jump’ - sudden increase of
   the number of strokes
• High stroke frequency (up to 80
   strokes/minute)
• Right mover                                                                      Right-moving

             Lightning strokes (total) belonging to the studied radar cell

                                                    Number of Total strokes / 1 minute
                                                         Lightning stroke rate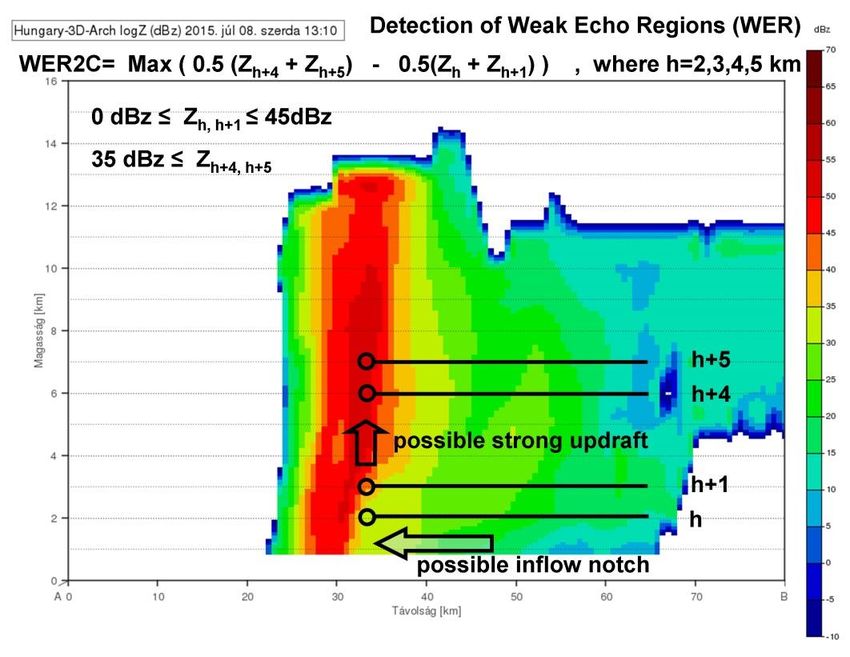
Satellite cloud top features indicating possible severity of the storm SEVIRI (RSS)
High cooling rate
(seen only when it overrun the anvil –3,9 K/5 minute in the first 5 minute period)
Right mover
Extreme cold overshooting tops (OT) (down to -66.3 C)
After ~16:20 UTC big elevated dome with complex structure – with long life time
Long-lived Cold ring (more than 8 hours)
High difference between the coldest BT10.8 of the ring and the warmest BT10.8 of the warm spot
Over anvil ice-plume
Small ice crystals on the cloud top (Day Microphysics and Severe Storms RGBs, Re)
HRV/IR10.8 blended images 16:03,16:25, 17:33 UTC16:33 UTC
Radar features indicating possible severity of the storm
Doppler wind feature - MVS – indicating rotation (next slide)
Right mover
Long-lived intense radar cell (more than 8 hours)
High reflectivity values (up to 61.5 dBz)
High VIL values (up to 76 kg/m2)
Hook, bow and WER/BWER echoes
RIJ – rear inflow jet
Persistent
Hook echo (2 km CAPPI) 17:40 UTC
RIJ mesocyclone
Bow echo
in 9 km CAPPI
20:15 UTC
WER+BWER echo (vertical cross section) 17:40 UTC
Flanking lineTemporal courses of the satellite, radar and lightning
characteristics and features of the storm (system)
The storm (system) should be tracked –
Tracking is based on radar data: The 2-7 km CAPPI radar reflectivity fields were
averaged and the studied radar cell (group) was tracked in this field.
For this cell along the track
• Separate the lightning strokes belonging to the studied cell (group) and count the
total lightning strokes in 1 minute intervals.
• Collect the radar characteristic (Column Maximum Reflectivity (Cmax), Vertically
Integrated Liquid (VIL), Constant Altitude Plan Position Indicator (CAPPI)) and
features (bow, hook, Weak Echo Regions (WER), Bounded Weak Echo Region
(BWER) echoes)
• Estimate vorticity or convergence from radial Doppler velocity couplets (when
present).
• Collect the satellite characteristic (e.g. TB) and features (OT, ice plume, cold-ring,
when present)
• Collect the severe weather reports, surface measurementsCorrelation between
Lightning rate lightning number and
estimated vorticity.
(Significant peaks in
total lightning rate,
when the mesocyclone
strengthened, both are
likely related to
Estimated vorticity intensification of the
storm’s updraft).
Cold ring formed just
after the lightning jump
at around the time of the
Satellite BT first vorticity maximum.
(Cold ring forms in case
of strong updraft.)
6-10 K
Lightning jump
preceded the hail events.
Later, the number of
total lightning
Events discharges was lower,
though, large hail was
still reported.Spatial distribution of the lightning density within the storm structure
How to characterize the storm structure?
Based (mainly) on radar data
• To map the area of precipitation / (low/mid level downdraft) - 2km CAPPI field is used
• How to map the (likely) area of updraft/mesocyclone?
From satellite images – locations of overshooting tops (OT) –
upper part of the updraft (at the cloud top level)
From radar data –
• High (convective echo) at ~12 km CAPPI area
• ‘Mesocyclonic Vortex Signature’ in the Doppler velocity measurement, if present (mid-level info)
• WER/BWER echo region – likely location of mid-level updraft/mesocyclone. A so called WER
parameter was defined to find the area of WER echoes (next slide).
OT
mature cell CAPPI levels
CAPPI maxima 12km
Cell center 9km
Új cella
In case of strong windshear 6km
the storm, its updraft and the radar 3km
CAPPI maxima are tilted in the
direction of the windshear mesocyclone
CmaxA parameter to find area of WER/BWER echo region - to highlight the areas where the
radar reflectivity increases with height, which is typical for the updraft region
Vertical gradient of radar reflectivityWER2c --- parameter helps to find WER/BWER echos
• 2 km CAPPI image - colour shades
• 6 km CAPPI isolines – coloured isolines
• WER2 parameter – grey isolines
Vertical cross-section along the AB solid black line
Example
Usefulness of WER2 parameter:
BWER echo in the vertical cross section
across the area of high WER2c parameterExample – storm structure visualisation using radar and satellite data
• Precipitation/downdraft region - 2km CAPPI - colours
• Updraft region
o WER2c parameters – black isolines
o 12 km CAPPI – dotted isolines
o OTs (upper part of the updraft) from parallax shifted satellite data
• Ice plume from parallax shifted satellite data HRV/IR10.8 blended image
• Lightning data 17:28 UTC
Ice plume
Overshooting top
Combination of radar, lightning and (parallax-corrected) satellite data. Well defined cold ring was present on
The location of the ice plume’s source was over the centre of the storm, the cloud top during several hours. Ice
later it moved downstream (toward North-Northeast). plume was also definite.Spatial distribution of lightning density within the storm structure
To calculate spatial distribution of lightning density we need longer time intervals (~30 min)
Convert everything into a storm-relative coordinate system
(to make easier temporal summation and averaging)
Choose interesting time intervals based on the lightning stroke rate temporal course
Calculate the
• lightning density distribution
• averaged 2/12km CAPPI and WER2c parameter field to map the downdraft and
updraft region in these time intervals30 min. averaged 2km CAPPI radar reflectivity (color shades) (in a storm relative coordinate system)
Period 1: Period 2:
1618-1648 UTC 1733-1803 UTC
(1st lightning rate maximum) (2nd lightning rate maximum)
Total lightning density
(nr. of lightning / km2)
Total lightning density
maximum
High WER - well
developed overhang
12 km CAPPI maximum
(probably the main updraft 12 km CAPPI maximum
region)
The highest lightning density is mostly in the low-level reflectivity core,
somewhat dislocated from the main updraft position.
Much less lightning was detected in the overhang area.Outlines
Introduction
Five case studies
Supercell, hailstorm (09 June 2012)
Hybrid multicell-supercell storm, windstorm (08 July 2015)
Tornadic storm (16 August 2010)
Multicell storm and flashflood (31 July 2016)
Single cell, short-lived local thunderstorm (23 July 2016)
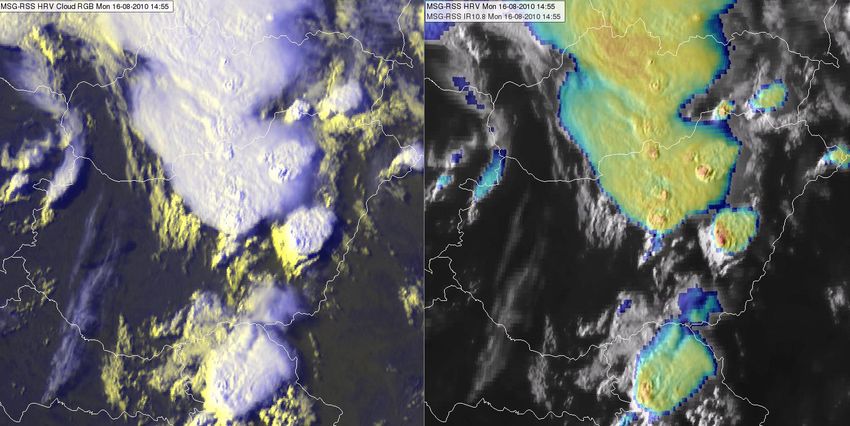
SummaryA hybrid multicell-supercell storm, windstorm
08 July 2015
Pre-frontal
The thunderstorm developed ahead of a
Cold front convergence line
propagating cold front and moved along a
pre-frontal convergence line.
It caused severe wind along its track (up to
35 m/s) + hail.
Budapest
Photo: Laczkó Zsuzsanna radar
Wind damage
The storm in its mature phase, west of Budapest.
Environment: Moderate-to-high wind shear, Pogányvár
radar
high humidity, moderate instability. Storm trackHybrid supercell/multicell characteristics
V-shape (V-notch) in radar reflectivity
typical feature of some supercells
Doppler velocity couplets
Several mesocyclones formed
1303 UTC Frequent mergers with neighbouring cells
V-shape of reflectivity CMAX 1320 UTC
radar
CMAX 1305 UTC
nr2 original cell
nr1
Doppler velocity
couplets (min./max.)
PPI 1° radial Doppler velocity measurement
2 km CAPPI radar reflectivity isolines250
08.07.2015. windstorm Comparison of the
High lightning rate lightning rate to the
Number of Total strokes / 1 minute
previous case
200
150
Number of strokes/min
Lightning
jump 09.06.2012. hailstorm
100
50
0
11:00 11:30 12:00 12:30 13:00 13:30 14:00 14:30 15:00 15:30 16:00•Increase in lightning Storm tracking temporal courses rate is observed, when Lightning nr./1min. High lightning rate the rotation intensifies. (in periods of mesocyclone intensification). •First lightning maximum appeared Estimated vorticity before first reports on Several cells severe wind gusts (>25 m/s) and hail. •There is a remarkable drop of BT10.8 (6-16 K/15min) in the early phase of the storm. BT 10.8 •The 1st lightning occurred 20 min. after the cloud was detected, already in the 9-15K developing phase. •Cold ring formed just after the first steep increase of lightning events rate and the first vorticity maximum.
Storm structure
 We studied 30 min. periods,
  interesting from the storm
 electrification point of view

                              Period 0:                                               Period 1:
                           1208-1238 UTC                                           1238-1308 UTC
Low-level                  (mesocyclone formation)                                 (V-notch shape)
(2km) CAPPI
radar-reflectivity           Total (IC+CG) lightning density
                                           (nr. of lightning / km2)

                                                                                       average WER2C
                                                                                      (overhang region)

 12 km CAPPI                                                     12 km CAPPI
maximum (weak)                                                     maximum

Absence of overhang, low reflectivity at               The maximum lightning density is somewhat to
upper levels (12km), lightning density                 the north of the expected main updraft(s) and
increasing                                             west of the overhang
Typical features
(found in several severe storms)
Period 2:
13:33-14:03 UTC
(max. lightning rate)
• High lightning density (many CGs)
is coupled with high low-level radar
reflectivity (hail, heavy rain, etc.) –
this could help to specify the core of
the storm on satellite imagery
• Much less lightning can be found in
the overhang area (WER) and centre
of the mesocyclonic circulation
• The highest lightning density can be
found somewhat off the main
updraft, mainly in the later stages of
The cell exhibited intense lightning activity,
when also high WER2c and strong cyclonic the storm
shear (circulation) were foundOutlines
Introduction
Five case studies
Supercell, hailstorm (09 June 2012)
Hybrid multicell-supercell storm, windstorm (08 July 2015)
Tornadic storm (16 August 2010)
Multicell storm and flashflood (31 July 2016)
Single cell, short-lived local thunderstorm (23 July 2016)
SummaryTornadic storm, 16 August 2010
This day several convective systems formed over Hungary. One produced an F2 tornado.
The studied supercell initiated ahead of a
cold front. Later it merged with the
convective cloudiness of the front.
Cold front
Storm trackEnvironment ECMWF forecast for 15 UTC
MLCAPE (in J/kg) and wind at 925 hPa,
Convergence line
Moderate to high instability and humidity
0-6 km wind shear Supercell Composite Parameter
Very high deep-layer wind shear - primary reason for the severity of the stormsStorm development
15:15 UTC
Severe storm features
Tornado - observed
Hook echo in 2 km CAPPI
around the time when the
tornado was observed
Cold front
HRV Cloud RGB and
HRV/IR10.8 blended images.
The cold ring formed at
around 14:55 UTC.
14:55 UTC250 Comparison of the lightning
08.07.2015. windstorm rate to the previous cases
Number of Total strokes / 1 minute
The total lightning rate was
200 rather low before the supercell
merged with the front.
Not the frontal, electrically more
active storms were accompanied
150
by the most spectacular weather
phenomena.
Number of strokes/min
100 09.06.2012. hailstorm
16.08.2010. tornadic storm
50
50 Merger with cold
Number of total
40 front
strokes/min
30
Tornado
20
10
0 0
11:00 11:30 12:00 12:30 13:00 13:30 14:00 14:30 15:00 15:30 16:00
14:00 14:30 15:00 15:30 16:00 16:30 17:0050 Merger with cold
The total lightning rate was
Number of total strokes/min
45
front
rather low before the 40
Tornado
35
supercell merged with the 30 occurrence
front. - In severe storms 25
20
this can be sometimes 15
caused by microphysical 10
5
processes (e.g. wet-hail 0
growth). 14:00 14:30 15:00 15:30 16:00 16:30 17:00
16
Couplets vorticity (10-3 s-1)
14
The time period of the 12 The first point might
vorticity maximum is 10 be underestimated
8
uncertain. 6
4
2
The vorticity maximum 0
either coincides or precedes 14:00 14:15 14:30 14:45 15:00 15:15 15:30 15:45 16:00 16:15 16:30 16:45 17:00
the total lightning rate 0
6-10 K
-10 min BT10.8
maximum. max BT of warm spot
-20
BT10.8 [C]
-30
The cold ring formed -40
earlier or at about the same -50
-60
time as the vorticity
-70
maximum. 14:00 14:30 15:00 15:30 16:00 16:30 17:00
The cold ring formed
around the time when the
14:00 14:30 15:00 15:30 16:00 16:30 17:00
tornado was observed. hook echo tornado heavy rain developing cold ring Cold ring50
Number of total
40
strokes/min
Lightning density distribution 30
within the storm structure 20
10
0
14:00 14:30 15:00 15:30 16:00 16:30 17:00
Well-pronounced hook-echo and WER-echo region
The highest lightning density is in the western
flank of the storm, somewhat shifted compared
to the areas of maximum radar reflectivity.
Not many lightning strokes
→ lightning density
distribution might be less
accurate.
Averaged 2 km CAPPI radar reflectivity (colour shades)
Averaged WER2c parameter (solid, dark lines)
Total lightning density (solid, light lines)
for the period 15:00-15:30 UTC (tornado occurrence)Outlines
Introduction
Five case studies
Supercell, hailstorm (09 June 2012)
Hybrid multicell-supercell storm, windstorm (08 July 2015)
Tornadic storm (16 August 2010)
Multicell storm and flashflood (31 July 2016)
Single cell, short-lived local thunderstorm (23 July 2016)
SummaryMulticell storm and flashflood
31 July 2016
What happened?
A flash flood was reported in Komárom (H) and Komárno (SK).
Highest measured 24-h precipitation was 79 mm. 47 mm was reported within 1 h.
There was also 3-4 cm hail and damage due to wind.
The convective system developed along a convergence line ahead a cold front.
The propagation of the system was
very slow during about 3 hours. At
about the same location several cells
Slovak Republic
initiated, developed and dissipated.
Flash flood
Hungary Budapest
radar
Mesoscale analysis, 31 July 2016, 09 UTC 0 50kmEnvironment Ingredients, which resulted in a flash flood:
Slow propagation
TPW
ECMWF forecast 09 UTC Quasi-stationary convergence: It was important to
trigger new updrafts and also to maintain the convection over nearly
MLCAPE the same territory.
Locally large CAPE (forecasted MUCAPE 1500-2000 J/kg)
Lot of low-level moisture (TPW)
Convective Inhibition (CIN) around: To inhibit other
clouds to grow and share/destroy the potential energy sources.
Total Precipitable Water (mm) from IASI profiles:
Mikor?
MLCIN
high TPW
Weak 0-6 km wind shear
+ convergence line High TPW on the SW flank of the cell (possible inflow area)MODIS VIS0.6465 11:25 UTC Storm development
Courtesy of Cyril Siman (SHMÚ)
OT OT
Photo of the storm 90 km from Northwest
at around 1130 UTC
11:33 UTC
The multicell system developed along the
convergence line.
Mid-level convergence was observed also by
the Doppler radar velocity measurements
The arrow shows the location of the radarFeatures indicating possible severity
SEVIRI 11:23 UTC
Unusually high lightning rate and the lightning
density (comparable with the other cases).
long lived cold ring
The thin cirrus arch cloudiness (induced
maybe by gravity waves in the stratosphere)
spread from the OT position. Likely related to
sudden strengthening of the updraft.
Photo taken around 11:55 UTC by Miroslav Šinger (SHMÚ)
At the time of the lightning rate and the convergence
intensity maxima (see later)250
08.07.2015. windstorm Comparison of the
lightning rate to the
Number of Total strokes / 1 minute
previous cases
200
Very high lightning rate
Sudden increase of lightning rate
150 150
31.07.2016. multicell system
Number of strokes/min
100 09.06.2012. hailstorm 100
Number of strokes/min
50 50
0 0
11:00 11:30 12:00 12:30 13:00 13:30 14:00 14:30 15:00 15:30 16:00 10:00 10:15 10:30 10:45 11:00 11:15 11:30 11:45 12:00 12:15 12:30 12:45 13:00•The lightning activity period 150
Number of strokes/min
started already in the developing
phase of the storm before its top 100
reached the tropopause.
50
•Between 11:00-11:10 UTC there
was a sudden increase in total 0
10:00 10:15 10:30 10:45 11:00 11:15 11:30 11:45 12:00 12:15 12:30 12:45 13:00
lightning rate likely due to strong
14
updraft
Convergence (-divV) [10-3*s-1]
12 convergence
10
•Cold ring formed at just after the 8
6
strengthening of lightning rate and 4
convergence, likely due to strong 2
updraft. 0
10:00 10:15 10:30 10:45 11:00 11:15 11:30 11:45 12:00 12:15 12:30 12:45 13:00
0 Time [UTC]
•The maximum of the total -10 min BT
3-12 K
max BT of warm spot
lightning rate coincided with the -20
BT10.8 [C]
2nd cell development and the higher -30
(second) maximum of the -40
convergence. -50
-60
•The 1st intense lightning activity -70
10:00 10:30 11:00 11:30 12:00 12:30 13:00
preceded the heavy rain and (more
or less) coincided with hail reports.
10:00 10:15 10:30 10:45 11:00 11:15 11:30 11:45 12:00 12:15 12:30 12:45 13:00
Three major cells evolved and decayed
during the severe weather period. cell1 cell2 cell3 Cold ring hail150
Number of strokes/min
The first lightning rate
increase was possibly related 100
to appearance of large hail
50
(increase in Colum maximum
radar reflectivity areal sum
0
after 10:45 UTC). 10:00 10:15 10:30 10:45 11:00 11:15 11:30 11:45 12:00 12:15 12:30 12:45 13:00
14
Convergence (-divV) [10-3*s-1]
12
The later lightning rate 10
8
maximum correlated with mid-
6
level convergence (strong 4
updraft). 2
0
10:00 10:15 10:30 10:45 11:00 11:15 11:30 11:45 12:00 12:15 12:30 12:45 13:00
At the time of the maximum Time [UTC]
lightning activity, there were Many graupels
no echoes exceeding 55 dBz, but absence of
although there was a peak of large hail?
reflectivity higher than 45
dBz.
This suggests that the charge
was produced in
environment with (many)
graupels or small hail but
less (or absent) large hail.
10:00 10:15 10:30 10:45 11:00 11:15 11:30 11:45 12:00 12:15 12:30 12:45 13:00
cell1 cell2 cell3 Cold ring hailThe highest lightning density
(exceeding 50 lightning/km2)
among the studied cases.
30 min. averaged 2km CAPPI radar reflectivity in a relative coordinate system, following the storm
Period 1: Period 2:
1045-1115 UTC 1145-1215 UTC
(lightning rate increase, (maximum lightning rate)
hail reported )
high lightning density
12:18UTC
11:18UTC
Max. 12 km convergence at the high lightning density
CAPPI SW flank of the storm
convergence at the at 12:03 UTC
SW flank of the storm WER area (storm tilted to SW)
(11:03 UTC, 2.5 km height)
The lightning density is collocated with the precipitation area.
We could not map the updraft region: 1) No rotation, 2) Location of OT were hard to observed on satellite
imagery, 3) High level CAPPI was not strong, 4) There is no stable, strong WER area, no strong vertical
gradient of radar raflectivity.Outlines
Introduction
Five case studies
Supercell, hailstorm (09 June 2012)
Hybrid multicell-supercell storm, windstorm (08 July 2015)
Tornadic storm (16 August 2010)
Multicell storm and flashflood (31 July 2016)
Single cell, short-lived local thunderstorm (23 July 2016)
SummaryShort-lived, local thunderstorm at Balaton
23 July 2015
IASI – Maximum Buoyancy (0841 UTC)
Synoptic situation
The studied thunderstorm formed in a warm
pre-frontal airmass.
Environment
• Very high TPW (> 30 mm).
• very unstable environment Very unstable and also dry
• dry mid-levels (at mid-levels) air
• no persistent low level convergence
• very low wind shear,
Single thunderstorm with high lightning
activity (two injuries). Rapid development
and dissipation, short lifetime, slow motion
Wind gusts up to 15 m/s250
08.07.2015. windstorm
Comparison of the
Number of Total strokes / 1 minute lightning rate to the
200
previous cases
150
Number of strokes/min
100 09.06.2012. hailstorm
23.07.2015. single cell
10
stroke/mi
lightning
Number
of total
0
n
12:00 12:30 13:00 13:30 14:00 14:30 15:00
50
50
16.08.2010. tornadic storm
Number of total
40
strokes/min
30
20
10
0 0
11:00 11:30 12:00 12:30 13:00 13:30 14:00 14:30 15:00 15:30 16:00
14:00 14:30 15:00 15:30 16:00 16:30 17:0010
No severe storm Under some conditions,
9
Number of total lightning stroke/min
characteristics (e.g. WER, 8 even such thunderstorms
There was not
Cold ring) in radar or 7
enough strokes to
can be hazardous due to
6
satellite data. 5 calculate lightning sudden and fast
4 density development (high
3
The lightning intensity was instability supports strong
2
sometimes significant but 1 vertical motions).
short-lived and much lower 0
12:00 12:30 13:00 13:30 14:00 14:30 15:00
compared to other 30
IR10.8 brghtness temperature
presented cases. 20
10 min BT10.8
0
The lightning activity
[C]
-10
-20
period started already in -30
the developing phase of the -40
-50
storm. 12:00 12:30 13:00 13:30 14:00 14:30 15:00
60
The lightning rate 50 max Cmax
Max VIL
maximum preceded the 40
Cmax [dBz], VIL [kg]/m2
strong windgust by 5 min. 30
20
The maxima of the 10
lightning stroke rate and 0
12:00 12:30 13:00 13:30 14:00 14:30 15:00
radar reflectivity, and the
minimum of IR10.8 cloud
top temperature roughly 12:00 12:30 13:00 13:30 14:00 14:30 15:00
coincided. heavy rain strong wind gustOutlines
Introduction
Five case studies
Supercell, hailstorm (09 June 2012)
Hybrid multicell-supercell storm, windstorm (08 July 2015)
Tornadic storm (16 August 2010)
Multicell storm and flashflood (31 July 2016)
Single cell, short-lived local thunderstorm (23 July 2016)
SummaryConclusions (based on these 5 cases) • The lightning activity started already in the developing phase of the storms’ life-cycles. • The lightning rate can be high or relatively low in supercells. (Lightning activity depends not only on the updraft strength but on the microphysics as well.) • The lightning rate can be higher in a multicell system than in a supercell. • We found sudden increase in lightning rate in 2 supercell cases and in the multicell case. • The course of lightning rate correlates with the course of vorticity estimated from radial Doppler velocity measurements - in supercell cases with high lightning rates (2 cases). (We found significant peaks in total lightning, when the mesocyclone strengthened, both are likely related to the intensification of the storm’s updraft). • Cold ring formed just after the sudden increase of lightning rate (2 supercell + multicell cases) at around the time of the first vorticity maximum (3 supercell cases). (Cold ring is also related to strong updraft.) • The course of lightning rate showed some correlation with the course of the convergence intensity in the case of the multicell system. Likely common reason is the updraft strengthening
Conclusions cont.

• In periods of lightning intensification we find other characteristics of severe storms: (like
  Doppler velocity signatures, OT-s, cold rings and ice plumes, WER echoes) in the supercell
  cases + multicell case.

• High lightning rates often can be found prior to observed severe weather (hail, windgust,
  heavy rain). (Note, that the time of the severe weather events were often uncertain, for
  example in case of hail, as we worked with ESWDB report (+ high radar VIL data) and not
  with hail pad data.)

• There is no simple relation between lightning rate and hail on the ground. In the later stages
  we can find large hail with relatively low lightning rate and no hail with high lightning rate.

• The lightning density of a supercell is not necessarily higher than in a non supercell severe
  weather. The highest lightning density was found in the multicell system.

• The highest lightning density mostly occurred in high radar reflectivity area at 2 km (heavy
  precipitation/hail). - In supercells, this maximum can be dislocated from the strongest echoes
  at higher (6, 12 km) levels. Much less lightning was detected in the overhang areas with high
  WER2c (3 supercell cases).

                       For more general conclusions - More cases needed
Thank you for your attention!
Acknowledgements
• This study was supported by EUMETSAT, (contract
number: EUM/CO/16/4600001802/KJG). We are
grateful to Jochen Grandell and Thomas August
(EUMETSAT) for the valuable advises and IASI data.
• We thank Nowcast GmbH Munich for providing us
lightning data for the case studies.References Simon, A., Putsay, M., Zsófia Kocsis , Zs. and Ildikó Szenyán, I. (2016): Analysing a convective event (09 June 2012) with satellite, radar and lightning data, Convection Working Group workshop, Florence, Italy, 4-8 April 2016. Betz, H.D., Schmidt, K., Laroche, P., Blanchet, P., Oettinger, W.P., Defer, E., Dziewit, Z., and Konarski, J., 2009: LINET— An international lightning detection network in Europe. Atmos. Res. 91, 564–573. Kaňák, J., Jurašek, M., 2004: Tracking algorithm for Meteosat data as a CEI nowcasting tool. The 2004 EUMETSAT Meteorological Satellite Conference Proceedings. Darmstadt, 360 König, M., Tjemkes, S. A., Kerkmann, J., 2001: Atmospheric Instability Parameters Derived from MSG SEVIRI Observations. 11th Conference on Satellite Meteorology and Oceanography. M. Setvák, D. T. Lindsey, P. Novák, P. K. Wang, M. Radová, J. Kerkmann, L. Grasso, S-H Su, R. M. Rabin, J. Šťástka, Z. Charvát., 2010: Satellite-observed cold-ring-shaped features atop deep convective clouds. Atmos. Res., 97 (2010), 80–96. Wang, P. K., 2007: The thermodynamic structure atop a penetrating convective thunderstorm. Atmos. Res., 83 (2007), 254–262.
Complex case study of a severe storm
Main emphases on remote sensing data : satellite, radar, lightning
Technical information on the applied remote sensing data
Satellite
METEOSAT SEVIRI RSS (5 minute data)
Lightning – data of LINET network - operationally used at OMSZ
European Lightning Detection NETwork (~130 sensors in Europe, 7 sensors in Hungary )
every stroke: time [ms], location, height, type (CC, CG), current amplitude estimation [+/-kA], location uncertainty
It detects at low frequency (very long wave)
It discriminates CC from CG strokes according their heights (software based on high precision time measurement)
(ratio of CC and CG in Hungary ~ 1:1)
Hungarian radar system
Three/four Doppler dual-polarization DWSR radars working
at 5,3 cm wavelength
• 5 minute reflectivity data at 10 elevation angles (0.0, 0.5
,1.1, 1.9 ,3.0 ,4.7, 7.0, 10.0, 14.2, 20), in 240 km radius area
• 15 minute wind measurement in 5 elevation angles (1.1, 1.9,
3.0 ,6.5 ,14.0), in120 km radius area (3 minute shift)
Volume data products with 1x1 km resolution
• For each radar: PPI, CAPPI, Cmax, VIL, ETOPS
+ Hungarian composite images (Cmax, VIL, ETOPS)
• Doppler wind measurementsVorticity or convergence can be estimated from radial Doppler
velocity couplets (when present).
Estimation of couplet’s vorticity, mostly at 2-3 km height (PPI data)You can also read