Covid-19 Social Distancing Interventions by State Mandate and Their Correlation to Mortality
←
→
Page content transcription
If your browser does not render page correctly, please read the page content below
Covid-19 Social Distancing Interventions by State
Mandate and Their Correlation to Mortality
sean mccafferty ( sjmccafferty66@hotmail.com )
University of Arizona
sean ashley
University of Arizona
Research article
Keywords: Covid-19, social intervention, standardized mortality prevalence, mortality rate
DOI: https://doi.org/10.21203/rs.3.rs-30828/v1
License: This work is licensed under a Creative Commons Attribution 4.0 International License.
Read Full License
Page 1/13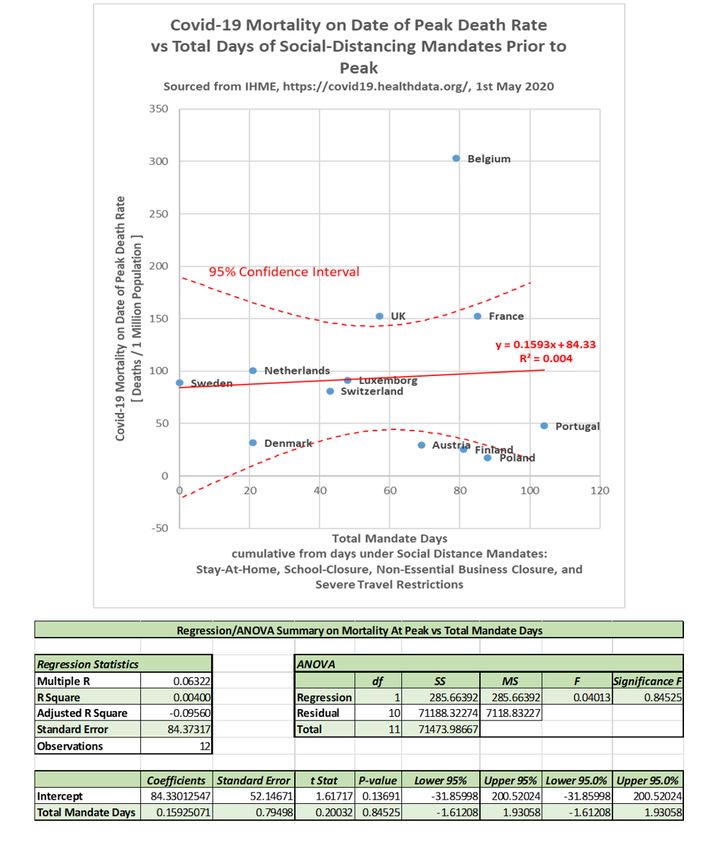
Abstract
Purpose Evaluate the correlation between state mandated social interventions and Covid-19 mortality
Design Prospective design and retrospective analysis of Institute for Health Metrics and Evaluation
(IHME) state data. Methods Twelve European Union countries were selected on April 12, 2020 from IHME
data which had clearly de ned and dated establishment of statewide mandates for social distancing
measures to include: School closures, stay at home orders, severe travel restrictions, and closure of non-
essential businesses. The state Covid-19 mortality prevalence was de ned as total normalized deaths to
the peak daily mortality rate. The state mortality prevalence was correlated to the total number of
mandates-days from their date of establishment to the peak daily mortality date. The slope of the
maximum daily mortality rate was also correlated to mandate-days. Results The slope of standardized
mortality per country did have a slight negative correlation to the total mandate days (R2 = 0.083, p=
0.36), though the negative correlation was not statistically signi cant. The standardized mortality
prevalence to the peak mortality rate per country exhibited no discernable statistical correlation to the
total mandate days (R2 = 0.004,p=0.85). Discussion The analysis appears to suggest a mandate
effective reduction in the slope of the mortality rate, but no effective reduction in Covid-19 mortality to its
de ned initial peak when interpreting the mean-effect of the mandates as present in the data. The study
is presented as a potential methodology to evaluate the effectiveness of state mandated social
distancing policy.

Introduction
Socially mandated distancing policy has been theorized to be effective in reducing the rate of
transmission of contagious diseases.1,2,3 State-wide policy mandating social distancing has been
instituted to varying degrees during the Covid-19 pandemic recognized globally in 2020. The theory of
reducing the rate of contagion transmission by decreasing social interactions has been extended to
possibly reduce the overall mortality by allowing for social/medical mobilization and proper allocation of
resources.3 Little data exists to verify the theoretical model, except analyses demonstrating marginal
social distancing effectiveness in delaying the peak infection5. Due to the pervasive global incidence of
the Covid-19 pandemic and extensive real-time record keeping, it presents an opportunity to evaluate the
social distancing theory over a large population with considerably different social distancing measures
instituted.

Methods
The study was conducted using the Institute for Health Metrics and Evaluation (IHME) openly published
data on Covid-19 infections by sovereign country, to include daily infections/deaths as well as onset and
discontinuation dates of state mandated social interaction interventions. As this was the primary source
of information used for predictive modeling and setting public policy, it was chosen for its accuracy and
regular updates.6

                                                   Page 2/13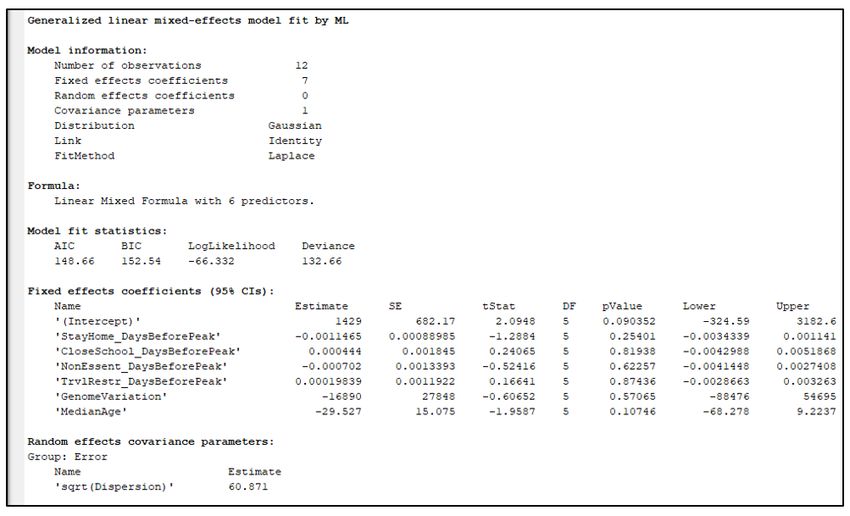
The primary goal was to quantify the decrease in the infection/mortality or decrease in the maximum
infection/mortality rate as a result of de ned state mandated social distancing measures. Mortality was
chosen to de ne endpoint peaks and rates of change over registered infections within a state. Covid-19
registered infections are beset by inaccuracies due to: Inaccurate testing, asymptomatic patients, test
availability, and regional variations in testing criterial. In most developed countries, the cause and time of
death is typically consistently and accurately recorded.

IHME data accessed on April 12, 2020 at 1900 EST was used to preliminarily select more than 10
sovereign states which t into a geographic area of similar genomic constituency and indicated by WHO
to have developed healthcare standards.7 Each of the selected countries was an independent state
which nationally instituted preventive social interaction law on a given date to include one of the four (4)
possible mandates:

  1. Public School Closures
  2. Closure of non-essential businesses
  3. Severe travel restrictions
  4. Stay at home order

Countries which did not meet all of these criteria in the IHME data set were excluded from the analysis.
Also, countries which did not maintain their state-wide mandated social distancing through the end of
the examination period (May 1, 2020) were excluded. Twelve western European countries were included
as listed in Table 1. These countries were in close geographically proximity, have a similar genomic
alleles, have established and recognized healthcare systems, and have similar social behaviors.8,9,10 All
states mandated social distancing universally across their respective country of the 4 variations listed
above on a speci c date provided by the IHME data set accessed on April 12, 2020 and maintained them
through their peak infection rate.

De ned endpoints for the analysis included the date of the initial peak mortality in deaths per day. A
state’s peak mortality was de ned as the highest recorded daily deaths over a seven day moving average
which was followed by a seven or more day decline in mortality with no other discernable peaks using
these criteria. The dates of maximum mortality for all 12 countries were identi able by the design criteria
on the IHME data set accessed on May 1, 2020 at 2030 EST. (Table 1).7 The IHME data set was re-
examined on May 15, 2020 to insure no secondary mortality rate peaks were noted and the rate was in a
continued decline.7 The maximum daily mortality rate or peak infection rate was used an easily de ned
and universal endpoint in any infectious disease progression to examine the total viral mortality up to the
maximum mortality rate.

Additionally, the maximum slope of the Covid-19 mortality was determined by evaluating the maximum
of the derivative of the infection curve. Speci cally, this slope was de ned as the total recorded mortality
 ve days after the maximum daily mortality rate minus the total recorded mortality ve days before the

                                                  Page 3/13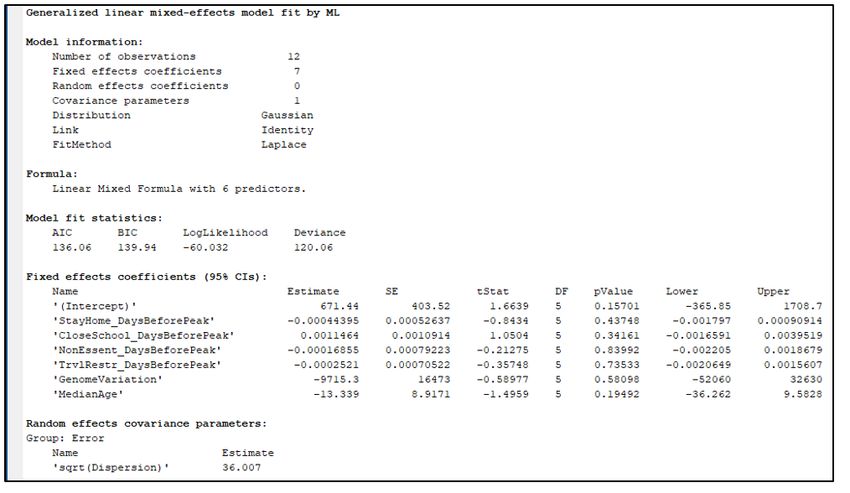
maximum daily mortality rate divided by the 10 day interval. Both the total mortality and maximum
mortality rate were normalized by dividing by the population of the selected state.

Equation 1 – Formula on how the estimate for the maximum mortality rate was calculated from the
Covid-19 mortality data from IHME.

All data was analyzed with Matlab14 and Microsoft Excel software to determine correlation coe cients
and probabilities. General linear mixed effects (GLME) was used to examine combined effects of the
multiple variables.

The study was conducted within the ethical principles contained in Declaration of Helsinki, Code of
Federal Regulations (CRF), Obligations of Clinical Investigators (21 CFR 812). All data was public and
anonymous so no IRB was needed.

We conducted two high-level bivariate studies of this data: the rst being the peak daily death rate (same
as maximum mortality rate) against the total mandate days, and the second being the mortality on the
peak date against the total mandate days. Each mandate, if implemented, was implemented some
number of days before the peak. The total mandate days is the simple summation of these number of
days from all four social mandate categories. For example, Belgium implemented stay-at-home orders 25
days prior to it peaks, school-closures 29 days prior to its peak, non-essential business closures 25 days
prior to its peak, and did not implement travel restrictions, resulting in 79 total mandate days.

Equation 2 – Formula on how the Total Mandate Days are calculated from individual mandates and the
number of days prior to the peak daily death rate that the mandates were implemented.

Then, we conducted two multi-variate studies of this data. The multivariate studies use the same
response variables as in the univariate data: peak mortality rate and mortality at peak. The multivariate
studies will then consider the effects of each mandate independently as well as incorporate genomic
variation and median age in each country’s population.

Equation 3 – Peak mortality rate model studied in the multivariate analysis.

                                                 Page 4/13
Equation 4 – Mortality at peak model studied in the multivariate analysis.
These models were then regressed onto the IHME data.
Results
Results From Bivariate Analysis
Twelve similar western European sovereign states were pre-selected April 12, 2020 to examine their
collective correlation between standardized mortality and total mandate-days of state directed social
distancing directives. All states maintained social distancing directives through the study endpoint on
May 1, 2020.7 States were found to have a signi cant diversity in total mandated intervention over time
(mean = 58 total-mandate-days, std-dev = 30.6 total-mandate-days). The total population studied was
298 million. All states had statistically similar age distributions (mean = 41.8 years-old, std-dev = 1.23
years-old).
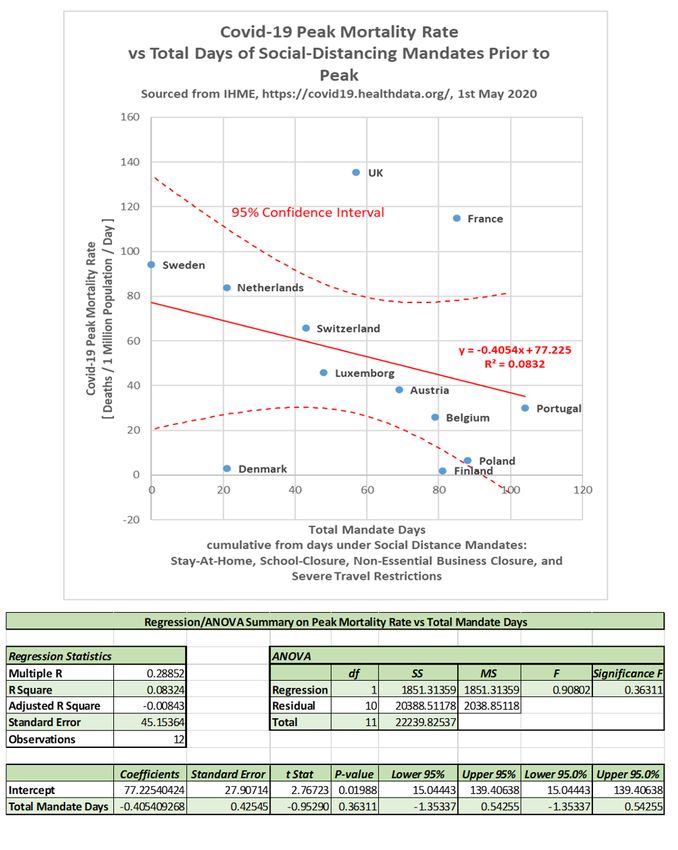
The slope standardized mortality per country did have a slight negative correlation to the total mandate
days (R2 = 0.083, p=0.36), though the negative correlation was not statistically signi cant at the 5% level.
The bivariate data as well as regression results are shown in Figure 1 in the form of a scatter-plot and
table.
Page 5/13The standardized mortality to the peak per country exhibited no statistical correlation to the total
mandate days (R2 = 0.004, p=0.85). The bivariate data as well as regression results are shown in Figure
2 in the form of a scatter-plot and table.
Results From Multivariate Analysis
In the multivariate analysis, a regression analysis on the data from Table 1 was tted onto models
presented in Equation 3 and Equation 4. The results are presented as MATLAB console outputs in Figure
3 and Figure 4 for each of the two response variables, respectively. The key outputs are in the “Fixed
effects coe cients (95% Cis):” section of the console output. The rows in this section correspond to each
xed-effect factor in the model. The “Estimate” column lists the nominal estimate for the coe cient
corresponding to the xed-effect. For example, the estimate for the ‘StayHome_DaysBeforePeak’ factor in
the peak mortality rate model (Equation 3, Figure 3) reports a value of -0.000443 in units of deaths per 1
million population per day per day of mandated stay-at-home orders. This is an estimate for the
coe cient . This corresponds to about a reduction in the peak daily death rate by 444 deaths per 1 trillion
population per day for each additional day of stay-at-home mandates. The “pValue” column lists each of
the calculated p-values associated with each coe cient estimation under the null-hypothesis that the true
coe cient value is zero. From Figure 3, we nd the ‘StayHome_DaysBeforePeak’ coe cient has a
corresponding p-value of 0.43748. Meaning, there is not enough evidence from the data as analyzed to
claim additional stay-at-home mandate days have a statistically signi cant effect on a state’s peak covid-
19 daily mortality rate at a signi cance level any lower than 43.748% (typical signi cance levels being
5%).
Table 2 collects the coe cient estimates and associated p-values from both GLME regressions.
In Table 2 there is no coe cient with a p-value that is smaller than 0.09. This would mean that at a
typical 5% signi cance level, none of these values would be statistically signi cantly different from zero.
This indicates that implementation date of social-distancing mandates (along with population genome
variation and median age) do not su ciently explain the country-to-country variation in covid-19
mortality and mortality rates. However, in spite of the large p-values, some interesting trends can be
drawn from the comparison in the mean trends between peak mortality rate and total mortality on date of
peak death rate versus the days of implementing social-distancing mandates prior to the peak.
Discussion
The analysis appears to show no statistically signi cant reduction in neither the slope of the Covid-19
mortality rate (p-val = 0.8452) nor in Covid-19 mortality (p-val = 0.3631) to its de ned initial infection
peak. However, the mean-effect of social-distancing mandates on the slope of the mortality rate was
larger than the mean-effect on the mortality of Covid-19 in these twelve European countries. Interpreting
this mean-effects alone could hypothesize that early social-distancing mandates may have a modest-
Page 6/13effect in reducing the maximum increase in rate of infection or ‘ attening’ the rate of infection but does
not demonstrate an effect on the Covid-19 mortality itself.
Several factors in uence the effectiveness of social distancing interventions. These include the basic
reproduction number (R0) of the virus, the mortality rate, and the individual isolation effectiveness of the
mandated interventions.11,12 The ‘ attening’ or reduction of the slope of the maximum infection rate with
no change in total viral mortality is consistent with mathematical theory of viral infections.13 The theory
can be summarized as: “Assuming a xed population without novel medical interventions, atten the rate
of infection is possible delaying the infection the peak infection”. Theorized reductions in total mortality
due to a reduced burden on a healthcare system or advancements in medical care did not materialize in
this analysis. However, the time from the probable rst infection to the peak of the infection rate was
likely only around 3 months. It is possible that if the viral mortality estimated at 0.6% to 1.2% or the viral
reproduction R0, estimated between 2.8 and 3.3, were signi cantly higher, there may have been some
correlation present.11,12 Also, if the interventions had been signi cantly more isolating then the mortality
may have been reduced. Theoretically, the viral infection ceases once the hosts are identi ed and
completely isolated.
The analysis is presented as a potential methodology to evaluate the effectiveness of state mandated
social distancing policy. Western European countries were selected for this study due to their cultural and
healthcare similarities. A possible future study would be to conduct a similar analysis on other clusters
of countries with cultural similarities and variations in strictness of intervention. These methodologies
could be applied to individual states within the United States once the peak infections have been
identi ed.
Abbreviations
FDA- Food and Drug Administration
CFR- Code of Federal Regulations
IHME- Institute of Health Metrics and Evaluation
Declarations
Acknowledgements/Disclosure:
Funding/Support:
No funding
Financial Disclosures:
None
Page 7/13Other Acknowledgements:
Authorization for use of data:
Data made available for download on IHME Websites can be used, shared, modi ed or built upon by non-
commercial users via the Creative Commons Attribution-NonCommercial 4.0 International License.
https://creativecommons.org/licenses/by-nc/4.0/
Authors' contributions:
S.A.- Drafting, analysis, and interpretation
M. – Design, drafting, analysis, and interpretation
Ethics:
This clinical study was conducted in accordance with the ethical principles contained within Declaration
of Helsinki, Protection of Human Volunteers (21 CFR 50), Institutional Review Boards (21 CFR 56), and
Obligations of Clinical Investigators (21 CFR 812).
References
1 Reluga T. Game theory of social distancing in response to an epidemic. PLoS Comput Biol.
2010;6(5):e1000793. doi:10.1371/journal.pcbi.1000793
2 Caley P, Philp D, McCracken K. Quantifying social distancing arising from pandemic in uenza. Journal
of The Royal Society Interface Volume 5, Issue 23 https://doi.org/10.1098/rsif.2007.1197
3 Kelso, J.K., Milne, G.J. & Kelly, H. Simulation suggests that rapid activation of social distancing can
arrest epidemic development due to a novel strain of in uenza. BMC Public Health 2009;9:117
https://doi.org/10.1186/1471-2458-9-117
4 Kissler S, Tedijanto C, Lipsitch M, Grad Y. Social distancing strategies for curbing the COVID-19
epidemic. doi: https://doi.org/10.1101/2020.03.22.20041079
5 Rashid H, Ridda I, King C, Begun M, Tekin H, Wood J, Booy R. Evidence compendium and advice on
social distancing and other related measures for response to an in uenza pandemic. Paediatric
Respiratory Reviews 2015;16:1526-42 https://doi.org/10.1016/j.prrv.2014.01.003.
6 Marsland R, MehtaP. Data-driven modeling reveals a universal dynamic underlying the COVID-19
pandemic under social distancing. arXiv:2004.10666
7 Institute for Health Metrics and Evaluation (IHME) http://www.healthdata.org/covid April 12, 2020,
May 1, 2020, May 15, 2020
Page 8/138 Moskvina V, Smith M, Ivanev D. Genetic Differences Between Five European Populations. Human
Heredity 2010;70:141-49
9 Ralph P, Coop G. The Geographic and Recent Genetic Ancestry Across Europe. PloS Biol 11(5):
e1001555 doi:10.1371/journal.pbio. 1001555
10 Auton A, Abecasis G, Altshuler D, et al. A global reference for human genetic variation. Nature
2015;526:68–74
11 Viceconte G, Petrosillo N. Covid-19 R0: Magic Number or Conundrum? Infect Dis Rep. 2020;12:8616
12 Russel T, Hallewell J, Jarvis C, et al. Estimating the Infection and Case Fatality Ratio (Covid-19)
using Age Adjusted Data from the Outbreak on the Diamond Princess Cruise ship, February 2020. Euro
Survill. 2020;25:pii=2000256
13 Daley G, Gani J. Epidemic Modeling: An Introduction. NY: 2005: Cambridge University Press
14 MATLAB. (2020). Version 9.6.0.1072779 (R2019a). Natick, Massachusetts: The MathWorks Inc.
Tables
Due to technical limitations, the tables are only available as a download in the supplemental les section.
Figures
Page 9/13Figure 1
1A- Maximum slope of the standardized Covid-19 state mortality (peak mortality rate) correlated to days
under state-mandated social distancing directives prior to the peak. 1B- Regression ANOVA
Page 10/13Figure 2
2A- Standardized Covid-19 state mortality on the day of peak mortality rate correlated to days under
state-mandated social distancing directives prior to the peak. 2B- Regression ANOVA
Page 11/13Figure 3
GLME regression results from multivariate analysis on peak mortality rate, the model described by
Equation 3.
Page 12/13Figure 4
GLME regression results from multivariate analysis on mortality on date of peak death rate, the model
described by Equation 4.
Supplementary Files
This is a list of supplementary les associated with this preprint. Click to download.
Table1.PNG
Table2.PNG
Page 13/13You can also read