Investor Presentation - December 2020 - Seeking Alpha
←
→
Page content transcription
If your browser does not render page correctly, please read the page content below

Investor Presentation
December 2020

Forward Looking Information and Non-GAAP Measures
Forward-Looking Information
This document contains “forward-looking information” and statements which reflect the current view with respect to the Company’s expectations regarding future growth, results of operations, performance,
business prospects and opportunities and may not be appropriate for other purposes within the meaning of applicable Canadian securities laws. All such information and statements are made pursuant to safe
harbour provisions contained in applicable securities legislation. The words “anticipates”, “believes”, “budget”, “could”, “estimates”, “expects”, “forecast”, “intends”, “may”, “might”, “plans”, “projects”,
“schedule”, “should”, “targets”, “will”, “would” and similar expressions are often intended to identify forward-looking information, although not all forward-looking information contains these identifying
words. The forward-looking information reflects management’s current beliefs and is based on information currently available to Emera’s management and should not be read as guarantees of future events,
performance or results, and will not necessarily be accurate indications of whether, or the time at which, such events, performance or results will be achieved.
The forward-looking information is based on reasonable assumptions and is subject to risks, uncertainties and other factors that could cause actual results to differ materially from historical results or results
anticipated by the forward-looking information. Factors that could cause results or events to differ from current expectations are discussed in the “Business Overview and Outlook” section of the
Management’s Discussions and Analysis (“MD&A”) and may also include: regulatory risk; operating and maintenance risks; changes in economic conditions; commodity price and availability risk; liquidity and
capital market risk; future dividend growth; timing and costs associated with certain capital investment; the expected impacts on Emera of challenges in the global economy; estimated energy consumption
rates; maintenance of adequate insurance coverage; changes in customer energy usage patterns; developments in technology that could reduce demand for electricity; global climate change; weather;
unanticipated maintenance and other expenditures; system operating and maintenance risk; derivative financial instruments and hedging; interest rate risk; counterparty risk; disruption of fuel supply; country
risks; environmental risks; foreign exchange; regulatory and government decisions, including changes to environmental, financial reporting and tax legislation; risks associated with pension plan performance
and funding requirements; loss of service area; risk of failure of information technology infrastructure and cybersecurity risks; uncertainties associated with infectious diseases, pandemics and similar public
health threats, such as the COVID-19 novel coronavirus (“COVID-19”) pandemic; market energy sales prices; labour relations; and availability of labour and management resources.
Readers are cautioned not to place undue reliance on forward-looking information as actual results could differ materially from the plans, expectations, estimates or intentions and statements expressed in the
forward-looking information. All forward-looking information in this MD&A is qualified in its entirety by the above cautionary statements and, except as required by law, Emera undertakes no obligation to
revise or update any forward-looking information as a result of new information, future events or otherwise.
Nothing in this document should be construed as an offer or sale of securities of Emera or any other person.

Non-GAAP Measures
Emera uses financial measures that do not have standardized meaning under USGAAP and may not be comparable to similar measures presented by other entities. Emera calculates the non-GAAP measures by
adjusting certain GAAP measures for specific items the Company believes are significant, but not reflective of underlying operations in the period. Refer to the Non-GAAP Financial Measures section of our
MD&A for further discussion of these items.

  2

Emera at a Glance
                                                                   ▪ EMERA
                                                                                                  Predominately regulated portfolio
                                                                   NEWFOUNDLAND
                                           ▪ EMERA NEW
                                             BRUNSWICK
                                                                   & LABRADOR                     of electric and natural gas utilities,
                                                             ▪ EMERA INC
                                                             ▪ NOVA SCOTIA POWER
                                                             ▪ EMERA ENERGY
                                                                                                   natural gas pipelines and energy
                                                                                                  marketing and trading serving 2.5
                                                                                                    million customers across North
                                                                                                      America and the Caribbean

    ▪ NEW MEXICO GAS
                                                                                                   $   32B                  $   6.1B
                                                                                                       Assets               Revenues
                       ▪ TAMPA ELECTRIC
                           ▪ PEOPLES GAS           ▪ GRAND BAHAMA POWER

                                                                                                       65%                  7.4K
                                                                                                    US earnings             Employees
                                                          ▪ DOMINICA ELECTRICITY SERVICES

                                                                      ▪ BARBADOS LIGHT & POWER
3                                                                                                 As at December 31, 2019
Investor Highlights

                        $7.4B to                             4% to 5%                  7.5% to
                                                              Dividend growth
                         $8.6B                               guidance through to       8.5%
              Capital program from                                  2022               Rate base growth
                       2021 to 2023                                                    from 2021 to 2023

    95%                                   65%+                               ~11%
    of earnings from                      adjusted earnings from             ten-year TSR1, outperforming
    regulated utilities                   the US                             the TSX Composite and
                                                                             Capped Utilities Index

               1Total   shareholder return as at September 30, 2020
4
Delivering a Growing and Sustainable Dividend

                                                  6% CAGR          since 2000
                                                                                                                              4-5%
                                                                                                                        target through to 2022

    $0.84      $0.89       $1.16        $1.31      $1.36   $1.41     $1.48      $1.66   $2.00   $2.13   $2.28   $2.38

     00         05          10           11         12      13        14         15      16      17      18      19     20F       21F        22F

5      Note: Denotes annual cash dividends paid
CUSTOMER FOCUS          Cleaner, affordable, reliable energy delivered safely

               ASSET FOCUS           Regulated electricity & gas assets

            GEOGRAPHIC FOCUS         North American markets with opportunities for growth

Emera                                Dividend           Rate Base            Disciplined                Balance Sheet
                                     Growth             Growth               Capital Allocation         achieve target
Strategy                             4-5% growth        7.5% to 8.5%         balance the ongoing        capital structure,
             FINANCIAL FOCUS         target through     compound annual      growth and diversity       supporting our
                                     to 2022            growth to 2023       of the portfolio to        investment grade
                                                                             achieve our financial      ratings
                                                                             targets

                                   Carbon Reduction              Operational Excellence Customer Experience
                                   investing in renewable and    & Affordability        and Innovation
                                   cleaner generation to         Investing in, and optimizing    Delivering on our promise to
                                   reduce the carbon intensity   our systems for reliability     customers with the best
           STRATEGIC INITIATIVES                                                                 experience and solutions for
                                   of our operations             with a focus on cost control,
                                                                                                 today and the future
                                                                 “Fuels to Assets” and “O&M
                                                                 to Assets” initiatives

6
Emera’s Strategy Drives Shareholder Value
 Emera’s ESG commitments are core to our strategy and our culture. Our decarbonization initiatives
 are central to our strategy and are driving our growth and in turn, value creation for shareholders.

         Emera’s                                 Capital                      Rate Base               Dividend             Shareholder
         Strategy                             Investments                      Growth                 Growth                 Returns

• Emera’s strategy is               • $7.4B to $8.6B                  • 7.5% to 8.5% rate     • Dividend growth      • Track record of
  rooted in its ESG                   capital program                   base growth (2021       guidance of 4% to      superior long term
  commitments and                     (2021 to 2023)                    to 2023)                5% through to 2022     returns for
  has been focused on                                                                                                  shareholders as
                                    • ~60% of Emera’s                 • EPS and cash flow     • 6% dividend CAGR
  decarbonizing our                                                                                                    compared to major
                                      capital program                   growth should track     since 2000
  generation fleet for                                                                                                 indices2
                                      invested in                       rate base growth
  15+ years                                                                                   • Current dividend
                                      decarbonization and               over time                                    • 10-year total
                                                                                                yield of 4.6%2
• ~80% planned                        reliability projects                                                             shareholder return of
  reduction in coal                                                                                                    11%2
  generation1
• Reduced GHG
  emissions by 35%1

7           1 As   compared to 2005; and 2 As of September 30, 2020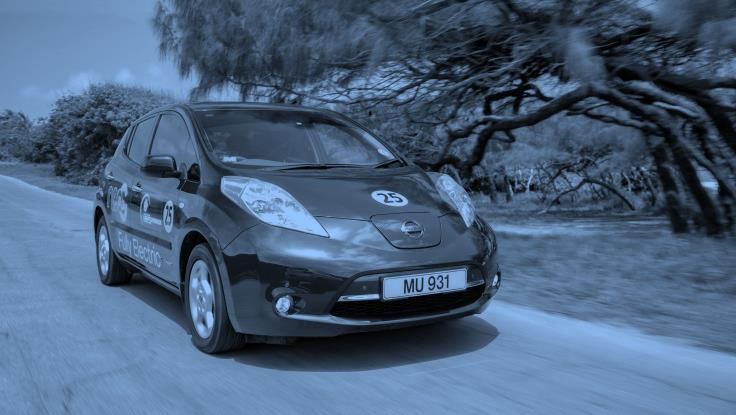
Transitioning to Cleaner Energy

                           35%                                                           30%
           reduction in GHG emissions                                      energy delivered to Nova Scotia Power
             Emera wide since 20051                                            customers is from renewables
                                                                                    (>triple 2005 levels)

                           60%                                                           22%
    of our 2021-2023 capital spend is focused                             of Tampa Electric’s generation capacity, or
       on cleaner and more reliable energy                                 ~1,250 MW, will be from the sun in 2023
                    initiatives                                           (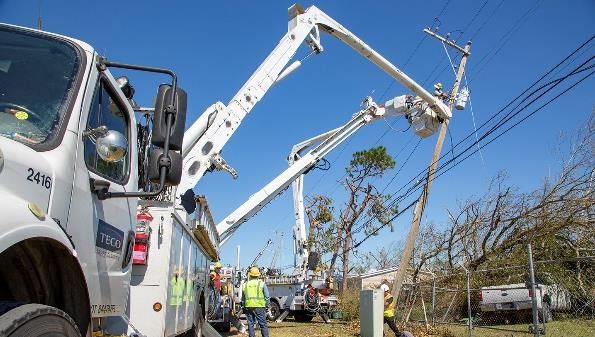
Emera’s Decarbonization Strategy in Action
    Emera’s strategy, which is focused on decarbonizing our generation fleet through investments in
     renewables and natural gas, has made significant advancements in reducing its GHG emissions

              Tampa Electric and Nova Scotia Power
                     GHG Emissions (in Mt)

                                                                           Emera recently published its
       24.1                                                                Sustainability Report which
                                                                            highlights our progress on
                               15.1
                                                                            Environmental, Social and
                                                     11.6                     Governance initiatives

      2005A                   2019A                  2023F

9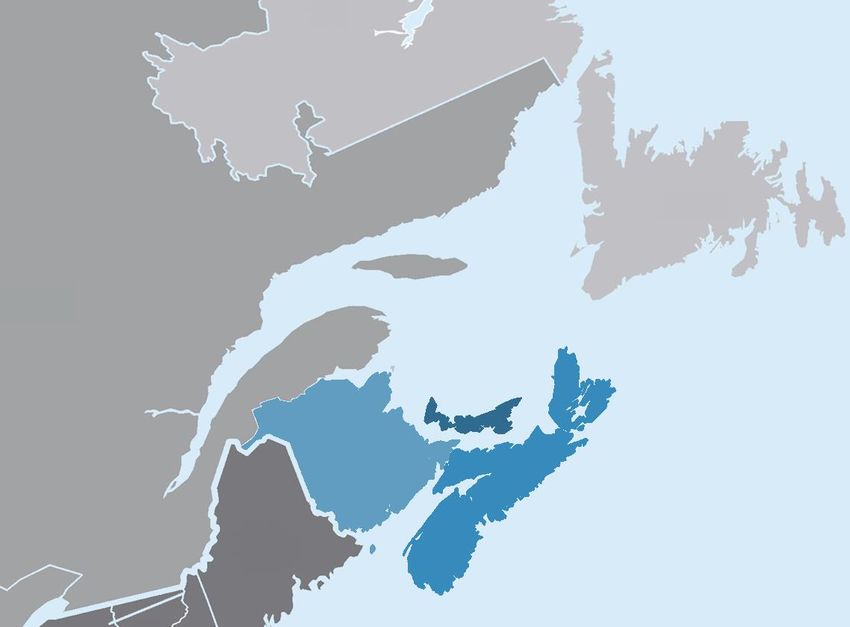
Emera’s Decarbonization Strategy in Action
The integration of renewables and natural gas has significantly transformed Emera’s generation fleet and
            our committed capital projects will further advance our decarbonization strategy

        Nova Scotia Power and Tampa Electric1
 Coal and Renewables as a % of total GWh Generation                            •   ~80% reduction in coal generation by
          3%                                                                       2023

                                                                               •   Renewables to increase from 3% in
                                                                                   2005 to 27% in 2023
          48%                            12%                            27%

                                         19%                                   •   Natural gas, a transition fuel, to
                                                                        10%        increase from 23% in 2005 to 59% in
      2005A                             2019A                          2023F
                                                                                   2023
                           Coal                  Renewables

      1   Represents the total GWh for Tampa Electric and Nova Scotia Power
10
Plan to Invest Between $7.4B to $8.6B in Rate Base
Forecasted Capital Spend1
$0.4
$0.6
$0.2
$2.7
$2.3 $2.4
2021F 2022F 2023F
Baseline Forecast Opportunities Under Development
1 In billions of Canadian dollars. US dollar denominated capex is translated at a forecasted average USD/CAD exchange rate of 1.33 in 2021-2023. Capital spend forecast by
11 affiliate can be found in the appendix.Capital Program Drives Future Rate Base Growth
Forecasted Rate Base1
$26.2
$24.5
$22.6
$20.8
$19.0
2019A 2020F 2021F 2022F 2023F
Baseline Rate Base Opportunities Under Development
1 2019 actuals exclude Emera Maine. Average total rate base in billions of Canadian dollars. U.S. dollar denominated rate base is translated at a forecasted exchange
12 rate of 1.33 in 2020-2023. Details by affiliate can be found in the appendix.Florida Investment Highlights
Solar Big Bend Modernization Storm Protection
• Investing US $850M to • Investing US $850M to • Legislation passed
install 600MW of solar by repower Unit 1 with natural promoting utility storm-
2021 (~550MW in-service gas combined cycle hardening investments
today) technology and retire Unit 2 • Tampa Electric filed its storm
• Further 600MW (related US • Construction began in protection plan with the
$600M included in the August 2019 and will be FPSC in 2020
2021-2023 capital forecast) completed in 2023 • 2021-2023 capital forecast
• Project is on schedule and includes US ~$400M of
on budget related investments
13Investing in Cleaner, More Reliable Energy
Renewable and Capital Projects (2021 to 2023) Total
Infrastructure Upgrades, Grid Modernization, etc. $1,360
Cleaner Energy Solar Investments – Tampa Electric 810
Storm Hardening – Tampa Electric 540
Reliability Projects & CIBS/PP2 Investments – PGS & NMGC 520
Modernization of Big Bend Modernization – Tampa Electric 360
Infrastructure RNG, CNG & LNG Projects 340
Hydro Renewal – Nova Scotia Power 290
Transmission Investment – Labrador Island Link 240
Customer-Focused Smart Meters & LED Streetlights 190
Total 4,650
Technologies % of Baseline Capital Program ~60%
1 Inmillions of Canadian dollars. US dollar denominated capex is translated at a forecasted
average USD/CAD exchange rate of 1.33
2 Cast iron/bare steel and problematic plasticBeyond 2023
▪ Emera’s strategy will continue to be relevant for the
Further
foreseeable future Decarbonization
▪ Regulations and customer demand for cleaner
energy will continue to create opportunities
Balancing Customer
▪ The coal remaining at Tampa Electric and Nova
Scotia Power will be targeted for further
Affordability
decarbonization opportunities
▪ Emera is committed to balancing the pace of Increased
decarbonization with customer affordability
Electrification
▪ Electrification is expected to increase over the long-
term across all customer classes
15Atlantic Loop Project
Newfoundland &
Labrador
Québec
Engaging with electricity sector
partners and governments to
Prince Edward collaborate and pursue an
Island
accelerated transition to cleaner
energy through the development of
New Brunswick
new large-scale transmission that
will enable the movement of clean
energy and firm capacity through the
Nova Scotia Atlantic region.Why Invest in Emera
Superior Shareholder Regulated, Florida- Growing & Sustainable Visible
Returns Focused Portfolio Dividend Growth Plan
~11% 95% 4-5% $7.4B to $8.6B
total shareholder return of earnings derived from dividend growth target capital investment plan to
over the last ten years1 regulated investments through to 2022 drive rate base growth
through 2023
Consistently outperform
the PHLX Utility
55% 6% 7.5% to 8.5%
Index and the TSX Capped of rate base located in growth in dividend per rate base growth through
Utilities Index Florida share over the last 20 years 2023, driven by Florida
investments
Representation in the TSX
Composite, TSX Capped
~65% 4.5% 70%
of earnings from US dividend yield1 of capital program to be
Utilities, TSX60 and select
operations invested in Florida
MSCI and FTSE World
Indices
1 As of September 30, 2020
17Appendix
Proven Decarbonization Strategy – Tampa Electric
      Reducing coal generation by investing
           in solar and natural gas1,2
                                                                                 Major Decarbonization Projects3
                                                                      12%            1,250 MW of solar by 2023, currently 600
                                        4%                                           MW in-service (~$1.6 billion)

                                                                                     Big Bend Modernization Project, 1,090
       37%                                                                           MW (repowering unit 1 with natural gas
                                                                                     and retiring unit 2), ~$850 million
                                       84%                           86%             investment
                                                                                     30MW battery storage by 2023 to work
       43%                                                                           with solar investments
                                        6%                            2%
                                                                                     Converted four simple-cycle combustion
      2005A                           2019A                          2023F
                                                                                     turbine units into a combined cycle unit at
              Coal            Natural Gas                Renewables                  Polk plant

     1 GWh   total generation; 2 Based on forecasted fuel prices; and 3 In USD
19
Proven Decarbonization Strategy – Nova Scotia Power
Reducing coal generation by investing in
hydro, wind and transmission projects1,2 Major Decarbonization Projects3
Added ~500 MW of wind (~150 MW rate
base and ~350 MW through IPPs)
9% 30%
Completed Maritime Link ($1.7 billion)
2% 59%
project which is capable of transmitting
12% 500 MW of hydro energy in 2021
55% 7% Investing $850 million (minority position)
43% in the 900 MW Labrador Island Link
23%
Refurbishment of Nova Scotia Power hydro
facilities (~400 MW) will secure existing
2005A 2019A 2023F hydro capacity ($500 to $600 million)
Coal Natural Gas Renewables
1 GWh total generation; 2 Based on forecasted fuel prices; and 3 In CAD
20Superior Long-Term Shareholder Returns
10.1%
3 year 12.0%
8.2%
9.6%
5 year 10.3%
11.1%
11.1%
10 year 6.6%
10.2%
11.5%
20 year 8.1%
7.8%
Emera TSX Utilities Index PHLX Utility Index
21 Note: Total shareholder return as at September 30, 2020Tampa Electric
Utility Type Vertically integrated electric utility
Regulator Florida Public Service Commission
9.25-11.25% Allowed ROE | 10.5% Earned ROE | 54%
Regulatory Construct
Allowed Equity | $7 billion Rate Base
Regulatory Arrangements Settlement agreement through 2021
Capex $3.0 billion (2021-2023)
84% Natural Gas | 6% Coal & Petcoke |
Generation
4% Renewable | 6% Purchases
T&D 2,150 km of transmission | 18,750 km of distribution
Customers 765,000
22 Note: All data as at December 31, 2019, and in US dollarsGas LDCs
New Mexico Gas Company
Type of Utility Natural gas transmission and distribution system
Regulator New Mexico Public Regulation Commission
9.1% Allowed ROE | 52% Allowed Equity | $0.6 billion
Regulatory Construct
Rate Base
Regulatory Filed a general rate case for new rates in 2021
Arrangements
Capex $0.3 billion (2021-2023)
T&D 2,600 km of transmission | 17,000 km of distribution
Customers 534,000
Peoples Gas System
Type of Utility Natural gas distribution system
Regulator Florida Public Service Commission
9.25-11.75% Allowed ROE | 10% Earned ROE |
Regulatory Construct
54.7% Allowed Equity | $1.1 billion Rate Base
Regulatory Arrangements Filed a general rate case for new rates in 2021
Capex $0.9 billion (2021-2023)
20,900 km of main lines | 11,900 km of service
Gas Lines
lines
Customers 406,000
23 Note: All data as at December 31, 2019, and in US dollarsNova Scotia Power
Utility Type Vertically integrated electric utility
Regulator Nova Scotia Utility and Review Board
8.75-9.25% Allowed ROE | 9.25% Earned ROE | 40%
Regulatory Construct
Allowed Equity | $4.1 billion Rate Base
Rate stabilization agreement through 2019 and 2020-
Regulatory Arrangements
2022 fuel stability plan in place
Capex $1.1 billion (2021-2023)
12% Natural Gas | 53% Coal & Petcoke | 28%
Generation
Renewable | 7% Purchases
T&D 5,000 km of transmission | 27,000 km of distribution
Customers 523,000
24 Note: All data as at December 31, 2019, and in Canadian dollarsEmera Caribbean
Barbados Light & Power Company Ltd.
Utility Companies Grand Bahama Power Company Ltd.
Dominica Electricity Services Ltd.
Utility Types Vertically integrated electric utilities
BLPC: Fair Trade Commission, Barbados
Regulators GBPC: The Grand Bahama Port Authority
Domlec: Independent Regulatory Commission, Dominica
10.1% Allowed Return on Rate Base (RORB) | $1.0 billion Rate
Regulatory Construct2
Base
Regulatory Arrangements GBPC rate stability agreement through 2021
Capex $0.3 billion (2021-2023)
Generation 95% Oil-fired | 5% Renewables
T&D 2,150 km of transmission | 18,750 km of distribution
Customers 180,000
1 Note: All data as at December 31, 2019
25 2 Represents weighted average return on rate baseEmera Newfoundland and Labrador
Labrador Island Link
Type of Utility Transmission
Regulatory Construct 8.50% Allowed ROE | $550 million equity investment
Further Equity Investment $0.2 billion in 2022
Maritime Link
Type of Utility Transmission
Regulator Nova Scotia Utility and Review Board
8.75-9.25% Allowed ROE | 30% Allowed Equity | $1.8 billion
Regulatory Construct
Rate Base
In 2019 UARB approved NSPML’s interim assessment for
recovery from NSPI of 2020 Maritime Link costs of ~$145
million. The total recovery of $145 million includes
Regulatory Arrangements
approximately $115 million of O&M, debt financing and
equity financing costs, and approximately $30 million for
depreciation and amortization of financing costs.
26 Note: All data as at December 31, 2019, and in Canadian dollarsOther Investments
Emera Energy Pipelines
Emera Energy Services | Bear Swamp Emera New Brunswick | Maritimes and Northeast Pipeline
Emera Energy Services Emera New Brunswick
• $15-30 million USD annual earnings ($45-70 million • Regulated by the National Energy Board
USD of margin) • 145 km long natural gas pipeline
• Earnings dependent on market conditions • Firm service agreement with Repsol Energy expiring in
• Minimal commodity exposure 2034
Bear Swamp Maritimes and Northeast Pipeline
• 50% joint venture • Regulated by the National Energy Board
• 600 MW hydro pumped storage capacity • 1,100 km long natural gas transmission line
• Attracts ISO – NE capacity revenue • 12.9% equity investment
Note: All data as at December 31, 2019
27Capital Forecast by Affiliate
Capital Forecast (CAD millions) 2021F 2022F 2023F Total
Tampa Electric $ 1,300 1,370 1,360 4,030
Peoples Gas 400 390 350 1,140
Seacoast 30 60 40 130
New Mexico Gas 140 140 140 420
Nova Scotia Power 410 360 360 1,130
Emera Caribbean 60 110 100 270
Emera Newfoundland - 240 - 240
Other 10 20 10 40
Subtotal - Baseline Forecast $ 2,350 2,690 2,360 7,400
Add: Opportunities Under Development 170 440 590 1,200
Capital Forecast (CAD millions) $ 2,520 3,130 2,950 8,600
1 US dollar denominated capex is translated at a forecasted average USD/CAD exchange rate of 1.33 in 2021 - 2023
28Rate Base Forecast by Affiliate
2019-2023
Rate Base (CAD millions)1 2019A 2020F 2021F 2022F 2023F
CAGR
Tampa Electric2 $ 9,225 10,335 11,200 12,025 12,815 8.6%
Peoples Gas2 1,450 1,810 2,225 2,535 2,810 18.0%
Seacoast3 85 185 205 245 270 33.5%
New Mexico Gas Company 775 845 990 1,005 1,050 7.9%
Nova Scotia Power 4,100 4,275 4,495 4,655 4,820 4.1%
Emera Caribbean 950 915 970 985 990 1.0%
Maritime Link 1,825 1,820 1,800 1,750 1,695 -1.8%
Labrador Island Link4 550 600 650 875 875 12.3%
Subtotal - Baseline Forecast $ 18,960 20,785 22,535 24,075 25,325 7.5%
Add: Opportunities Under Development - - 90 390 910
Total $ 18,960 20,785 22,625 24,465 26,235 8.5%
1 `Average rate base; US dollar denominated rate base is translated at a forecasted average USD/CAD exchange rate of 1.33 in 2020-2023
2 `Capital structures that support the rate base include deferred tax liabilities (DTL), a zero cost-of-capital component of the capital structure in Florida; 2019 capital
structures included DTLs of $1,200 million at Tampa Electric and $200 million at Peoples Gas
3 `Reflects the capital asset values of the regulated pipeline investments
29 4 `Reflects Emera’s equity investment in the projectYou can also read