INVESTOR PRESENTATION - YPF
←
→
Page content transcription
If your browser does not render page correctly, please read the page content below

INVESTOR PRESENTATION

As of March 2018
IMPORTANT NOTICE
Safe harbor statement under the US Private Securities Litigation Reform Act of 1995.
This document contains statements that YPF believes constitute forward-looking statements within the meaning of the US Private Securities Litigation Reform Act
of 1995.
These forward-looking statements may include statements regarding the intent, belief, plans, current expectations or objectives of YPF and its management,
including statements with respect to YPF’s future financial condition, financial, operating, reserve replacement and other ratios, results of operations, business
strategy, geographic concentration, business concentration, production and marketed volumes and reserves, as well as YPF’s plans, expectations or objectives
with respect to future capital expenditures, investments, expansion and other projects, exploration activities, ownership interests, divestments, cost savings and
dividend payout policies. These forward-looking statements may also include assumptions regarding future economic and other conditions, such as future crude
oil and other prices, refining and marketing margins and exchange rates. These statements are not guarantees of future performance, prices, margins, exchange
rates or other events and are subject to material risks, uncertainties, changes and other factors which may be beyond YPF’s control or may be difficult to predict.
YPF’s actual future financial condition, financial, operating, reserve replacement and other ratios, results of operations, business strategy, geographic
concentration, business concentration, production and marketed volumes, reserves, capital expenditures, investments, expansion and other projects, exploration
activities, ownership interests, divestments, cost savings and dividend payout policies, as well as actual future economic and other conditions, such as future
crude oil and other prices, refining margins and exchange rates, could differ materially from those expressed or implied in any such forward-looking statements.
Important factors that could cause such differences include, but are not limited to, oil, gas and other price fluctuations, supply and demand levels, currency
fluctuations, exploration, drilling and production results, changes in reserves estimates, success in partnering with third parties, loss of market share, industry
competition, environmental risks, physical risks, the risks of doing business in developing countries, legislative, tax, legal and regulatory developments, economic
and financial market conditions in various countries and regions, political risks, wars and acts of terrorism, natural disasters, project delays or advancements and
lack of approvals, as well as those factors described in the filings made by YPF and its affiliates with the Securities and Exchange Commission, in particular, those
described in “Item 3. Key Information—Risk Factors” and “Item 5. Operating and Financial Review and Prospects” in YPF’s Annual Report on Form 20-F for the
fiscal year ended December 31, 2016 filed with the US Securities and Exchange Commission. In light of the foregoing, the forward-looking statements included in
this document may not occur.
Except as required by law, YPF does not undertake to publicly update or revise these forward-looking statements even if experience or future changes make it
clear that the projected performance, conditions or events expressed or implied therein will not be realized.
These materials do not constitute an offer to sell or the solicitation of any offer to buy any securities of YPF S.A. in any jurisdiction. Securities may not be offered
or sold in the United States absent registration with the U.S. Securities and Exchange Commission or an exemption from such registration.
Cautionary Note to U.S. Investors — The United States Securities and Exchange Commission permits oil and gas companies, in their filings with the SEC, to
separately disclose proved, probable and possible reserves that a company has determined in accordance with the SEC rules. We may use certain terms in this
presentation, such as resources, that the SEC’s guidelines strictly prohibit us from including in filings with the SEC. U.S. Investors are urged to consider closely
the disclosure in our Form 20-F, File No. 1-12102 available on the SEC website www.sec.gov.
                                                                                                                                                                           2
CONTENTS

01   Company Overview

02   Business Assets Update

03   Financial Results

04   Conclusions

                              3
CORPORATE GOVERNANCE

Shareholder structure                                              Board composition
                                                                     Other Members                                             Chairman of the Board
                               Argentine government                  Mr. Monti                                                 Mr. Gutiérrez
                               Argentine government “Series A”       Mr. Rodriguez Simón
                                                                     Mr. Bruno
                     51.0%     Free float                            Mr. Donnini                                                                Shares Class A
                                                                     Mr. Di Pierro                                                              Mr. Apud (*)
                                                                     Mr. Fidel
                                                                     Mr. Abud
                                                                     Mr. Kokogian
                                                                     Mr. Domenech
                                                                     Mr. Felices
                                                                     Mr. Montamat
                                                                     Mrs. Leopoldo
          48.99%

                                                                   Audit Committee                                                  Compliance Committee
                   0.01%                                           Mr. Felices (President), Mr. Montamat, Mr.                       Mr. Rodriguez Simón (President),
                                                                   Domenech, Mr. Apud and Ms. Leopoldo                              Mr. Apud and Ms. Leopoldo

Markets
                                                                   Appointments and                                                 Risk and Sustainability
                                                                   Remuneration Committee                                           Committee
                   YPF                                YPFD         Mr. Montamat (President), Mr. Monti,                             Mr. Monti (President), Mr. Di Pierro,
                                                                   Mr. Felices, Mr. Rodriguez Simón                                 Mr. Kokogian , Mr. Fidel and Mr Bruno
                                                                   and Mr. Kokogian
Ratings                                                                                              New: Strategy and
                                                                                                     Transformation Committee
              B              B2                         B+
              AA (Arg)       B2 (Arg)                   B+ (Arg)                                     Mr. Felices, Mr. Montamat, Mr. Rodriguez
                                                                                                     Simón, Mr. Monti, Mr. Gutiérrez and
                                                                                                     Mr. Apud                                                               4
RESULTS – HIGHLIGHTS

    Revenues LTM 1                                                  Exploration                              • Production 7: 228 Kbbl/d of oil, 50 Kbbl/d of NGL and 44 Mm3/d of natural gas
                                                                    and production                           • Proved Reserves 3 in 2017: 480 mm bbl of liquids and 449 mm boe of gas
    USD 15,291 mm                                                                                            • Unique unconventional opportunities: Vaca Muerta, Lajas, Mulichinco

                                                                    Downstream -                            • Total refining Capacity: 320 Kbbl/d 4 5 (more than 50% 4 of Argentina’s total capacity)
    Adj. EBITDA LTM                           12                    refining and                            • High level of conversion and complexity
                                                                    logistics                               • Nearly 2,700 km 4 of crude oil and 1,801 km 4 of refined products pipeline
    USD 4,053 mm
                                                                    Downstream -                            • The petrochemical business is integrated with the rest of the production chain
                                                                    petrochemicals                          • Output Capacity: 2.2 4 mm ton per annum
    Net income LTM 1
                                                                    Downstream -                             • The country’s leading company in fuel marketing (56% 7 market share in diesel and gasoline)
    USD 727 mm                                                      marketing                                  • 1,547 4 6 service stations

                                                                                                            • MEGA: Liquids separation and a fractioning plant
    Employees 4                                                     Major Affiliates                        • Metrogas: Largest local gas distribution company
                                                                                                            • Refinor: Refining, transportation and marketing of refined products
    19,257                                                                                                  • Profertil: Fertilizer producer (urea and ammonia)
                                                                                                            • AESA: Engineering, manufacturing, construction, operating
                                                                                                              and maintenance services to power and energy companies
                                                                                                            • YPF EE: Power generation

(1)YPF financial statements values in IFRS converted to US$ using average FX of each period including partia reversal of property, plant & equipment of USD 287 billion. (2) Adjusted EBITDA = Operating income + Depreciation and impairment of
   property, plant and equipment and intangible assets + Amortization of intangible assets + unproductive exploratory drillings. (3) Includes oil, condensates and liquids; converted using 1 boe = 5.615 mmcf of gas as per 20-F 2016. (4) As per 20-F
   2016. (5) Does not includes 50% of Refinor (13 kbbl/d). (6) Excludes 66 Refinor service stations. (7) Q4 LTM 2017.
                                                                                                                                                                                                                                                          5
LEADING ARGENTINE O&G COMPANY

Upstream                                                            Downstream
MARKET SHARE BREAKDOWN (%)                                          MARKET SHARE BREAKDOWN (%)

Oil                                Others                           Crude Processing 1           No. of Gas Stations 2
Production 1                                     18%
                                                                                    Others:
                                        3%                                            2%            Others
                                       4%
                                                              46%
                                                                                 5%4%                        27%
                                       4%                                                                             36%
                                                                            14%           59%
                                        5%
                                                                                                        6%
                                                  20%                        16%                         6%
                                                                                                              11% 14%

                                      Others
Gas                                              17%
                                                                    Gasoline 1                   Diesel 1
Production 1                             1%                   41%                Others                      Others
                                        3%
                                        4%                                          6%
                                                                                  5%                           8%
                                                                                                             6%
                                            8%
                                                                             14%           55%          14%           57%
                                             10%
                                                        16%
                                                                             20%                            15%
Source: IAPG
(1)   Cumulative Jan – Dec 2017.
(2)   As of December 2016.
                                                                                                                            6
INTEGRATED ACROSS VALUE CHAIN

  Oil                                                         Domestic
                                                                         Purchases                Domestic market
  business                                                    market
                                                                                                  79% Domestic prices (gasoline, diesel)         91%
                                                                                                  21% International prices (bunker, jet fuel,
                                                                                                  petrochemicals, lubricants, LPG and others)

                                             Production                              Refining     Exports
                                             228 Kbbl/d                              293 Kbbl/d   International prices
                                                                                                                                                    9%
                                                                                                  (naphtha, LPG, jet fuel, petrochemicals,
                                                                                                  fuel oil, soybean oil and meal and others)

  Natural gas                                                                                     40%                                      29%
                                                                                                  Residential                              Power
  business                                                                                        + CNG                                    plants
                                            Upstream                                 Domestic
                                            44 mm m3/d                               market
                                                                                                  31%
                                                                                                  Industrial

Production figures and natural gas business as LTM Q4 2017.
                                                                                                                                                         7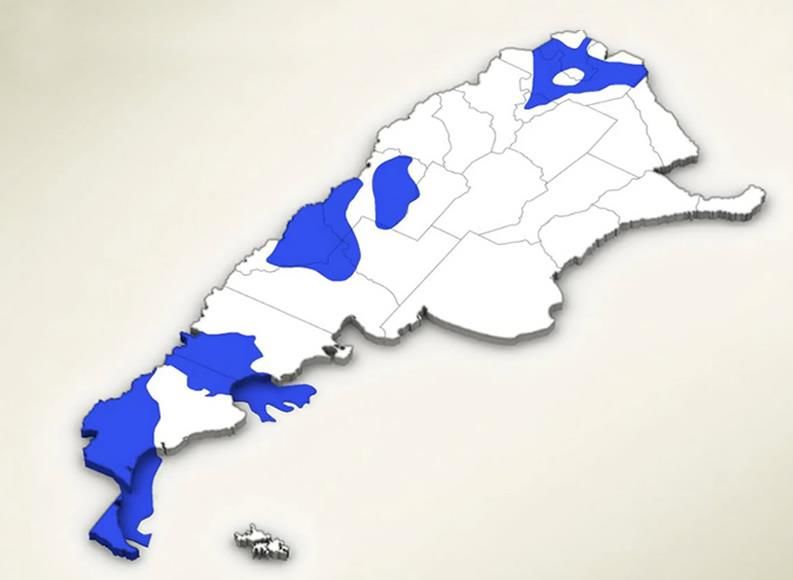
OUR TARGETS

5-YEAR BUSINESS PLAN
2018-2022

                                                                                                                             (1)
      PRODUCTION                                     RESERVES                                          EBITDA                                           CAPEX                                    NET DEBT
      2018 - 2022                                    2018 - 2022                                       CAGR                                             Bn USD / YEAR                            TO EBITDA
                                                                                                       2018 - 2022                                      2018 - 2022                              2022

      +25%                                             +50%                                             +10%                                              4/4.5                                  ~1.5x

(1)   EBITDA = Operating income + Depreciation and impairment of property, plant and equipment and intangible assets + Amortization of intangible assets + unproductive exploratory drillings.

                                                                                                                                                                                                             8
CONTENTS

01   Company Overview

02   Business Assets Update

03   Financial Results

04   Conclusions

                              9
UPSTREAM - SIGNIFICANT POTENTIAL WITH LEADING MARKET POSITION
YPF has 112 concessions in the most productive Argentine
Cuyana
Proved reserves: 29 mm boe
basins (total reserves 1P: 929 mm boe) and 23 exploration
% liquids: 99% blocks in the country
% gas: 1%
Production: 7.1 mm boe
2017
Neuquina
Proved reserves: 590 mm boe Proved reserves 1 Production share
% liquids: 40%
% gas: 60%
Production: 141.5 mm boe Noroeste Others
Proved reserves: 29 mm boe Gas 15%
% liquids: 10% Chevron
% gas: 90% 48% 2%
Production: 6.3 mm boe
Pluspetrol
3%
Golfo San Jorge Sinopec YPF
3%
Proved reserves: 243 mm boe 43%
% liquids: 85% Pampa
% gas: 15% 4%
Production: 39.5 mm boe
Austral Wintershall
5%
Proved reserves: 37 mm boe
% liquids: 12%
Liquids Pan American
18%
% gas: 88%
Production: 8.2 mm boe
52% Total Austral
7%
Total: 929 mm boe Total: 461.8 mm boe
Source: Company data 2017. Source: IAPG, as of December 2017.
(1) As of December 2017.
10REVIEW OF FY 2017 OPERATIONS PRODUCTION
Total production was down 3.9%. Crude oil production was down mainly due to a reduction
in drilling activity and the effects of the severe weather conditions in Q2 2017.
CRUDE OIL PRODUCTION NATURAL GAS PRODUCTION TOTAL PRODUCTION
(KBBL/D) (MM3/D) (KBOE/D)
-7.0% -1.1% -3.9%
244.7 577.4
44.6 44.1
227.5 555.0
2016 2017 2016 2017 2016 2017
11REVIEW OF FY 2017 OPERATIONS RESERVES
Proved Reserves decreased by 16.5%, partially affected by lower domestic crude oil prices.
TOTAL HYDROCARBON RESERVES
(MBOE)
1.212 1.226
1.132 1.083 1.113
1.014 982 1.005 979 929
2008 2009 2010 2011 2012 2013 2014 2015 2016 2017
12REVIEW OF FY 2017 OPERATIONS SHALE OIL & GAS UPDATE
NET SHALE O&G PRODUCTION LOMA CAMPANA HORIZONTAL WELL COST
(KBOE/D) (KUSD/LATERAL FT.)
42.1 3.05
38.1
32.7 2.27
27.2
1.63
1.39
15.2
11.6
2013 2014 2015 2016 2017 Q4 2017 2015 2016 2017 Q4 2017
PRODUCING NEW WELLS KBOE/D Q4 2017 SHALE LOMA CAMPANA HORIZONTAL WELL
WELLS IN 2017 (1) GROSS PRODUCTION (2) OPERATIONAL PERFORMANCE
607 64 81.3 3,5
Average lateral lengh (Km) Average frac stages 30
3,0
20 21 25
2,5
16 17 20
2,0
15
1,5
10
1,0
0,5 5
(1) Includes 11 wells in Q4 2017. 1,4 1,4 1,7 1,9
(2) Total operated production (Loma Campana + El Orejano + Bandurria+ La Amarga Chica - -
+ Narambuena + Bajo del Toro + Bajada de Añelo). 2015 2016 2017 Q4 2017
13Ongoing Development
BAJO DEL
REVIEW OF FY 2017 OPERATIONS
Ongoing Pilots
SALINAS
DEL HUITRIN
TORO
SHALE OIL & GAS UPDATE
2018 Planned Pilots
CERRO LAS Fold & Thrust Belt
MINAS
Volatile Oil to Gas 3,200 meters long lateral well succesfully
and Condensate
drilled in Loma Campana
Development cost in El Orejano below
EL
OREJANO 1 USD/mmtbu area.
CERRO
3-phase pilot in La Amarga Chica expected to be
BANDURRIA
ARENA SUR
LA AMARGA CHICA
finalized in the second half of 2018
AGUADA DE
LA ARENA
USD 300 million JV with Statoil closed
LA RIBERA I
LA RIBERA LOMA CAMPANA
RINCON DEL II
MANGRULLO 5 pilot projects expected to be launched in 2018
More than 100 wells expected to be drilled
LAS TACANAS
in Vaca Muerta in 2018 in 11 different areas
14DOWNSTREAM - SOLID MARKET LEADERSHIP
Monthly Diesel Sales (Km3)
800
-0.7%
Luján
Proved de Cuyo
reserves: refinery
85 M boe 750
A % liquids: 98 D
Capacity:
% gas: 2 105.5 kbbl/d 700 2016
Production: 8.8 M boe 2017
650 2015
La Plata
Proved refinery
reserves: 85 M boe
B % liquids: 98 600
Capacity:
% gas: 2 189 kbbl/d A
Production: 8.8 M boe 550
500
C Jan Feb Mar Apr May Jun Jul Aug Sep Oct Nov Dec
B
Monthly Gasoline Sales (Km3)
500 +6.8%
480
2017
Plaza Huincul refinery 460 2015
C
Capacity: 25 kbbl/d 440 2016
420
Oil pipeline 400
Refinor(1)
Products pipeline D 380
Capacity: 26.1 kbbl/d 360
Terminals
340
320
Source: 20-F 2016.
300
(1) YPF owns 50% of Refinor (not operated). Jan Feb Mar Apr May Jun Jul Aug Sep Oct Nov Dec 15REVIEW OF FY 2017 OPERATIONS DOWNSTREAM PERFORMANCE
Sales volumes decreased by 0.5% due to lower sales volumes of fuel oil, LPG and diesel that more
than offset higher sales volumes of gasoline and jet fuel. Refinery output flat.
CRUDE PROCESSED DOMESTIC SALES OF REFINED PRODUCTS
(KBBL/D) (KM3)
-0.5%
16,463 16,372
-0.2%
294 293
Others
+6.8% LPG
Fuel Oil
JP1
Gasoline
-0.7% Diesel
2016 2017 2016 2017
16REVIEW OF FY 2017 OPERATIONS GAS & POWER UPDATE
• Recently announced an agreement with • Implied valuation of YPF EE of
GE to capitalize YPF EE; YPF would get USD 1,100 M to USD 1,240 M
diluted to 75%.
• YPF EE has 1,807 MW (1) of
• Subscription value of USD 275 M, plus a total installed capacity and
contingent payment of USD 35 M. another 485 MW under
construction
• In advanced negotiations with a 3rd
party to subscribe an additional 24.5%
under similar terms
(1) In addition, YPF has 157 MW of installed capacity within its upstream business .REVIEW OF DOMESTIC FUEL AND CRUDE OIL PRICES
F.O.B. Refinery/Terminal Taxes
F.O.B. REFINERY/TERMINAL VS IMPORT PARITY (1)
PUMP PRICES BREAKDOWN Comission & Freight
% VARIATION % - AS OF MARCH 1ST 2018
RBOB+Etanol vs. Gasoline
(2) Gasoline (2) Diesel (2)
130
120 36%
41%
47%
110 54%
100
02/10/2017 02/11/2017 02/12/2017 02/01/2018 02/02/2018 10%
12%
F.O.B. Refinery/Terminal RBOB+ethanol
HISTORICAL PRICES OF BRENT AND DOMESTIC CRUDE OIL
130
HO+Fame(3) vs. Diesel(2) USD/BBL
111 112 109
97 99
120
80 76 77 75
74
110 61 62 65
61 57
53
47 45 53
67 65 54
100 65
02/10/2017 02/11/2017 02/12/2017 02/01/2018 02/02/2018 57 52
47 44 51
42 41
F.O.B. Refinery/Terminal HO+Fame (2)
2008 2009 2010 2011 2012 2013 2014 2015 2016 2017
(1) Import parity includes international reference price and domestic price for biofuels. Does not include internationalization Brent crude oil Medanito crude oil Escalante crude oil
costs. (2) Based on our regular products. (3) Fatty acid methyl esters (“FAME”).REVIEW OF NATURAL GAS PRICE SCHEME
Market prices are increasing while subsidies are being reduced; average realization price for YPF
expected to remain flat.
NATURAL GAS MARKET PRICES (1)
PLAN GAS INCENTIVES
USD/MMBTU, % VOLUMES, USD/MMBTU
2017-E2018 2017-E2018
7
Market (1) Subsidies
6
2017 E2018
~4.9 USD/
5
MMBTU
4
3
2
1
0
Average Price Residential - CNG Industrial Power Generators 2017 E2018
(1)
Share 30%-35% 35%-40% 25%-30%
(1) In 2018 market price includes subsidies to demand .CONTENTS
01 Company Overview
02 Business Assets Update
03 Financial Results
04 Conclusions
20REVIEW OF FY 2017 OPERATIONS RESULTS EXPRESSED IN US DOLLARS
Adj. EBITDA increased by 2.3% driven by a 7.2% increase in Revenues partially offset
by a 8.7% increase in Cash Costs and one-time gains in 2016.
REVENUES (1) ADJ. EBITDA (1) (2) OPERATING INCOME (1) (3)
(IN MILLIONS OF USD) (IN MILLIONS OF USD) (IN MILLIONS OF USD)
+7.2% +2.3% -6.4%
15,291
14,262 3,962 4,053
735
687
2016 2017 2016 2017 2016 2017
(1) YPF financial statements values in IFRS converted to USD using average FX of each period.
(2) Adjusted EBITDA = Operating income + Depreciation and impairment of property, plant and equipment and intangible assets + Amortization of intangible assets + unproductive exploratory drillings.
(3) Operating Income before impairment charge of Ps 34.9 billion (USD 2.2 billion) in Upstream segment for 2016 and reversal gain of Ps 5.0 billion (USD 271 million) for 2017.
21CAPEX BREAKDOWN
Capex was down 7.6% in peso terms and Upstream Activity breakdown: 70% in drilling
17.8% in USD terms, mainly due to the and workovers, 24% in facilities
decrease in activity in the Upstream segment. and 6% in exploration and other
upstream activities.
(IN MILLIONS OF USD)
Upstream Downstream
Gas & Energy Others
Downstream Activity breakdown: 53% in refining,
23% in logistics, 14% in chemical
4,256 -17.8% and 10% in marketing.
3,496
Start up of the Loma Campana I
Gas thermoelectric plant and the initial
& Power testing of the Tucumán thermoelectric
generation plant. Progress of the
Manantiales Behr wind farm.
2016 2017
22FINANCIAL SITUATION
Strong cash position at the end of 2017 and positive free cash flow; cash flow from operations up
by 8.6%.
CONSOLIDATED STATEMENT OF ADJUSTED CASH FLOWS CASH FLOW FROM OPERATIONS
(IN MILLIONS OF USD) (IN MILLIONS OF USD)
4,379 +8.6%
4,359
4,012
2,241
-3,354
1,707
-490
Cash & cash Adjusted Cash flow Capex Net Financing Cash & cash 2016 2017
(2) (3) equivalents at the end
equivalents at the end from operations
of Q4 2016 (1) of Q4 2017
(1)
(1) Includes cash & cash equivalents, including Argentine sovereign bonds BONAR 2020 and BONAR 2021.
(2) Effective spending in fixed asset acquisitions during the year.
(3) Includes effect of changes in exchange rates and revaluation of investments in financial assets .
23FINANCIAL SITUATION
Cash position strengthened by new debt issuances
and strong cash flow generation in 2017.
FINANCIAL DEBT AMORTIZATION SCHEDULE (1) (2)
(IN MILLIONS OF USD)
4,385
2,241
2,115
76.4% denominated in USD
1,386 and 23.6% in Argentine Pesos
1,024
613 749
Average interest rates of 7.43%
in USD and 23.37% in Pesos
Cash & 2018 2019 2020 2021 2022 2023+
Equivalents (3)
Average life of
USD denominated debt Peso denominated debt
6.4 years
(1) As of December 31, 2017.
(2)
(3)
Converted to USD using the December 31, 2017 exchange rate of Ps 18.60 to U.S $1.00.
Includes cash & equivalent, including Argentine sovereign bonds BONAR 2020 and BONAR 2021.
Net Debt / LTM Adj. EBITDA
(4) Net debt to Adj. EBITDA calculated in USD. Net debt at period end exchange rate of Ps 18.60 to U.S $1.00 and LTM Adj. EBITDA calculated as sum of
quarters.
1.98x 3)(4)
24CONSOLIDATED BALANCE SHEET
Balance sheet 12/31/2017 12/31/16 VAR %
(Ps million) (Ps million) 2017 / 2016
Cash & ST investments 28,738 10,757 167%
Property, plant & equipment 354,443 308,014 15%
Other assets 122,537 102,368 20%
Total assets 505,718 421,139 20%
Loans 191,063 154,345 24%
Liabilities 162,122 148,133 9%
Total Liabilities 353,185 302,478 17%
Shareholders’ equity 152,533 118,661 29%
Source: YPF financial statements.
25CONSOLIDATED INCOME STATEMENT
Income 2017 2016 VAR % Q4 2017 Q4 2016 VAR %
statement (Ps million) (Ps million) 2017 / 2016 (Ps Million) (Ps Million) Q4 2017 / Q4 2016
Revenues 252,813 210,100 20% 69,614 54,558 28%
Operating
income 16,073 -24,246 N/A 5,046 3,396 49%
Adj. EBITDA 1 66,791 58,216 15% 16,745 13,933 20%
Net income 12,672 -28,379 N/A 11,962 1,775 574%
Source: YPF financial statements.
(1) Adjusted EBITDA = Operating income + Depreciation and impairment of property, plant and equipment and intangible assets + Amortization of intangible assets + unproductive exploratory drillings.
26CONTENTS
01 Company Overview
02 Business Assets Update
03 Financial Results
04 Conclusions
27SUMMARY
Reaffirm 5-year business plan unveiled in 2017
Strong economy is resulting in continued demand growth
for all our products
New market environment with liberalized prices
in the downstream business; focus on margins
Production was down mainly as a consequence of severe weather
conditions and operating challenges; sustainable activity level
Natural gas revenues less dependant on subsidies for 2018 and
beyond.
Upstream activity in 2018 focused on building base for future
growth; shale pilots.
28INVESTOR PRESENTATION As of March 2018
You can also read