Earnings Presentation - NYSE American | LLEX - Lilis Energy

Page created by Terry Lambert
 
CONTINUE READING
Earnings Presentation - NYSE American | LLEX - Lilis Energy
2nd Quarter 2019
                       Earnings Presentation

NYSE American | LLEX
Earnings Presentation - NYSE American | LLEX - Lilis Energy
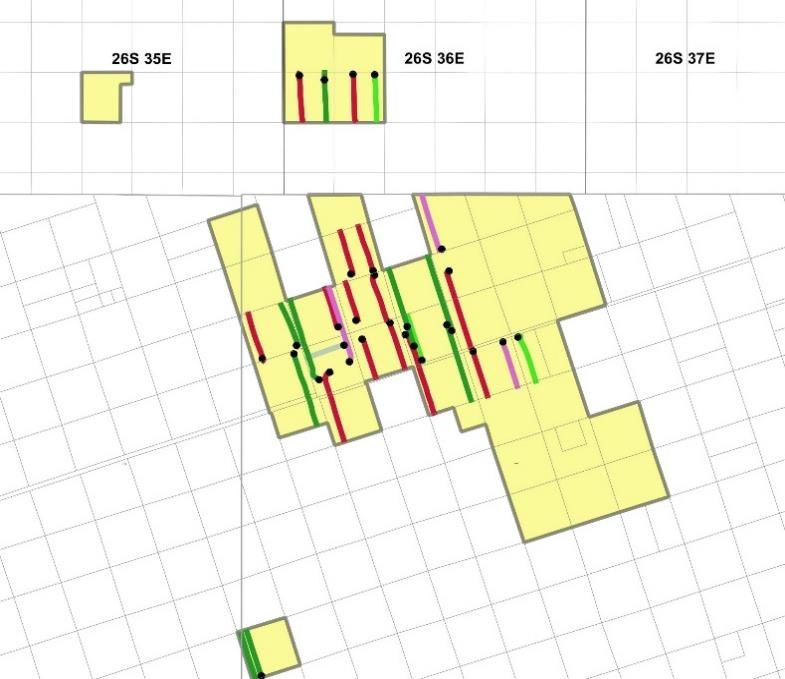
Disclaimer – Forward-Looking Statements
This presentation contains forward-looking statements. The use of words such as “believes”, “expects”, “anticipates”, “intends”, “plans”, “estimates”, “should”, “likely”
or similar expressions, indicates a forward-looking statement. These statements and all the projections in this presentation are subject to risks and uncertainties and
are based on the beliefs and assumptions of management, and information currently available to management. The actual results could differ materially from a
conclusion, forecast or projection in the forward-looking information. The identification in this presentation of factors that may affect Lilis’ future performance and the
accuracy of forward-looking statements is meant to be illustrative and by no means exhaustive. These forward-looking statements are given only as of the date of this
presentation. Except as required by law, we do not intend, and undertake no obligations, to update any forward-looking statements.
All forward-looking statements should be evaluated with the understanding of their inherent uncertainty. These forward-looking statements include, among other
things, statements about Lilis’ expectations, beliefs, intentions or business strategies for the future, statements concerning Lilis’ outlook with regard to the timing and
amount of future production of oil, natural gas liquids and natural gas, price realizations, the nature and timing of capital expenditures for exploration and
development, plans for funding operations and drilling program capital expenditures, the timing and success of specific projects, operating costs and other expenses,
proved oil and natural gas reserves, liquidity and capital resources, outcomes and effects of litigation, claims and disputes and derivative activities. Factors that could
cause Lilis’ actual results to differ materially from those expressed or implied by forward-looking statements include, but are not limited to: the success of Lilis’
exploration and development efforts; the price of oil, gas and other produced gases and liquids; the worldwide economic situation; changes in interest rates or
inflation; the ability of Lilis to transport gas, oil and other products; the ability of Lilis to raise additional capital, as it may be affected by current conditions in the stock
market and competition in the oil and gas industry for risk capital; Lilis’ capital costs, which may be affected by delays or cost overruns; cost of production;
environmental and other regulations, as the same presently exist or may later be amended; Lilis’ ability to identify, finance and integrate any future acquisitions; and
the volatility of Lilis’ stock price. See the risks discussed in Lilis’ Annual Report on Form 10-K and Quarterly Reports on Form 10-Q.

RECONCILIATION OF NET INCOME (LOSS) TO ADJUSTED EBITDAX (UNAUDITED)

Adjusted EBITDAX (as defined below) is presented herein and reconciled from the GAAP measure of Net Income because of its wide acceptance by the investment
community as a financial indicator.

The Company defines Adjusted EBITDAX as net income, plus (1) exploration and abandonments expense, (2) depreciation, depletion and amortization expense, (3)
accretion of discount on asset retirement obligations expense, (4) non-cash stock-based compensation expense, (5) unrealized (gain) loss on derivatives, (6) gain on
disposition of assets, net, (7) interest expense, (8) loss on extinguishment of debt, (9) gain on equity method investment distribution and (10) federal and state income
tax expense. Adjusted EBITDAX is not a measure of net income or cash flows as determined by GAAP.

The Company’s Adjusted EBITDAX measure provides additional information which may be used to better understand the Company’s operations. Adjusted EBITDAX is
one of several metrics that the Company uses as a supplemental financial measurement in the evaluation of its business and should not be considered as an alternative
to, or more meaningful than, net income as an indicator of operating performance. Certain items excluded from Adjusted EBITDAX are significant components in
understanding and assessing a company’s financial performance, such as a company’s cost of capital and tax structure, as well as the historic cost of depreciable and
depletable assets. Adjusted EBITDAX, as used by the Company, may not be comparable to similarly titled measures reported by other companies. The Company
believes that Adjusted EBITDAX is a widely followed measure of operating performance and is one of many metrics used by the Company’s management team and by
other users of the Company’s consolidated financial statements. For example, Adjusted EBITDAX can be used to assess the Company’s operating performance and
return on capital in comparison to other independent exploration and production companies without regard to financial or capital structure, and to assess the financial
performance of the Company’s assets and the Company without regard to capital structure or historical cost basis.

                                                                                         2
Earnings Presentation - NYSE American | LLEX - Lilis Energy
LLEX Second Quarter 2019 Highlights & Achievements

                     • 2Q’19 oil production of 3.9 MBbls/d (+50% YoY), total production of 6.3 MBOE/d (+32% YoY)
    Improving
                     • 2Q’19 oil, natural gas, and NGL sales revenue increased 23% YoY to $21.9MM
 Financial Metrics   • Sales volumes were 73% liquids, including 62% crude oil, for the quarter ended June 30, 2019
    & Growth         • 2Q’19 Adj. EBITDAX of $11.4MM, up 38% YoY
                     • Proved reserves at 2Q’19 of 43 MMBoe (+14% YoY), including 69% liquids

                     • Reduced crude transportation costs from $5.15/Bbl in December 2018, to $0.75/Bbl in June 2019
    Enhanced         • Realized 93% of WTI in 2Q’19, versus 84% of WTI in 1Q’19
     Margins
                     • Reduced recurring LOE by 24% to $4.99/Boe compared to $6.59/Boe for the same period in 2018 through
                       reductions in saltwater disposal costs

                     • In 2Q’19 LLEX began focusing on cost reductions and efficiencies by consolidating offices in Fort Worth
 Cost Reductions     • Reduced overall headcount by ~15% and expect to recognize significant G&A savings going forward
         &
     Capital         • Drilling and completion activities have been temporarily suspended to focus on improving efficiencies on
                       existing production
   Efficiencies
                     • Production in 2Q’19 increased by 5% Boe/d and 11% Bo/d compared to 1Q’19

                                                                3
2019 Outlook & Guidance
                                                Demonstrating Production and EBITDAX Growth
•    Increased EBITDAX 38% YoY
•    Maintaining full-year 2019 CapEx guidance of $60-70MM
•    Completed 3 of the 5 2018 DUC wells (Haley #1H, Haley #2H, and NE Axis #2H) in 2Q’19
•    Additional production from scheduled completions activity in 3Q’19 is expected to further impact 2019 results due to the benefits of
     effective crude oil transportation contracts
•    Well hedged in 2019, 2020, and 2021 with incremental improving price realizations based on existing FT contracts
•    Temporarily suspended drilling and completions operations toward the end of 2Q’19 to focus on cost reductions, office consolidations, and
     improving overall operational efficiencies on producing wells
•    Capital spending in 3Q’19 will focus on drilling the Grizzly A #2H and completing the 2 Kudu wells which are expected to be flowing to sales
     in 4Q’19
                                                              Guidance & Key Assumptions
                                                                     2Q’19                       2Q’19                      3Q’19                    Full Yr 2019
                                                                    Guidance                     Actual                    Guidance                   Guidance
Oil Production (MBbls/d)                                             3.6 – 3.8                     3.9                     2.0 – 2.3                   3.0 – 3.2
NGL Production (MBbls/d)                                             0.8 – 1.0                     0.7                     0.6 – 0.7                   0.7 – 0.8
Liquids Production (MBbls/d)                                         4.4 – 4.8                     4.6                     2.6 – 3.0                   3.7 – 4.0
WTI Crude Oil Price Realizations (Pre-Hedge)                        90% – 95%                      93%                    90% – 95%                  90% – 95%
D&C CapEx ($MM)                                                    $15 – $20                      $14.7                  $13 – $17                   $60 – $70
Lease Operating Expense ($ Per BOE)                               $7.00 – $7.50                   $6.69                 $6.50 – $7.00               $6.50 – $7.00
Assumptions:
― The Company is reducing full year 2019 production guidance
― 4 wells are currently shut-in due to the quality specifications of the natural gas stream. The Company is exploring and testing a variety of solutions to treat the gas
   in order to meet quality specifications and bring the wells online
― Production associated with the 4 shut-in wells has been removed from guidance
― D&C activities are expected to resume August 2019

                                                                                   4
Second Quarter 2019 Review
                  CapEx Breakdown ($MM)                                                 Average Daily Liquids Production (MBbls/d)

    Full Yr 2019 CapEx Proj.                         2Q’19 Actual
                                                                             •   Despite temporarily suspending the D&C operations, production during
                                                                                 the quarter increased by 5% Boe/d and 11% Bo/d, as compared to
       $60MM – $70MM                                  $14.7MM                    1Q’19.
                                      Facilities &                                                                                           73%
                                      Workover                                                                         75%       72%       Liquids
                                                                                                                     Liquids
                                       $1.7MM                                         Oil     NGL         72%                  Liquids
                                                                                                                                           4.6
                                                                                                        Liquids
                   2H’19                                                                                             4.4       4.3
                 Projected                                                                      72%     4.0                                0.7               3.9
                 ~$20MM                                        2019               78%
                                                                                              Liquids                0.7       0.8
                                                                D&C              Liquids      3.4       0.7                                                  0.8
   1Q’19                                                      $5.0MM                                                                                 2.8
   Actual
            $60MM -                                                               2.7         0.8
                                                  2018
  $33.1MM    $70MM                                                                0.4                                                                0.6
                                                 DUC D&C
                2Q’19
                                                 $8.0MM                                                              3.7                   3.9
                                                                                                        3.3                    3.5
                Actual                                                                                                                                       3.1
                                                                                  2.3         2.6
               $14.7MM                                                                                                                               2.2

                                                                                 1Q'18A 2Q'18A 3Q'18A 4Q'18A 1Q'19A 2Q'19A 3Q'19 E                          YE19E
                                                                                                                                                            Mdpt.

                                      Historical Summary and Comparison of Key Metrics
                                                 2Q’18A             2Q’19A                  %Δ                FY18A              FY19E Mdpt.                %Δ
Oil Production (MBbls/d)                              2.6              3.9                  50%                    3.0                    3.1               3%
NGL Production (MBbls/d)                              0.8              0.7                 (13%)                   0.7                    0.8              14%
Liquids Production (MBbls/d)                          3.4              4.6                  35%                    3.7                    3.9               5%
WTI Crude Oil Price Realization (Pre-Hedge)          89%             93%                    4%                    82%                    93%               13%
CapEx ($MM)                                          $37.6          $14.7                  (61%)              $104.0                     $65.0             (38%)
Lease Operating Expense ($ per BOE)                  $6.83          $6.69                   (2%)                  $7.64                  $6.75             (18%)

                                                                         5
Operations / Technical Update

                                6
Operations / Technical Update

                  •   LLEX completed 3 of 5 2018 DUC’s to date – Haley #1H and #2H began flowing to sales in April 2019, the NE Axis #2H
                      began flowing to sales in June 2019
                  •   The 2 Kudu wells are scheduled for completion in September 2019 and are expected to flow to sales in 4Q’19
                  •   NE Axis #2H – IP24-hour rate of 2,455 Boe/d, 712 Bo/d (49% liquids, 29% oil), or 327 Boe/d per 1,000 lateral feet

  Operations      •   The company has contracted a rig and will resume drilling in 3Q’19 with the Grizzly A #2H being the first to spud in August
                      2019
  Overview
                  •   Focused on high IRR oil weighted prospects in the Wolfcamp B, Wolfcamp A, and 3rd Bone Spring formations throughout
                      2019
                  •   In July 2019, the Company temporarily shut-in 4 wells to remain compliant with state flaring regulations
                  •   To date, LLEX has installed artificial lifts on nine select wells to enhance performance and increase production, with two
                      additional wells targeted by the end of 3Q’19

                  •   4 wells are shut-in due to inadequate quality specifications in the natural gas stream. Processing capacity is not an issue
  Gathering &     •   We continue to independently evaluate a number of field treating options that have the potential to significantly improve
 Transportation       the quality of the natural gas and bring that production to sales
    Overview      •   LLEX expects to commence shipping crude on the newly built crude oil gathering system and flow a majority of its crude
                      oil through the gathering system in 3Q’19

                  •   Used operational downtime to deepen geological and engineering study of overall asset area

   Technical      •   Continue to identify and develop opportunities on the land front, including acreage swaps, acreage defense, and other
                      business development opportunities
   Overview
                  •   Monitor and evaluate offset operators, developing best practices for upcoming wells – including flowback, choke
                      management, completion parameters, and geologic targets

                                                                   7
Upcoming Well Status & Recent Well Results
                                                                 Upcoming Well Status
      Well Status            Target         Count                           Well Name                                    Lateral Length
                             WCA              1                     NW Axis #1H – Wolfcamp A                                1.5 mile
      Completions
                                              2                      Kudu A #2H – Wolfcamp B                               1.5 mile
       Operations
                             WCB              3                      Kudu B #2H– Wolfcamp B                                 1.1 mile
                                              4                     Grizzly A #2H – Wolfcamp B                              1.9 mile
Drilling Operations                           5                       Haley #3H – Wolfcamp A                                1.0 mile
                             WCA
                                              6                       Haley #4H – Wolfcamp A                                1.0 mile

                                   Recent Well Results                                                           Location Map
    Well Name       Target                                Commentary
                                  Newly Announced Well Results
                                                                                                                                        Lea
       NE Axis                1.5-mile Upper Wolfcamp A well
1                   WCA
         2H                     • 24-hr rate of 2,455 BOE/d or 712 BO/d (49% liquids)

        Oso                   1.5-mile Upper Wolfcamp A well                                                         2
2                   WCA
        1H                      • 24-hr rate of 910 BOE/d or 500 BO/d (65% liquids)                                             1
                                                                                                                                    5
                              1-mile spacing test Upper Wolfcamp A well
        Haley
3                   WCA         • 24-hr rate of 1,422 BOE/d or 317 BOE/d per 1,000 lateral ft. (90%
         1H
                                  liquids)
                                                                                                      Loving              Winkler
                              1-mile spacing test Upper Wolfcamp A well
        Haley
4                   WCA         • 24-hr rate of 1,048 BOE/d or 234 BOE/d per 1,000 lateral ft. (81%
         2H
                                  liquids)
                              Second 1.5-mile Wolfcamp A well                                                  3 4
      East Axis
5                   WCA         • 24-hr rate: 1,733 BOE/d or 223 BOE/d per 1,000 lateral ft. (54%
         2H
                                  liquids)

                                                                                  8
Appendix

           9
Total Proved Reserves
                                                        2Q’19 Reserve Report Summary (SEC Pricing) 1
                                              2Q'19 Total Net Reserves                                                                 PV-10 ($MM)
                                                                                                                                                      $359.7
                                Oil            Gas         NGL             Total      % of            PV10                             $327.8                     $337.3
           Category
                              (Mbbl)        (MMcf)       (Mbbl)           Mboe        Total           (SEC)
           PDP:                5,988         27,585       1,865           12,451      29%           $176,295
           PNP:                 976           2,600        224             1,633       4%            $22,952
          PUD:                15,985         50,745       4,371           28,814      67%           $138,006
       Total Proved           22,949         80,930       6,460           42,897      100%          $337,253
                                                                                                                               $68.8

                                                                                                                               YE17     YE18          1Q'19       2Q'19

                                                                                                                                        PDP     PNP      PUD

            Oil (MMBbls)                                Gas (MMcf)                                NGL (MMBbl)                             Total (MMBoe)

                                                                  85.1                              8.4
                           22.5     22.9                 78.7                  80.9                                                                       44.0         42.9
               21.2                                                                                          7.4                                 42.7
                                                                                                                         6.5

     7.2
                                                                                            1.6                                        11.5
                                                 16.1

     YE17     YE18         1Q'19    2Q'19        YE17    YE18    1Q'19     2Q'19         YE17       YE18    1Q'19    2Q'19             YE17      YE18     1Q'19    2Q'19

             PDP      PNP         PUD                   PDP     PNP      PUD                       PDP     PNP     PUD                          PDP     PNP      PUD

1)   Internally prepared                                                               10
Pro Forma Capitalization (unaudited) – Reducing Leverage and Increasing Liquidity
 Pro Forma Capitalization ($MM)
                     Sources                                                          Uses                                             •     Transaction proceeds have been used to reduce
 July '19 WI & ORRI Sale Proceeds                    $       39.0        RBL Repayment                      $        18.0                    debt and give LLEX flexibility to carefully manage
 WI Conveyance Proceeds                                                  Payables                           $        21.0                    drilling and completion operations in the second
 Total Sources                                      $        39.0        Total Uses                         $        39.0                    half of 2019, driving future growth organically
                                                                                                                                             under the existing one-rig program

                                                LLEX Capitalization                                                                                              Key Statistics
 ($MM)                                                                    6/30/19     PF Adj.               PF 6/30/19            Financial & Operating Metrics
 Cash & Cash Equivalents                                                 $      7.0 $        -              $      7.0            2Q'19 Annualized PF Adj. EBITDAX 2                         $43.5
                                                                                                                                  2Q'19 Average Production (MBOE/d)                            6.3
 Debt                                                                                                                             2Q'19 Proved Reserves (MMBOE)                               42.9
 Revolving Credit Facility                                               $      123.0 $           (18.0) $         105.0          2Q'19 Proved Dev. Reserves (MMBOE)                          12.5
                                                                                                                                  2Q'19 PV-10                                               $337.3
 Total Debt                                                              $      123.0 $           (18.0) $         105.0

 Equity 1                                                                                                                         2Q'19 Pro Forma Key Credit Statistics
                                                                                                                                                                                  2
 Series C Preferred Stock                                                $      141.4 $               -      $     141.4          Total Debt / 2Q'19 LQA PF Adj. EBITDAX                     2.4 x
 Series D Preferred Stock                                                        41.7                 -             41.7          Total Debt / Total Capitalization                         24.5%
 Series E Preferred Stock                                                        61.6                 -             61.6          RBL Facility % Drawn                                      91.3%
 Series F Preferred Stock                                                        56.6                 -             56.6          Total Debt / TP Reserves ($ / BOE)                        $2.45
 Common Stock                                                                   356.2                 -            356.2          Total Debt / PD Reserves ($ / BOE)                        $8.43
 Other Stockholders' Equity (Deficit)                                          (333.4)                -           (333.4)
 Total Equity                                                            $      324.2 $               -      $     324.2

 Total Capitalization                                                    $      447.2 $           (18.0) $         429.2                 RBL Repayment

 Liquidity
                                                                                                                                         •    $18MM BB repayment with transaction proceeds
 Cash & Cash Equivalents                                                 $        7.0 $              -   $           7.0                 •    Increases liquidity by $8MM
 (+) RBL Facility Capacity                                                      125.0             (10.0)           115.0                 •    Resulting debt balance of $105MM
 (-) RBL Facility Borrowings                                                   (123.0)             18.0           (105.0)                •    $10MM of BB capacity
 Total Liquidity                                                         $        9.0 $             8.0 $           17.0

1)    Preferred Stock values include accumulated PIK interest                                     11
2)    2Q’19 EBITDAX is reduced by approximately $480k from the reconciliation on slide 14 to give pro forma effect to the sold revenue interest from the ORRI in the quarter
Current Hedging Schedule(1,2) - July 26, 2019
                                                               Jul '19 - Dec '19     2020            2021            ✓ Approximately 80%, 75%, and 75% of
WTI Oil Hedges                                                                                                         PDP crude oil volumes are hedged in
Current Swap Volume (Bbl)                                                  15,915         376,153       135,068        4Q’19, 2020, & 2021 respectively
 Average Daily Swap Volume (Bbl/d)                                            173           1,028           370
 Average Price                                                             $58.80          $56.28        $53.07
Current Collar Volume Long Put (Bbl)                                      368,000         187,460       270,838
 Average Daily Collar Volume (Bbl/d)                                        2,000             513           742
 Average Price                                                             $53.75           49.50         50.00
Current Collar Volume Short Call (Bbl)                                    368,000         187,460       270,838
 Average Daily Collar Volume (Bbl/d)                                        2,000             513           742
 Average Price                                                             $67.35           63.87         59.70
Current Collar Volume Short Put (Bbl)                                     276,000                -               -
 Average Daily Collar Volume (Bbl/d)                                        1,500                -               -
 Average Price                                                             $45.00                -               -
 Average Crude Ceiling                                                     $67.02           $58.77          $57.49
 Average Crude Floor                                                       $53.95           $54.03          $51.02

NYMEX Natural Gas Hedges
Current Swap Volume (Mmbtu)                                             1,076,511        1,667,992      376,602
 Average Daily Swap Volume (Mmbtu/d)                                        5,836            4,551        4,184
 Average Price                                                             $2.660           $2.569        $2.77
Current Collar Volume Long Put (Mmbtu)                                    422,176        1,005,873    1,629,302
 Average Daily Collar Volume (Mmbtu/d)                                      6,923            2,758        4,452
 Average Price                                                             $2.800            $2.55        $2.20
Current Collar Volume Short Call (Mmbtu)                                  422,176        1,005,873    1,629,302
 Average Daily Collar Volume (Mmbtu/d)                                      6,923            2,758        4,452
 Average Price                                                             $3.060            $3.07        $2.97
 Average Gas Ceiling                                                        $2.77            $2.75        $2.93
 Average Gas Floor                                                          $2.71            $2.56        $2.30

Total Volume Hedged (Boe)                                                 633,696        1,009,257      740,223
 Average Daily Volume (Boe/d)                                               3,444            2,759        2,029
 Average Daily Oil Volume (Bbl/d)                                           2,086            1,541        1,113
 Average Daily Gas Volume (Mmbtu/d)                                         8,144            7,309        5,498

1.   Percentage hedged calculated prior to the ORRI sale and Non-Op WI conveyance
2.   Excludes Basis Hedges
                                                                                    12
Consolidated Statements of Operations

                                                                            For Three Months Ended
                                                                                    June 30,
                                                                     2019                        2018
   ($ in thousands, except share and per share data)
   Oil and gas revenue                                           $          21,572    $                    17,483
   Operating expenses:
      Production costs                                                       3,859                          2,984
      Gathering, processing and transportation                               1,235                            872
      Production taxes                                                       1,119                            821
      General and administrative                                             9,383                          7,380
      Depreciation, depletion, amortization and accretion                    9,188                          5,759
   Total operating expenses                                                 24,784                         17,816
   Operating loss                                                           (3,212)                          (333)
   Other income (expense):
      Other income (expense)                                                  (114)                             −
      Gain (Loss) from commodity derivative                                  2,901                         (2,802)
      Change in fair value of derivative instruments                             −                        (19,501)
      Interest expense                                                      (1,845)                        (8,572)
   Total other income (expense)                                                942                        (30,875)
   Net loss before income tax                                               (2,270)                       (31,208)
   Paid-in-kind dividends on preferred stock                                (6,375)                        (2,465)
   Net loss                                                      $          (8,645)   $                   (33,673)

   Net loss per common share:
   Basic                                                         $           (0.09)   $                     (0.53)
   Diluted                                                       $           (0.09)   $                     (0.53)

   Weighted average common shares outstanding:
   Basic                                                                91,012,030                      64,098,309
   Diluted                                                              91,012,030                      64,098,309

                                                            13
Non-GAAP Adjusted EBITDAX Reconciliation (Unaudited)
The following table provides a reconciliation of Net Income to the non-GAAP Adjusted EBITDAX for the three months ended June 30, 2018
and 2019 (please see the Disclaimer on slide 2):

                                                                                                                     For the Three Months Ended
                                                                                                                                   June 30,

                                                                                                                   2019                       2018
           Reconciliation of Adjusted EBITDAX:
                                                                                                         $
           Net income (loss)                                                                                            (2,270)        $          (31,208)
           Non-cash equity-based compensation                                                                             2,356)                     2,524)
           Interest expense, net                                                                                          1,845)                     8,572)
           Depreciation, depletion, amortization and accretion                                                            9,188)                     5,759)
           Loss (gain) from fair value changes of debt conversion and warrant derivatives                                      -                     19,501
           Unrealized loss (gain) from commodity derivatives, net                                                       (4,481)                       2,803
           Other expense (income), net                                                                                         -                          -
           842 Gain/Loss                                                                                                    115                           -
           Net cash settlement paid for commodity derivative contracts                                                         -                   (1,195)
           Non-recurring expenses (1,2)                                                                                    4,615                      1,497
                                                                                                         $
                Adjusted EBITDAX                                                                                          11,368       $              8,252

1) 2Q’19 includes non-recurring G&A expense comprised primarily of $1.9MM of advisory fees for strategic business projects and legal fees associated with de-
   leveraging and $1.7MM of severance payments.
2) 2Q’19 includes non-recurring LOE comprised of $0.5MM of well workover charges, $0.2MM for operating lease expense related to implementation of ASC 842,
   $0.1MM for contract labor and services, $0.1MM for fuel and power costs, and $0.1MM for miscellaneous other non-recurring LOE charges

                                                                                  14
Wobbe Ploegsma
                       VP of Capital Markets &
                             Investor Relations
                            ir@lilisenergy.com
                                 210.999.5400

NYSE American | LLEX
You can also read