ANALYST BRIEFING 22 FEBRUARY 2019 - REFINING NZ
←
→
Page content transcription
If your browser does not render page correctly, please read the page content below

REFINING NZ
                        ANALYST PRESENTATION

ANALYST BRIEFING
     22 FEBRUARY 2019
REFINING NZ
                                                                                                                                                                                                               ANALYST PRESENTATION

DISCLAIMER
•   This presentation contains forward looking statements concerning the financial condition, results and operations of The New Zealand Refining Company Limited (hereafter referred to as “Refining
    NZ”).
•   Forward looking statements are subject to the risks and uncertainties associated with the refining environment, including price and foreign currency fluctuations, production results, demand for
    Refining NZ’s products or services and other conditions. Forward looking statements are based on management’s current expectations and assumptions and involve known and unknown risks and
    uncertainties that could cause actual results, performance or events to differ materially from those expressed or implied in these statements.
•   Forward looking statements include among other things, statements concerning the potential exposure of Refining NZ to market risk and statements expressing management’s expectations, beliefs,
    estimates, forecasts, projections and assumptions. Forward looking statements are identified by the use of terms and phrases such as “anticipate”, “believe”, “could”, “estimate”, “expect”, “goals”,
    “intend”, “may”, “objectives”, “outlook”, “plan”, “probably”, “project”, “risks”, “seek”, “should”, “target”, “will” and similar terms and phrases.
•   Readers should not place undue reliance on forward looking statements. Forward looking statements should be read in conjunction with Refining NZ’s financial statements released with this
    presentation. This presentation is for information purposes only and does not constitute legal, financial, tax, financial product advice or investment advice or a recommendation to acquire Refining
    NZ’s securities, and has been prepared without taking into account the objectives, financial situation or needs of individuals. Before making an investment decision, you should consider the
    appropriateness of the information having regard to your own objectives, financial situation and needs and consult an NZX Firm or solicitor, accountant or other professional adviser if necessary.
•   In light of these risks, results could differ materially from those stated, implied or inferred from the forward looking statements contained in this announcement. Refining NZ does
    not guarantee future performance and past performance information is for illustrative purposes only. To the maximum extent permitted by law, the directors of Refining NZ,
    Refining NZ and any of its related bodies corporate and affiliates, and their offices, partners, employees, agents, associates and advisers do not make any representation or warranty, express or
    implied, as to accuracy, reliability or completeness of the information in this presentation, or likelihood of fulfilment of any forward-looking statement or any event or results expressed or implied in any
    forward-looking statement, and disclaim all responsibility and liability for these forward-looking statements (including, without limitation, liability for negligence).
•   Except as required by law or regulation (including the NZX Main Board Listing Rules), Refining NZ undertakes no obligation to provide any additional or updated information
    whether as a result of new information, future events or results or otherwise.
•   Forward looking figures in this presentation are unaudited and may include non-GAAP financial measures and information. Not all of the financial information (including any
    non-GAAP information) will have been prepared in accordance with, nor is it intended to comply with: (i) the financial or other reporting requirements of any regulatory body;
    or (ii) the accounting principles generally accepted in New Zealand or any other jurisdiction with IFRS. Some figures may be rounded and so actual calculation of the figures may differ from the
    figures in this presentation. Non-GAAP financial information does not have a standardised meaning prescribed by GAAP and therefore may not be comparable to similar financial information
    presented by other entities. Non-GAAP financial information in this presentation is not audited or reviewed.
•   Each forward looking statement speaks only as of the date of this announcement, 22 February 2019.

                                                                                                                                                                                                                                      2
REFINING NZ
                                          ANALYST PRESENTATION

                  AGENDA

                    OUR
              CUSTOMER PROMISE

    OUR                           OUR
PERFORMANCE                      VISION

                   OUR
                COMMITMENT
REFINING NZ
                                                                      ANALYST PRESENTATION

AGENDA

OUR PERFORMANCE   NPAT $30m impacted by first full refinery planned
                  shutdown in 14 years
OUR CUSTOMER
PROMISE           Second half, post shutdown, turns profit:
                  – strong operational performance
OUR COMMITMENT
                  – highest ever throughput
OUR VISION        – refining margins towards top of historic range
                  – weakening exchange rate

                  Improved health and safety performance in H2

                  4.5 cps fully imputed final dividend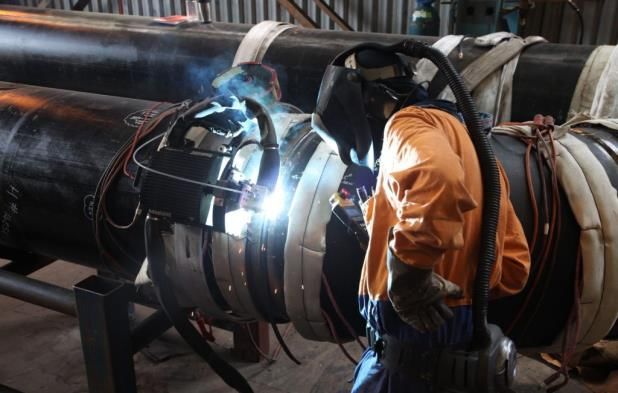
RESULTS IMPACTED
BY THE SHUTDOWN                                                                                                                                            REFINING NZ
                                                                                                                                                   ANALYST PRESENTATION

                                                                                                                                          FY 17           FY 18
                                                        Personal              LTIF [1,2]                                                    0.26            0.48
                                                                              Tier 1 (>US$25k) [2]                                               0                2
                                                        Process
                                     EBITDA                                   Tier 2 (>US$2.5k) [2]                                              4                3
  Gross Refining Margin

        6.31                               153
                                                        Releases outside consent                                                                 4                5
                            PER
  USD                       BARREL   NZD            M
  8.02 per barrel in FY17            220m in FY17       Throughput                                                          Mbbl            41.7            40.4
                                                        RAP Throughput                                                      Mbbl            19.8            21.0
                                                        Operational availability                                                %           98.0            90.7

                    $                                   Brent price                                                     US$/bbl                54              71

                                                        Free cash flow [3]                                                NZ$M               103             (58)
  Net profit after tax               TRCF [1,2]         Exchange rate                                                 US$/NZ$               0.71            0.69

  NZD   30
  79m in FY17
                        M            0.76
                                     0.89 in FY17
                                                        1
                                                        2
                                                            Per 200,000 hours, rolling 12-month
                                                            For a full definition please refer to Glossary in Appendix I.
                                                            See our Full Year Report for further detail, available at http://www.refiningnz.com/investor-centre.aspx
                                                        3   Free cash flow calculated as operating cash flow minus actual capital expenditures

                                                                                                                                                                          5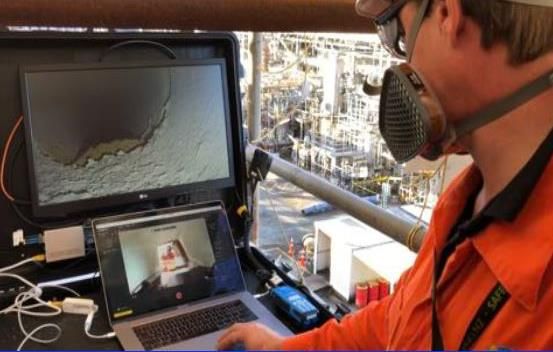
STRONG SECOND HALF TURNS PROFIT
                                                                                                                                                            REFINING NZ
                                                                                      Resulting in 4.5 cps fully imputed final dividend                ANALYST PRESENTATION

 NZ$M
  80

  70

  60

  50

  40

  30

                                           SHUTDOWN                     EXCHANGE                      MARGIN       DISTRIBUTION &   OPERATING
  20                                        IMPACT                        RATE                                     OTHER INCOME*     COSTS **

  10               79                        (43)                            6                        (12)              3             (3)       30
   0

                 NPAT                                                                                                                           NPAT
                 2017                                                                                                                           2018

        * Excludes insurance recoveries
        ** Includes RAP remediation costs net of insurance

        See our Full Year Report for further detail, available at http://www.refiningnz.com/investor-centre.aspx                                                              6
STRONG UNDERLYING
MARKET FUNDAMENTALS                                                                       Refining margin adjusted for shutdown at US$7.33 per barrel                                                        REFINING NZ
                                                                                                                                                                                                      ANALYST PRESENTATION

 US$/BARREL
 10
                                                                                                                                                                    UPLIFT                 2017     2018     Delta
                                                                                                                     8.02                                           US$/BARREL
  8
                                                                                                                                                       7.33
                                                                                                                                                                    Freight                1.79     1.93      0.14
                                                                                                                                                       1.02
  6                                                                                                                                                    6.31
               REFINING NZ MARGIN                                                                                    4.27
                                                                                                                                                                    Product quality        1.08     0.99     (0.09)
                                                                                                                                                       3.61
  4                                                                                                                  3.74
                                                                                                                                                       2.70         Plant availability     (0.30)   (1.02)   (0.72)
               SINGAPORE COMPLEX MARGIN*
  2
                                                                                                                                                                    Crude cost and yield   1.70     1.71      0.01

  0
                                                                                                                                                                    TOTAL                  4.27     3.61     (0.66)

 -2

 -4

               Freight                Product Quality                Plant Availability               Crude Cost & Yield

      * The Singapore Complex Margin is calculated using Platts Dubai crude and Singapore product prices, VLCC freight to Singapore, and the International Energy
        Agency’s Dubai complex refinery yields adjusted for fuel & loss.                                                                                                                                                     7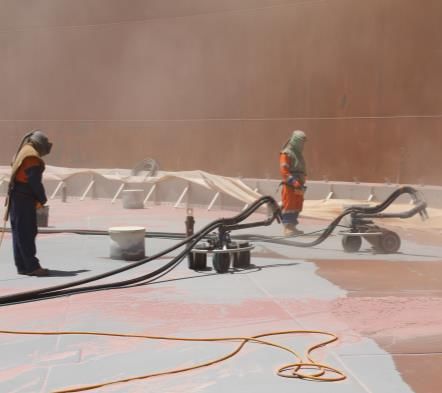
LOOKING AHEAD   Asian demand growth expected to outstrip capacity
                additions (at least until 2025)
                Global weakness in gasoline prices likely to continue in
                H1 2019 (caveat Chinese exports)
                Jet fuel and diesel demand expected to grow
                RNZ expects margin benefit from IMO market disruption

                Source: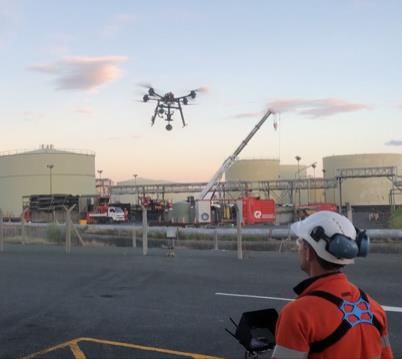
ASIAN DEMAND GROWTH EXPECTED TO                                                  Forecast supports refinery utilisation and margins –
OUTSTRIP CAPACITY ADDITIONS                                                      with caveats for IMO and Chinese exports                                                                           REFINING NZ
                                                                                                                                                                                               ANALYST PRESENTATION

   kb/d
   1,400                                                                                                                                                                                      90%

   1,200

                                                                                                                                                                                              88%
   1,000

     800
                                                                                                                                                                                              86%
     600

     400                                                                                                                                                                                      84%

     200

                                                                                                                                                                                              82%
          0

    -200
                                                                                                                                                                                              80%
    -400

    -600                                                                                                                                                                                      78%
              2010   2011       2012         2013         2014          2015         2016          2017         2018         2019          2020   2021   2022       2023        2024   2025

                                       Incremental CDU Capacity*                          Incremental Refinery Product Demand                             Refinery Utilisation (RHS)

  Source:               * Adjusted for possible delays to provide a more realistic assessment of the timing of future refining additions                                                                              9
FORECAST DEMAND VERSUS CAPACITY
ADDITIONS                                          RNZ has a processing bias to diesel/jet fuel                             REFINING NZ
                                                                                                                       ANALYST PRESENTATION

  Diesel/Jet fuel                                                    Petrol
  kb/d
  2,500
                                                         Supply
  2,000
                        IMO transition,
                                                         Demand
                        impact increasing
  1,500
                        from Q4 2019
                                                          Gap
  1,000

   500

     0

  -500

 -1,000

 -1,500
                 2019                       2020                               2019                    2020

          FGE expects changes from IMO to drive                       FGE expects price weakness to remain till mid-
          significant 2019/2020 demand growth                         2019 – thereafter recovering as refiners use
          outpacing new upgrading projects                            naphtha to meet middle distillate demand

   Source:                                                                                                                                10
IMO PRICE FORECASTS: DIESEL Expect disruption, but overall product cracks remain
INCREASE, FUEL OIL FALL supported REFINING NZ
ANALYST PRESENTATION
Singapore product prices vs Dubai crude
DIESEL / FUEL OIL
(product cracks)
US$/bbl
30
Price differential expected to widen
20
Diesel, 0.05% S
Benefits refiners with upgrading capacity (especially
10
Mogas (92 RONC) hydrocracking)
0.5% S Bunker Fuel Oil
0 NEW 0.5% SULPHUR BUNKER FUEL OIL
HSFO (380 cSt)
-10
Positive product cracks expected
-20
HIGH SULPHUR FUEL OIL
-30
-40 Product cracks expected to recover by 2023
Source: 11MARPOL – OUR STRATEGIES INCLUDE
REFINING NZ
ANALYST PRESENTATION
Produce 0.5% Increase bitumen
sulphur marine production by
fuel oil debottlenecking
existing plant
Expand our crude Improve logistics of
diet HSFO exports
122019 PROFIT MATRIX
REFINING NZ
ANALYST PRESENTATION
US$ EXCHANGE RATE
0.60 0.65 0.70 0.75 2019 HIGHLIGHTS
GRM
US$
(34) (46) (56) (65) No planned shutdowns
4.00
326 342 356 369
Higher volumes (~44 million barrels planned)
4 (10) (23) (34)
5.00
273 293 311 326
Operating costs include:
43 25 10 (3)
- resource consent renewal
6.00
220 244 265 283 - seed funding for new initiatives
81 61 43 27 - support for government inquiry, fuel market study
7.00
169 195 220 241 - increased electricity cost
120 96 76 58 - higher variable costs (volume driven)
8.00
131 154 174 198 Capital:
158 131 109 89 - Growth ($15-20 million)
9.00
92 119 142 161 - Other ($60-65 million)
44 Production, Mbbl
101 Non Processing Fee Revenue, $m
103 Depreciation, $m
13LONG TERM CAPITAL AND ASSET
MANAGEMENT PLAN PROGRESSING Capital efficiency via new technology and innovation REFINING NZ
ANALYST PRESENTATION
Engaged
- structured approach to long term strategic asset ROBOTIC WELDING TANK 13
management plan
- aligned to ISO 55000:2014
Shutdown and tank maintenance schedules driven
by statutory inspection requirement and
maintenance plans
Long term reduction in maintenance capital ROVER – IN-LINE INSPECTION
(< depreciation) through robust asset management AUTOMATED PAINTING
planning
Reprioritisation of capital in line with the recent
strategic review
ROVER DRONE
14SHUTDOWN LOOKAHEAD REFINING NZ
ANALYST PRESENTATION
2019
• No shutdowns
2020
• Crude Distillation Unit (CDU1)
• Hydrocracker Unit Top Bed Skim
• CCR Platformer
2021
CDU1
• Hydrocracker
CDU2 • Crude Distillation Unit (CDU2)
HDS3 Hydrocracker
CCR
2022
• Hydrocracker Unit Top Bed Skim[1]
[1] Potential optimization may eliminate need for this shutdown 15REFINING NZ
ANALYST PRESENTATION
AGENDA
OUR PERFORMANCE Short pay back projects delivering
OUR CUSTOMER Investing to support Auckland jet fuel resilience
PROMISE New opportunity to potentially lift RAP capacity a further 15%
OUR COMMITMENT Commissioning sulphur forming project in 2019
Dredging consented
OUR VISIONDELIVERING VALUE
REFINING NZ
ANALYST PRESENTATION
GRM
SHORT PAYBACK PROJECTS uplift
JET FUEL IMPORT FACILITY
USc/bbl
2017/2018 Completed Projects
2018 Completed Projects
Hydrogen optimisation 6 First tank conversion, import line,
filtering and dosing
Additional nitrogen storage 0.5
2019/2020 Projects
Variable speed drive on a key compressor 0.5
2019 Projects Second tank conversion
Light-naphtha bypass 3
Crude demulsifier pre-dosing 1
Increased RAP Automation 0.5
17DELIVERING VALUE
REFINING NZ
ANALYST PRESENTATION
PIPELINE SULPHUR FORMING
Capacity Facility under construction
Stages I and II delivered Commissioning Q4 2019
Trialling drag reducing agent (DRA) in Q3
DRA could increase pipeline capacity by
around 15%
Resilience
LIDAR
Mobile truck loading skids
EXAMPLE ONLY
18DREDGING CONSENTED
REFINING NZ
A major milestone for this margin enhancing initiative ANALYST PRESENTATION
Appeal to the Environment Court resolved
Conditions agreed by all parties
12 months of baseline water quality monitoring
Reviewing phasing of tank maintenance to accelerate
dredging
Current Final investment decision to be taken in 2019
GRM
Estimated cost $60-$70 million
GRM
increase
Expected GRM uplift USc/bbl 30+
FREIGHT
PRODUCT / CRUDE COST
PRODUCT CRUDE OIL CRUDE OIL
VALUATION CURRENT POST
VALUATION DREDGING
VALUATION
19REFINING NZ
ANALYST PRESENTATION
AGENDA
SUSTAINABILITY AND COMMUNITY
OUR PERFORMANCE
History of investment that also improves our environmental
OUR CUSTOMER footprint
PROMISE • Carbon intensity reduced by ~20% since 2008
OUR COMMITMENT • Reduction in on-site SO2 emissions by ~19% since
2006
OUR VISION • $24 million to improve resilience of waste water
systems
• Partnership with EECA on energy saving initiatives
Significant contributor to the Northland economy
Highly skilled workforceOUR ENVIRONMENT
REFINING NZ
ANALYST PRESENTATION
CO2 intensity
2008 2018
250 20%
A FOCUS ON OUR REDUCED TO
ENVIRONMENTAL
FOOTPRINT
~
KG CO2 / T PRODUCT
~ 200
HMU
Continued reductions in CO2 and SO2 emissions Tramp Air
H2 Reduction
Te Mahi system 2018
APC
BRU
Reduced carbon content of our sources of energy mix – 2017
natural gas
Point Compressor
Forward Hou HSU
Increase
Nat Gas
2017
2018
Investment continues- minimising impact on our local 2009 2015
reconfig
VSD
on C252
community 2015 2018
7% 10% 3%
~$190m ~$365m ~$2m
* First year post Future Fuels commissioning 21OUR PEOPLE – SAFETY AND
REFINING NZ
WELLBEING ANALYST PRESENTATION
609
Highly skilled workforce
Improved health and safety performance in second half of 2018
Our H&S metrics compare well in a NZ context, but we aspire to
continue to improve [1]
Implementation of DuPont process safety audit recommendations
Safety Case submitted to WorkSafe
Employees and contractors
2018
[1] 2017 Benchmarking Report of the Business Leaders’ Health & Safety Forum
22OUR COMMUNITY
REFINING NZ
ANALYST PRESENTATION
COMMUNITY SUPPORT RNZ
contributes
Lifted community almost
engagement – Safety Case
SUPPORTING NEW LEARNING
presented to community
Initiated $120K in
scholarship program for local
STEM students
7 %per annum
of Northland's GDP [1]
Increase
from ~4.5%
in 2006
Strong engagement with our
local Iwi, Patuharakeke
RNZ SCHOLARS EMERGENCY RESPONSE 26 emergency exercises
conducted in 2018 -
involving local and national
agencies
Our industrial fire brigade
responded to ~85 community
callouts in 2018
MARAE REFURBISHMENT
[1] www.infometrics.co.nz 23REFINING NZ
ANALYST PRESENTATION
AGENDA
OUR PERFORMANCE RNZ brings substantial capability to NZ’s 2050 renewable
energy and growth agenda:
OUR CUSTOMER – safe, reliable and efficient infrastructure
PROMISE
– deep scientific and technical capability
OUR COMMITMENT – robust balance sheet
OUR VISION – good reputation and community support
This is the starting point for our new strategyREFINING NZ
ANALYST PRESENTATION
Our new realistic strategy will:
STRATEGIC DIRECTION
- retain profitable refining at the core
- harness natural resources
- leverage existing capabilities and assets
- confirm our role in energy transition
- remain committed to commercial return and
shareholder value
Strategic update in Q2/Q3REFINING NZ
ANALYST PRESENTATION
APPENDIX 1
Glossary
• LTIF - Lost time injury frequency (rolling 12 month per 200,000 hours)
• TRCF - Total recordable case frequency (rolling 12 month per 200,000 hours)
• Tier 1 Process Safety Event (API 754) - A tier 1 Process Safety Event (PSE) is
an unplanned or uncontrolled release of any material, including non-toxic and
non-flammable, from a process which results in one or more of the following: A
LTI and/or fatality; A fire or explosion resulting in greater than or equal to
$25,000 of direct cost to the company; A release of material greater than the
threshold quantities given in Table 1 of API 754 in any one-hour period; A
officially declared community evacuation or community shelter-in-place.
• Tier 2 Process Safety Event (API 754) - A tier 2 Process Safety Event (PSE) is
an unplanned or uncontrolled release of any material, including non-toxic and
non-flammable, from a process which results in one or more of the following: A
recordable injury; A fire or explosion resulting in greater than or equal to $2,500
of direct cost to the company; A release of material greater than the threshold
quantities given in Table 2 of API 754 in any one-hour period.
26REFINING NZ
ANALYST PRESENTATION
ANALYST BRIEFING
22 FEBRUARY 2019You can also read