ZOOPLUS AG INVESTOR PRESENTATION - DR. CORNELIUS PATT, CEO ANDREAS MAUERÖDER, CFO

Page created by Herbert Robertson
 
CONTINUE READING
ZOOPLUS AG INVESTOR PRESENTATION - DR. CORNELIUS PATT, CEO ANDREAS MAUERÖDER, CFO
ZOOPLUS AG
INVESTOR PRESENTATION
DR. CORNELIUS PATT, CEO
ANDREAS MAUERÖDER, CFO
September 2020
ZOOPLUS AG INVESTOR PRESENTATION - DR. CORNELIUS PATT, CEO ANDREAS MAUERÖDER, CFO
DISCLAIMER

This document includes supplemental financial measures that are or may be non-GAAP financial measures. These supplemental financial
measures should not be viewed in isolation as alternatives to measures of zooplus’ financial condition, results of operations or cash flows
as presented in accordance with IFRS in its Consolidated Financial Statements. Other companies that report or describe similarly titled
financial measures may calculate them differently.

This document contains statements related to our future business and financial performance and future events or developments involving
zooplus that may constitute forward-looking statements. We may also make forward-looking statements in other reports, in presentations,
in material delivered to stockholders and in press releases. In addition, our representatives may from time to time make oral forward-
looking statements. Such statements are based on the current expectations and certain assumptions of zooplus’ management, and are,
therefore, subject to certain risks and uncertainties. A variety of factors, many of which are beyond zooplus’ control, affect zooplus’
operations, performance, business strategy and results and could cause the actual results, performance or achievements of zooplus to be
materially different from any future results, performance or achievements that may be expressed or implied by such forward-looking
statements or anticipated on the basis of historical trends. Further information about risks and uncertainties affecting zooplus is included
throughout our most recent annual and interim reports, which are available on the zooplus website, investors.zooplus.com. Should one or
more of these risks or uncertainties materialize, or should underlying assumptions prove incorrect, actual results, performance or
achievements of zooplus may vary materially from those described in the relevant forward-looking statement as being expected,
anticipated, intended, planned, believed, sought, estimated or projected. zooplus neither intends, nor assumes any obligation, to update or
revise these forward-looking statements in light of developments which differ from those anticipated.

Due to rounding, numbers presented throughout this and other documents may not add up precisely to the totals provided and
percentages may not precisely reflect the absolute figures.

                                                                                              ZOOPLUS AG | INVESTOR PRESENTATION | SEPTEMBER 2020   2
ZOOPLUS AG INVESTOR PRESENTATION - DR. CORNELIUS PATT, CEO ANDREAS MAUERÖDER, CFO
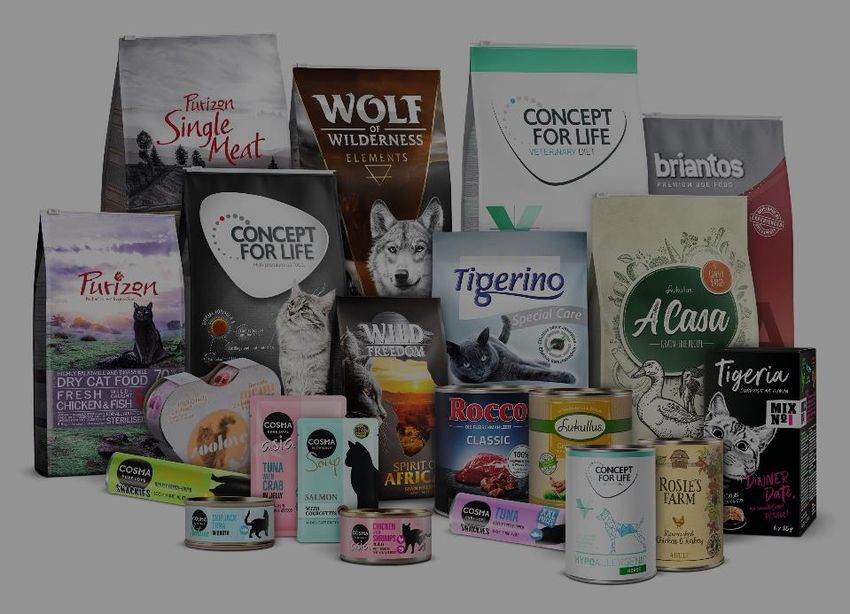
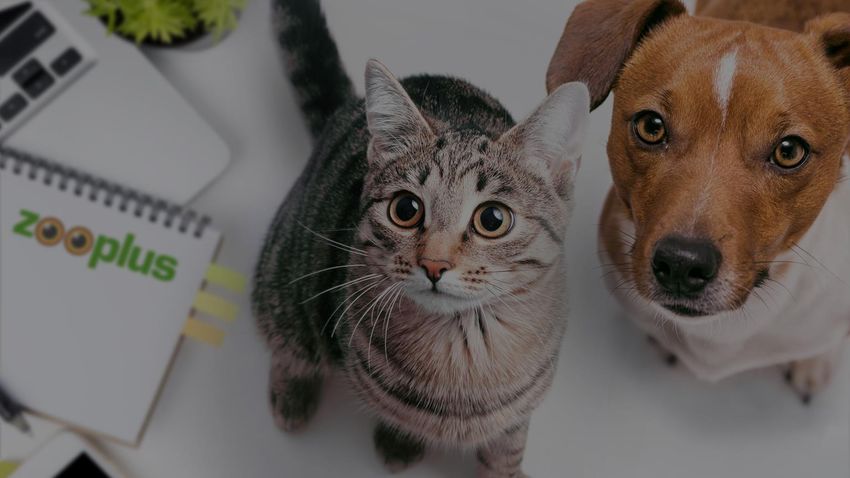
ZOOPLUS AG A LEADING PLAYER IN THE BOOMING
PET SUPPLIES CATEGORY

                                                                                       ✓ Number one online retailer in
                                                                                         Europe and second in total market 1
                                                                                       ✓ EUR 1.5 bn in sales (2019)

                                                                                       ✓ 95% revenue retention rate 2

                                                                                       ✓ 8.1 million active customers 2

                                                                                       ✓ Digital offering for pet owners in
                                                                                         30 countries and 24 languages

1) in terms of sales and active customer base; 2) as of end of H1 2020, based on LTM

                                                                                                   ZOOPLUS AG | INVESTOR PRESENTATION | SEPTEMBER 2020   3
ZOOPLUS AG INVESTOR PRESENTATION - DR. CORNELIUS PATT, CEO ANDREAS MAUERÖDER, CFO
20+ years into the business, we know what we stand
for – Our USPs

       Specialist retailer               Customer benefits first

       100% ecommerce                    Efficiency-driven

       Product=Data+Tech driven          Strategic Partner

       Pan-European                      Governance compliant

                                               ZOOPLUS AG | INVESTOR PRESENTATION | SEPTEMBER 2020   4
ZOOPLUS AG INVESTOR PRESENTATION - DR. CORNELIUS PATT, CEO ANDREAS MAUERÖDER, CFO
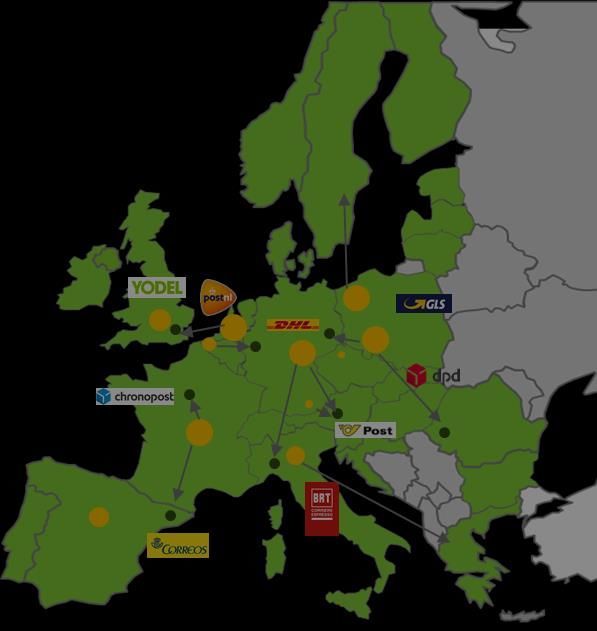
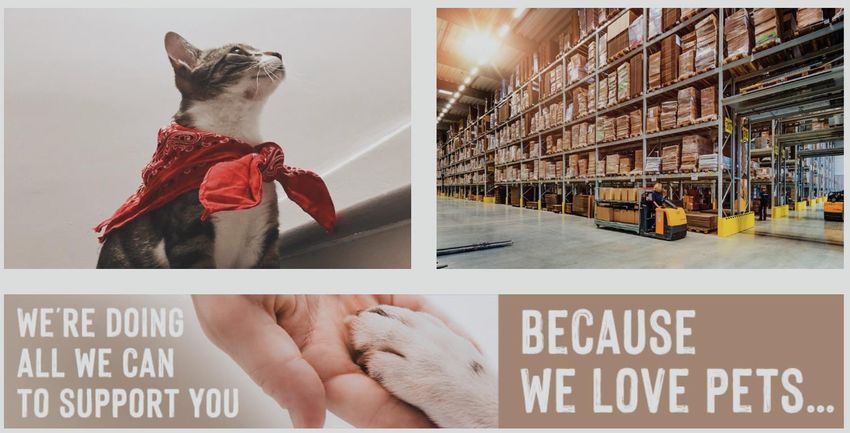
ZOOPLUS IS THE DEDICATED PET SPECIALIST THAT CARES

                                       ZOOPLUS AG | INVESTOR PRESENTATION | SEPTEMBER 2020   5
ZOOPLUS AG INVESTOR PRESENTATION - DR. CORNELIUS PATT, CEO ANDREAS MAUERÖDER, CFO
MEGATRENDS ARE FUELING GROWTH PROSPECTS IN
PET SUPPLY CATEGORY

     GROWING PET POPULATION
     Over 80m households in Europe with
     one pet or more

     HUMANIZATION OF PETS
     Pets are increasingly viewed as a
     family member with spend per pet
     increasing
                                                »   HUGE COMMERCIAL
                                                     OPPORTUNITY IN
                                                          PETS
     SPECIALIZED PET NUTRITION
     Premiumisation trend in pet food driving
     specialty trade to grow faster than
     grocery segment
                                                     ZOOPLUS AG | INVESTOR PRESENTATION | SEPTEMBER 2020   6
ZOOPLUS AG INVESTOR PRESENTATION - DR. CORNELIUS PATT, CEO ANDREAS MAUERÖDER, CFO
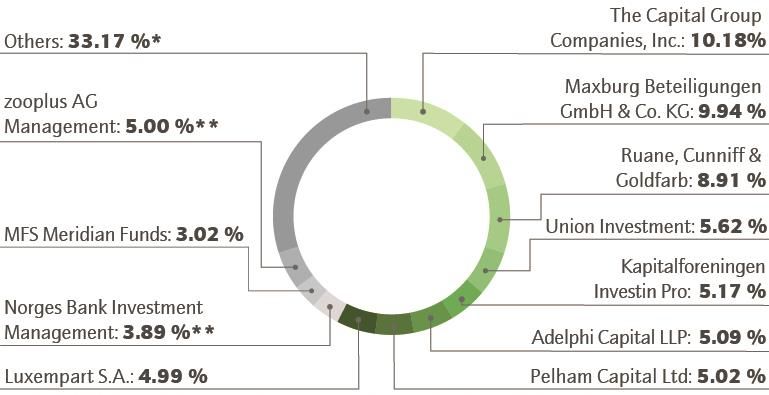
PET SUPPLIES RETAIL LANDSCAPE IN EUROPE
COMPETITION FALLS INTO THREE CATEGORIES
                    We‘re operating in a highly fragmented market
  ONLINE PURE PLAY                  MASS GENERALIST             BRICKS AND MORTAR                      REGIONAL ONLINER

✓ Valuable industry partner    − Limited access to premium    − Online offering competing          − Low scale advantages
  to suppliers                   brands                         with physical store
                                                                                                   − Pricing is only USP
                                                                presence
✓ Ideally positioned to        − Supporting digitization of
                                                                                                   − High operating cost
  capture growing online         category                     − High CAPEX requirements
  share                                                                                            − Low logistics / FC capacity
                               − Low offering overlap: only   − Low logistics / FC capacity
✓ Low CAPEX requirements         20% of zooplus Top 500                                            − Mostly no own brands
  and significant scale          Sellers available on         − High dependancy towards
  advantages                     amazon prime                   own white label products

✓ Strong logistics network     − High e-commerce and          − Low e-commerce
                                 logistics competencies         competencies
✓ Own brand portfolio adds
  to differentiation and
  supports incremental value
  creation
                                                                                 ZOOPLUS AG | INVESTOR PRESENTATION | SEPTEMBER 2020   7
ZOOPLUS AG INVESTOR PRESENTATION - DR. CORNELIUS PATT, CEO ANDREAS MAUERÖDER, CFO
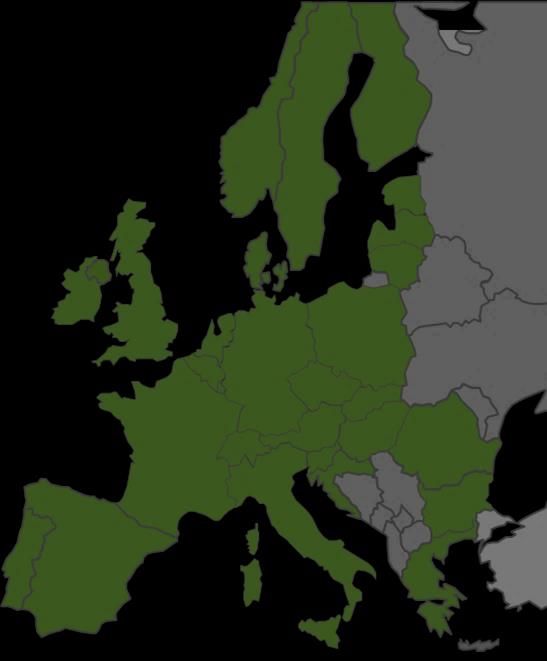
ZOOPLUS AG IS DOMINATING THE EUROPEAN
ONLINE SPACE FOR PET SUPPLIES

                                                                                                         channel shift still ongoing

                                                                                                        16%
                                                                                                        online

       € 25bn                                                                                      

                                                                                                   
                                                                                                        Pet Supplies still underrepresented in the online sphere
                                                                                                        compared to other categories
                                                                                                        zooplus is an important retail partner in Europe for brands
                                                                                                        and driving digitization of category
               market opportunity                                                                      Market is resilient to economic cycles
                  in Europe1                                                                           Highly recurring and fast turnover of product due to
                                                                                                        constant demand
                         » CAGR ~3% p.a.
                                                                                                       Low return rates and future growth prospects make for an
                                                                                                        attractive category to operate in
1) total net market for pet supplies in Europe = online + offline market, based on Euromonitor International 2020 and management estimates
                                                                                                                                             ZOOPLUS AG | INVESTOR PRESENTATION | SEPTEMBER 2020   8
ZOOPLUS AG INVESTOR PRESENTATION - DR. CORNELIUS PATT, CEO ANDREAS MAUERÖDER, CFO
ZOOPLUS OFFERS A UNIQUE CUSTOMER PROPOSITION
IN EUROPE AND AN EXCELLENT CONSUMER EXPERIENCE

  ACESS TO ALL
                   BEST VALUE FOR SEAMLESS SHOPPING     DEDICATED               FAST & CONVENIENT
LEADING PREMIUM
                  MONEY & REWARDS    EXPERIENCE       CUSTOMER CARE                  DELIVERY
    BRANDS

       our key drivers for consumer satisfaction in a digital world
                                                         ZOOPLUS AG | INVESTOR PRESENTATION | SEPTEMBER 2020   9
ZOOPLUS AG INVESTOR PRESENTATION - DR. CORNELIUS PATT, CEO ANDREAS MAUERÖDER, CFO
ZOOPLUS IS THE ONLY CATEGORY SPECIALIST
WITH A PAN-EUROPEAN LOGISTICS NETWORK
                                                                                      Fulfillment center (FC)
SCALE ADDING TO RESILIENCE ADVANTAGE OF ZOOPLUS IN COVID-19 TIMES                     Hubs (DSP) - shown are selected
                                                                                      relations from FC to Hub of DSPs

       TECH DRIVEN CAPACITY & REPLENISHMENT

       FCs RUNNING AT FULL OUTPUT

       SHELF SPACE FOR STOCKING UP

       PRODUCT AVAILABILITY

       COMPETITIVE DELIVERY TIME

11 fulfillment centers across Europe operated by partners with low CAPEX requirement
                                                       ZOOPLUS AG | INVESTOR PRESENTATION | SEPTEMBER 2020      10
COVID-19 AND PET SUPPLIES CATEGORY IN EUROPE
TACTICAL IMPACT ON BUSINESS

                                         Organic Traffic
Helped us temporarily reduce our ad        Paid Traffic

    spend without losing reach

   Served as a push for first-time
 e-commerce usage in our category

  Consumption patterns remained
    unchanged in our category

                                                                         OPEN
 Offliners were classfied as essential
    and did not go out of business

                                                           ZOOPLUS AG | INVESTOR PRESENTATION | SEPTEMBER 2020   11
KEY FINANCIAL HIGHLIGHTS – STRONG PERFORMANCE IN
H1 2020
              SALES (in EUR m)                                    EBITDA (in EUR m, in % of sales)
                                               862
                        727                            +19%
  643                                                  vs. PY
                                +13%
          +24%                  vs. PY                                                                   29.4
           vs. PY
                                                                                                          +3.4%
                                                                                   +0.6%
                                                                  -0.8%
                                                                                    4.5

 H1 2018            H1 2019                  H1 2020              -5.0
                                             1,765               H1 2018         H1 2019               H1 2020
                        1,524                         +16%E                                             ≥40.0
  1,342                                                 vs. PY
                                +14%
          +21%                  vs. PY                                                                   +2.3%E
           vs. PY
                                                                                   +0.8%
                                                                  +0.6%
                                                                                   11.8
                                                                  8.6

 FY 2018            FY 2019                 FY 2020E             FY 2018         FY 2019              FY 2020E
   New Customer Sales                Existing Customer Sales               ZOOPLUS AG | INVESTOR PRESENTATION | SEPTEMBER 2020   12
STRATEGIC BUSINESS KPIS – ALL INDICATORS
SIGNIFICANTLY IMPROVED IN H1 2020

                                     1)
                                                           H1 2018   H1 2019   H1 2020
                                                                                                    Revenue Retention and NC
                                                                                                     2nd Order Sales are the key
Revenue Retention Rate                                       94%      92%       95%                  contributors to sustainable
                                                                                                     top line growth
New Customer 2nd Order Sales                                +20%      -8%       +21%
                                                                                                    Customer Acquisition Cost
Customer Acquisition Cost (in €)                              11       16        10
                                                                                                     significantly reduced
Own Brands Share (% of food Sales)                           14%      15%       17%
                                                                                                    Own Brands Share is a key
Gross Margin (% of Sales)                                   27.7%    28.4%     30.5%                 driver for Gross Margin

Basket Size (in €)                                            54       55        57                 Basket size increase is
                                                                                                     helpful for operational
Operational Efficiency               1) (in % of Sales)     22.0%    21.0%     20.8%                 efficiency

1) Logistics costs + payment costs + customer care costs
                                                                                         ZOOPLUS AG | INVESTOR PRESENTATION | SEPTEMBER 2020   13
BETTER NEW CUSTOMER QUALITY IN H1 2020
TRANSLATES INTO SUSTAINABLE GROWTH

     Repeat purchasing                                                                                                   Key lesson taken from 2019 – we
                                                                    H1 2019                       H1 2020
            new accounts 1)                                                                                               need to focus on quality customers.
                                                                                                                          Only repurchasing accounts
          Sales                                                       -8%                          +21%                  contribute to future growth

          Accounts                                                    -4%                          +14%                 Improved early stage cohort
                                                                                                                          behavior compared to H1 2019
          Sales per Account                                           -5%                            +6%                 cohort reflects revised acquisition
                                                                                                                          channel mix, unbiased customer
          Share of new                                                 28%                            32%                value proposition and better use of
           accounts with
           repeat purchases
                            2)                                                                                            loyalty & retention tools

                                                                                                                         Sales volume from 2nd order on with
                                                                                                                          strong increase – both driven by
                                                                                                                          loyalty and basket size
1)At least one consecutive order
2) Of all new accounts, note - only limited opportunity for repurchases after 6 months into the year of acquisition
                                                                                                                          ZOOPLUS AG | INVESTOR PRESENTATION | SEPTEMBER 2020   14
ZOOPLUS HAS A GROWING LOYAL CUSTOMER BASE
AND A HIGH REVENUE RETENTION RATE
                       ACTIVE CUSTOMER BASE1 (in k)

                                                                        8,062
                            7,195                                                    +12%

                           H1 2019

                ACTIVE REPEAT CUSTOMER BASE 2 (in k)
                                                                       H1 2020

                                                                        4,781
                                                                                                                95%
                                                                                                                Revenue Retention
                                                                                     +16%                            Rate3
                            4,117

                           H1 2019                                     H1 2020
1)All customers with one order in LTM;
2) All customers with one consecutive order (=at least 2 orders) in LTM; 3) Sales retention 12 months rolling
   (net, non-BMF); All figures based on H1 2020 figures                                                          ZOOPLUS AG | INVESTOR PRESENTATION | SEPTEMBER 2020   15
OUR NEW STRATEGY BALANCES
   CUSTOMER QUALITY, SCALING AND EFFICIENCY
   SPEND ON CUSTOMER ACQUISITION AND LOYALTY (AS % OF SALES)

                                                                                           Massive increase in new business
                                 5.9%
                                                                                            acquisition efficiency: budget at
                                                                                            50%, with new business at 120%
                                                                                            of PY
            Traffic                                               4.2%
         Acquisition             3.3%                                                      Tactical situation in months March,
                                                       3.8%
                                                                                            April and May helped efficiency
                                                                   1.7%
                                                                                 1.9%
  New Customer 1)                                                                          91% → 95% revenue retention
       Discount                  0.5%                              0.2%                     increase driven by quality focus
                                                                                            and better use of retention and
Repeat Customer 2)
                                 1.7%                              1.7%                     loyalty tools
        Discount                                       2.1%                      2.3%
 Loyalty Program                 0.4%                              0.6%                    Main driver for growth:
                                                                                            consistently positive customer
                         2019 / EUR 727 m                     2020 / EUR 862 m
                                                                                            experience throughout Q1 & Q2
   1) New: Starter coupons; 2) Repeat: SaverPlan discounts
                                                                                            ZOOPLUS AG | INVESTOR PRESENTATION | SEPTEMBER 2020   16
LOYALTY PROGRAMS DRIVING CUSTOMER
RETENTION AND REPURCHASE RATE

        SaverPlan

                                   - €3m
      Best Value for Money

        zooPoints

 Interactive Shopping Experience

      zooplus APP

Multi-platform Shopping Experience

                                           ZOOPLUS AG | INVESTOR PRESENTATION | SEPTEMBER 2020   17
SALES VOLUME INCREASED BY EUR 136 m VS. H1 2019 –
GROWTH PATH CONTINUED IN Q2 2020
SALES (in EUR m)

                                   vs. H1 2019
                                                                                               zooplus continued to benefit from
                                          +19%                                                  strong online demand and high
                                                             440             423
                                                 419                                            loyalty of existing customers
   363             363           378
                                                                                               Strong y-o-y development affirms
                                                                 +21%              +16%         successful efforts on improving
                                                                   vs. PY          vs. PY
                                                                                                customer activation and sales
      +13%            +14%          +14%          +14%                                          retention combined with solid
         vs. PY        vs. PY       vs. PY         vs. PY                                       sales execution

                                                                                               High growth of accessories sales
                                                                                                (+32% vs. Q2 2019) proves
                                                                                                success of the active steering of
                                                                                                the product sales mix meeting
                                                                                                increased customer demand in Q2
  Q1 2019         Q2 2019       Q3 2019      Q4 2019        Q1 2020         Q2 2020

                                                                                                ZOOPLUS AG | INVESTOR PRESENTATION | SEPTEMBER 2020   18
ZOOPLUS IS THE ONLINE MARKET LEADER IN EUROPE
AND IS GAINING SHARE FROM OFFLINE
TOTAL MARKET SHARE1                                        ZOOPLUS SALES BY REGION IN H1 2020 (in EUR m)

      8%                                      DACH                                                                                  246                                         +17%

      6%                                            FR                                              142                                             +19%

      9%                               BENELUX                                          95                            +15%
                                                                                                                                                  Pet supplies market1
      14%2                                          PL                             80                        +25%
                                                                                                                                          EUR 25.3 bn
      4%                                             IT                        71                       +24%

       3%                                     UK, IE                           69                     +20%

      5%2                                        CEE                          61                 +25%
                                         other than PL

       6%                               NORDICS                          51                  +13%

       5%                                     ES,PT                      49                  +14%
1)Total net market = online + offline market, based on Euromonitor International 2020 and management estimates as of June 2020 in relation to zooplus FY 2019 sales figures;
2) change vs . prior disclosure due to updated market data reflecting an overall larger total market in Poland and CEE; zooplus continues         ZOOPLUS AG | INVESTOR PRESENTATION | SEPTEMBER 2020   19
to outperform total market growth in respective markets.
GROSS MARGIN FURTHER IMPROVED IN Q2 2020 –
STRONG INCREASE COMPARED TO PY
GROSS MARGIN1

                                                       vs. H1 2019
                                                                                                        Sustainable increase in margin in
                                                            +2.1%p
                                                                                       31.6%             food segment driven by active
                                                               30.2%     29.4%                           management of product sales
       28.2%               28.7%                28.7%
                                                                                                         mix
                                                                             +1.2%p        +2.9%p       Surge in demand for accessories
                                                                              vs. PY        vs. PY
                                                                                                         in Q2 and the continued trend
                                                                                                         towards own brand sales driving
                                                                                                         gross margin improvement

                                                                                                        Solid yield management focusing
                                                                                                         on loss leaders (avoidance)
                                                                                                         supports positive development of
                                                                                                         gross margin
      Q1 2019             Q2 2019              Q3 2019         Q4 2019   Q1 2020       Q2 2020

1) Gross margin = sales – cost of goods (as a % of sales)
                                                                                                         ZOOPLUS AG | INVESTOR PRESENTATION | SEPTEMBER 2020   20
OWN BRANDS PORTFOLIO CONTINUES TO
OUTPERFORM TOTAL FOOD AND LITTER SALES
OWN BRAND SALES & SALES SHARE FOOD & LITTER (in EUR m)

                      vs. H1 2019
                             +32%
                                                64         64
                                      61
                        52
  48         49                                              17.9%
                                      16.7%      16.5%                  High-margin business in the
                                                                         mid to premium segment
                         15.9%
              15.6%                                                      contributing to gross margin
   15.3%
                                                                         expansion

                                                                        Growth index own brands / food
                                                                         2.2 in Q2 2020 (H1 2020: 1.7)

Q1 2019    Q2 2019    Q3 2019       Q4 2019   Q1 2020    Q2 2020

                                                                         ZOOPLUS AG | INVESTOR PRESENTATION | SEPTEMBER 2020   21
STRONG INCREASE OF BASKET VALUE –
DRIVER FOR LOGISTICS EFFICIENCY
AVERAGE BASKET VALUE (NON-BMF; in EUR)

                                                                         Successful upselling measures
                                                                          and incentives drive basket value
                                                         57.2             in H1 2020. Accessories sales
                                                                          make a helpful contribution
                                                            +2.4 €
                                                             vs. PY
                                                                         Bigger baskets correlate
                                                                          positively with repurchase
                                           55.6                           likelihood
                        55.2
                                                                         Increased basked value with
          54.2                   54.8         +0.4 €
                                               vs. PY                     positive impact on logistics cost
                                                                          efficiency – Price increases in
                                                                          delivery and additional logistics
                                                                          cost related to protective COVID-
                                                                          19 measures fully compensated
      H1 2018         H2 2018   H1 2019   H2 2019       H1 2020

Based on order date                                                       ZOOPLUS AG | INVESTOR PRESENTATION | SEPTEMBER 2020   22
COST EFFICIENT OPERATION CREATING MOAT
FOR ONLINE AND OFFLINE COMPETITORS
COST STRUCTURE (in % of SALES)

                    Ad./Marketing                   3.3%                              Reduced marketing spend vs. PY –
                                                                          1.7%
                                                                                       back in efficient territory while
                                                                                       increasing new business intake

                                                                                      Larger baskets prompting for higher
                            Logistics            18.4%                   18.1%         value per parcel, offsetting additional
                                                                                       cost for higher FC capacity
                           Payment 1
                                                    1.1%                  1.1%

                            IT/Admin
                                                    1.9%                  2.5%
                                          2
                                                                                      Increase in IT/ Admin cost base
                    Personnel
                                                   3.5%                   3.7%         reflecting higher non-operating
             FX gains & losses
                                                   0.0%                  0.2%          expenses for strategic projects
                                                  H1 2019                H1 2020

1) Impairment expenses on financial assets reclassified to payment
                                                                                       ZOOPLUS AG | INVESTOR PRESENTATION | SEPTEMBER 2020   23
2) Including LTI & SOP; own work capitalized reclassified to personnel
EBITDA DRIVEN BY PRODUCT MIX & COST EFFICIENCY,
SOLID FREE CASHFLOW IN H1 2020
EBITDA (in EUR m)                             CASH FLOW H1 2020 (in EUR m)
                    +24.9                                         +22.7

                                      3.4%

                                     29.4                                        29.6

         0.6%
                                                      6.9
         4.5

       H1 2019                      H1 2020         H1 2019                    H1 2020

     % values: EBITDA margin (of sales)
                                                              ZOOPLUS AG | INVESTOR PRESENTATION | SEPTEMBER 2020   24
STRONG FREE CASHFLOW GENERATION UNDERLINES
OWN FINANCING CAPABILITIES OF ZOOPLUS
CLEAR PRIORITIES FOR CASH: FUEL FUTURE GROWTH

  1        REINVEST INTO CUSTOMER GROWTH & CUSTOMER LOYALTY

  2          REINVEST INTO STOCK AND PRODUCT AVAILABILITY

  3          REINVEST INTO ENHANCING CUSTOMER EXPERIENCE

                                                      ZOOPLUS AG | INVESTOR PRESENTATION | SEPTEMBER 2020   25
GUIDANCE 2020
(Updated on July 14, 2020)
UPDATED FINANCIAL YEAR 2020 OUTLOOK –
ZOOPLUS INCREASES TARGETS DUE TO RESILIENT DEMAND
SALES GROWTH (in EUR m)                   EBITDA (in EUR m)

                     approx. 240 m                               at least 40 m

         225 m

                                            at least 20 m

           2020            2020E                2020                   2020E
       May 7, 2020        July 14, 2020      May 7, 2020             July 14, 2020

         UPDATED THE FINANCIAL YEAR 2020 OUTLOOK ON JULY 14, 2020
                                                              ZOOPLUS AG | INVESTOR PRESENTATION | SEPTEMBER 2020   27
SHAREHOLDER STRUCTURE

As of July 29, 2020; Calculation based on a total number ov voting rights of 7,149,178; Share ownership according to published voting rights notifications;
Free float of 90.06% according to the definition of Deutsche Börse: ** including equity instruments

                                                                                                                                                       ZOOPLUS AG | INVESTOR PRESENTATION | SEPTEMBER 2020   28
ZOOPLUS AG: THE DEDICATED PET SPECIALIST
REASONS TO INVEST IN ZOOPLUS AG

(1)      Leading player in the resillient pet supplies category and a booming pet market

(2)      Dominating the European online space – only retailer present in 30 countries

(3)      Pet care is expected to prove resistant to the recession created by COVID-191

(4)     Fast growing additional ‚best value for money‘ own brands business next to
       classical brand retail

(5)      Revenue Retention Rate of 95% with an extremly loyal customer base

(6)      Strong free cashflow generation and self-financing capabilities

(7)      Underlying business is structurally profitable

1)Euromonitor International Pet Care Quarterly Statement Q3 2020; Passport Report August 2020   ZOOPLUS AG | INVESTOR PRESENTATION | SEPTEMBER 2020   29
IR CONTACT & FINANCIAL CALENDAR

 Next publications       Date

 9-Monthly Report 2020   November 17, 2020
                                               Investor Relations
                                                      Diana Apostol
                                                       Sonnenstr. 15
                                                       80331 Munich
                                                         Germany

                                               tel: +49 89 95 006 210
                                               fax: +49 89 95 006 503
                                               email: ir@zooplus.com
                                             Web: investors.zooplus.com

                                               ZOOPLUS AG | INVESTOR PRESENTATION | SEPTEMBER 2020   30
You can also read