Sally Beauty Holdings - December 2013 - Sally Beauty ...
←
→
Page content transcription
If your browser does not render page correctly, please read the page content below
Sally Beauty Holdings
        December 2013

1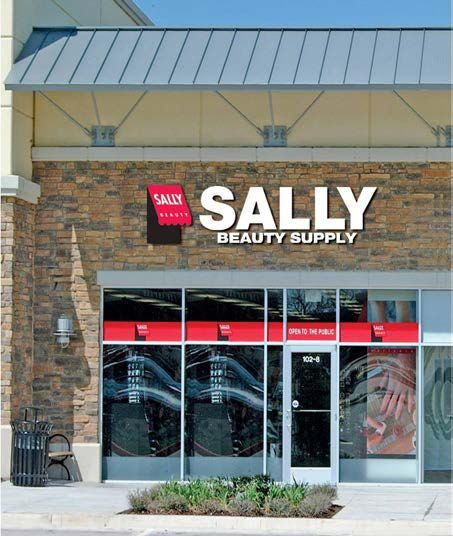
Company Highlights
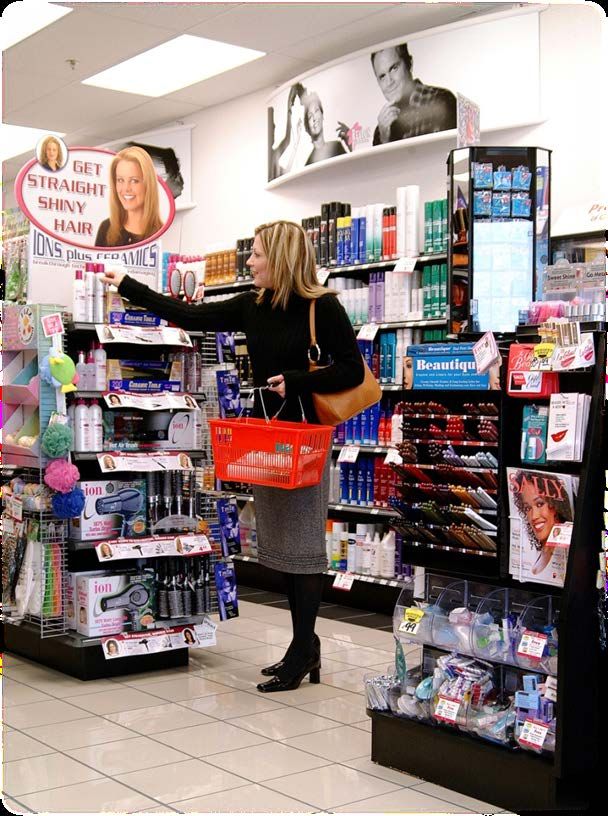
Sally Beauty Holdings is a leading international specialty retailer
and distributor of professional beauty products
Annual consolidated sales of over $3.6 billion
Strong cash flow generation
Approximately 4,669 stores located in 11 countries (1)
Experienced and motivated leadership team
Industry leading position with ~32% channel share
Proven resilience in recessionary cycles
Well-positioned for long-term growth
Two distinct business segments
(1) As of September 30, 2013
2
Overview of Our Business

    Consolidated Fiscal 2013 Results

        Segments

                       •   Retail consumers               •   Stores – Chair/suite rentals
                             •   75% of sales                   •   65% of sales
        Customers      •   Professional stylists, small   •   Full Service Sales – small to
                           salons, chair/suite rentals        medium sized salons
                             •   25% of sales                   •   35% of sales

                       •   Sales of $2.2b, up 1.4%        •   Sales of $1.4b, up 5.1%
         FY2013        •   SSS down 0.6% vs.+6.5% in      •   SSS growth of 4.2% vs.
        Financials         FY12                               +6.1% in FY12
                       •   Operating income of $437m      •   Operating income of $200m
3
                       •   Profit margin of 19.6%         •   Profit margin of 14.4%
Our Customer

                                                   Open-Line Retail                     Exclusive / Full-Service

          Distribution:                                 3,424 stores                1,245 stores        982 consultants

          Customers:                                                      Professional stylists             Salons

                 `                            $ Value                  Retail Consumers                  $$$ High-end

                                                    SBH plays an important role in the supply chain

Note: Store count as of September 30, 2013.

 4
Stable & Consistent Industry Growth

                                                               U.S. Salon Industry Product Sales
                                                                                          (at wholesale $’s)                                                                    Growth
                                                                                                                                                                                of 5.8%
                  $5.0
                                             Recession                                                                                                                                $4.5
                  $4.5                       Resistant                                                                                                                         $4.2

                  $4.0
                                             Industry                                                                                                                   $4.0
                                                                                                                                                            $3.8 $3.8
                                                                                                                                                     $3.7
                                                                                                                                         $3.4 $3.5
                  $3.5                                                                                                            $3.3
                                                                                                                           $3.1
                                                                                                                    $3.0
                  $3.0                                                                                  $2.9 $2.9
($ in billions)

                                                                                                 $2.7
                                                                                          $2.6
                  $2.5                                                             $2.4
                                                                           $2.3
                                                                    $2.2
                                                            $2.1
                                                    $2.0
                  $2.0              $1.7
                                            $1.8
                            $1.6
                  $1.5

                  $1.0

                  $0.5

                   $-

             5
            Source: Professional Consultants & Resources, 2012 Study.
            (1) Based on manufacturer sales of professional beauty supplies in the U.S.
Industry Channels of Distribution (U.S.)

                        Sally Beauty Holdings 2012 estimated U.S. channel share is over 32%
                                        Mega-Salon
                                        Manufacturer direct to
                                        large-format salons
                                                                                                                                                  Exclusive /
                 Direct                                                           13% (2)
                                                                                                                                                  Full-Service
                                                                                  $0.6B
                 Manufacturer direct to                                                                                                           Third party distribution
                 manufacturer-owned                                                                                                               to salons and beauty
                 salons or “high-end”                              13% (2)              Professional                                              professionals via sales
                 salons                                            $0.5B                   Beauty                                                 force and “professional
                                                                                         Products                         40% (2)                 only” stores
                                                                                                                          $1.8B
                                                                                      ~$4.49 billion (1)
                                                                                        Distribution
             Open-Line                                                                    Channels
             Distributes professional
             product to the public                                          34% (2)                                                             Competition:
             via retail stores                                              $1.6B                                                                               L’Oreal’s

             Competition:                                                                                             Area of
             Local and regional                                                                                       focus for
             operators                                                                                                SBH

Source: Professional Consultants & Resources, 2012 Study.
(1) Professional beauty supply channel size based upon a 2012 study of manufacturer-level sales conducted by Professional Consultants & Resources. The study estimates that 2012 manufacturer-
level sales for professional beauty supplies were approximately $4.49 billion. The $4.49b includes all categories for professionals including haircare, hair color, nailcare, hard goods, sundries, etc.
(2) Represents an estimated breakdown of salon haircare product sales in 2012 by channel of distribution.

6
Business Overview
Sally Beauty Supply: Overview
Sally Beauty Supply global footprint
3,424(1) stores worldwide
2,710 stores in U.S. (including Puerto Rico)
714 stores in Canada, the UK, Ireland,
Belgium, Netherlands, France, Germany,
Spain, Chile & Mexico
Average store size 1,700 sq. ft., 90% selling
space
Professional open-line business -
merchandise assortment not available
through mass retailers
Destination for Professional hair care
and solutions
(1) As of September 30, 2013.
8Strong Financial Track Record
Sally Beauty Supply Net Sales
Growth
($ in millions) of 1.4%
$2,400 $2,199 $2,230
$2,012
$2,000 $1,835
$1,673 $1,696
$1,567
$1,600 $1,359 $1,419
$1,208 $1,296
$1,132
$1,200
$800
$400
$0
2002 2003 2004 2005 2006 2007 2008 2009 2010 2011 2012 2013
Sally Beauty Supply Same Store Sales Growth
8.0% 6.8%
6.3% 6.5%
6.0% 5.7%
6.0%
3.8% 4.1%
4.0%
2.7% 2.7% 2.4% 2.4% 2.7%
2.1%
2.0% 1.2%
-0.6%
0.0%
1999 2000 2001 2002 2003 2004 2005 2006 2007 2008 2009 2010 2011 2012 2013
-2.0%
9Sally Beauty Supply: Merchandise Offering
Other Beauty
Items
Ethnic
Products 8% Hair Care
8% 22%
45% of
Brushes,
Sales from Hair
Cutlery and Care & Color
Accessories 14%
We offer a diversified mix
of beauty products 23%
10% Hair Color
Electrical
Appliances
16%
Skin and
Nail Care
Note: Percentage of sales by merchandise category for fiscal year 2013.
10Sally Beauty Supply Growth Initiatives
Growth Initiatives Worldwide Sally Beauty Supply Stores
4,000 3,424
3,158 3,309
2,844 2,923 3,032
Expand store base organically and 3,000 2,511 2,694
through acquisitions; domestic and
2,000
international
1,000
Plan to grow store base 3 to 4 percent in
FY2013 and beyond 0
2006 2007 2008 2009 2010 2011 2012 2013
Openings
Potential for store base to grow to over 4,500
stores globally Organic 92 83 110 60 108 126 129 113
Acquisition 0 100 40 19 1 0 22 2
Increase customer traffic through loyalty
programs and customer relationship Sally Beauty Supply Store Economics (USD)
management (CRM)
Capital Required $70k
Further expand Internet channel
Average Inventory $85k
Drive gross margin expansion
Customer mix shift to retail Positive Contribution Margin 4 Months
Shift to exclusive brands
Cash Payback on Investment 2 Years
Low-cost sourcing
11CRM and Beauty Club Card Driving Sales
• Retail customer is most attractive growth opportunity
In 2008, launched U.S. customer acquisition program (CRM) to attract new, retail customers
Increased efforts to convert retail customers to Beauty Club Card (BCC) members
CRM program targeting new retail customers; driving store traffic
3rd party profiled best BCC customers
Identified non-customers that have the same attributes
as our best BCC customers
Send direct mailers to potential customers
• BCC membership doubled in four years
Over 7 million members today
$5.00 fee for card; annual renewal
BCC members represent over 50% of retail sales
Members shop more often and spend more per visit
• BCC database tracks customer shopping behavior
Provides rewards for purchases
Provides insight into customers hair care regime
Provides ability to target communication
based on customers shopping behavior
12Grow Sally Beauty Supply Internationally
Existing International Platform Long-Term Store Growth Potential (1)
714 Sally Beauty stores located in 10 countries
Current Potential
Stores located in Canada, the UK, Ireland,
Belgium, France, the Netherlands, ~250
(Canada) 88
Germany, Spain, Chile & Mexico
~250
(Mexico) 166
Opening first store in Lima, Peru by
December 2013 ~300
(UK / Ireland) 256
23% of Sally Beauty Supply sales from
international 600-800
166
(Belgium, France,
Sales mix differs from U.S. Germany, Spain, Netherlands)
~80-85% professional ~45
(Chile) 38
~15-20% retail
Other South
American Countries green field
0
(1) Store count as of September 30, 2013.
Total 714 ~1,500+
13Beauty Systems Group: Overview
Beauty Systems Group – 1,245 professional stores
& 982 professional distributor sales consultants
1,084 company-operated / 161 franchised stores
(Armstrong McCall)
982 professional distributor sales consultants
Average store size 2,700 sq. ft.
Sells to salons and salon professionals
Professional exclusive / full-service business –
includes merchandise assortment of premium
(1) BSG operates stores under the CosmoProf service mark.
brands sold through salons and not available in
mass or at Sally stores
As of September 30, 2013
14BSG: Strong, Consistent Financial Track
Record
BSG Net Sales
($ in millions)
Growth
of 5.1%
$1,600 $1,392
$1,257 $1,325
$1,400
$1,200 $1,081
$954 $945 $975 $941
$1,000 $895
$802
$800 $616
$535
$600
$400
$200
$0
2002 2003 2004 2005 2006 2007 2008 2009 2010 2011 2012 2013
BSG Same Store Sales Growth
20.0%
15.5%
16.0% 14.4%
12.0% 10.1%
8.3% 8.5%
6.9% 6.2% 6.1%
8.0% 5.8% 5.5%
4.4% 4.6% 4.1% 4.2%
4.0% 1.0%
0.0%
(0.6%)
(4.0%)
1998 1999 2000 2001 2002 2003 2004 2005 2006 2007 2008 2009 2010 2011 2012 2013
15BSG: Merchandise Offering
Other
Beauty
Electrical Items
Appliances
7%
5%
Skin and
Nail Care
10% 36% Hair Care
We offer a diversified mix of
beauty products not carried in
Sally stores or mass retail Promotional 12%
Items
30%
Almost 70% of
Hair Color Sales from Hair
Care & Color
Note: Percentage of sales by merchandise category for fiscal year 2013.
16Beauty Supply Group Growth Initiatives
Growth Initiatives BSG Stores
Expand store base organically 1,200 991 1,027
1,151 1,190 1,245
874 929
828
Further penetrate existing geographies 800
Enter new territories
400
Opened 43 net new stores in FY2013;
12 acquired 0
Openings 2006 2007 2008 2009 2010 2011 2012 2013
Expand gross margins as sales shift Organic 6
0
46 44 16 36 39 39
0
43
12
Acquisition 0 11 46 0 85
to the stores
BSG Store Economics
Improve profitability
Capital Required $80k
Optimize distribution network
Average Inventory $150k
Continue integration efforts
Broaden offerings with new suppliers Positive Contribution Margin 4 Months
Seek potential fold-in acquisition Cash Payback on Investment 2 Years
opportunities
17Numerous Opportunities for Growth
Increase Sales Productivity of our Stores
Expand our Store Base Organically
Grow Internationally
Increase Operating Efficiency and Profitability
Pursue Strategic Acquisitions
18Consolidated Financial Results
Solid Balance Sheet
No near-term maturities Long-term debt (as of 9/30/13)
Amount % of
In November 2011, refinanced Sr. and Sr. ($mm) Total Debt
Sub Notes for $750mm of 6.875% Senior
Notes due 2019 5.750% Senior Notes (FY2022) $858.4 50.9%
6.875% Senior Notes (FY2020) $750.0 44.5%
In May 2012, refinanced the Term Loan B ABL $76.0 4.5%
with $700mm of 5.75% Senior Notes due Other (1) $1.3 0.1%
2021 Total Debt $1,685.7 100.0%
Targeted consolidated pro forma leverage
ratio of 2.0x – 2.5x
Maturity Profile (as of 9/30/13) (2)
Ample liquidity Total Capitalization $1,282 100.0%
Strong cash flow
$1,000
$900
ABL Revolver of $500 million $800 $859
$700 $750
Refinanced July 26, 2013; lowered rate and $600
increased availability to $500 million $500
$400
October 2013, issued $200 million aggregate $300
principal amount of 5.50% Senior Notes due $200
2023. $100
$-
2012 2013 2014 2015 2016 2017 2018 2019 2020 2021
Source: Company filings.
(1) Represents pre-acquisition debt of Pro-Duo NV and Sinelco Group BVBA (“Sinelco”) and capital leases.
20 (2) Excludes “Other” debt which matures between 2012 and 2014.Sales and EPS Growth for total Company
Sales EPS (ADJUSTED)
($ in millions)
$3,524 $3,622 $1.42 $1.48
$3,500 $1.20
$3,269
$1.07
$3,000
$2,916 2.8% 4.2%
$2,648 $2,637 YoY $1.00 YoY
$2,514
$2,500
$0.80 $0.77
$2,000
$0.60
$0.52
$1,500
$0.44
$0.40
$0.32
$1,000
$0.20
$500
$0 $0.00
FY07 FY08 FY09 FY10 FY11 FY12 FY13 2007 2008 2009 2010 2011 2012 2013
Same 1.8% 4.6% 6.4% 0.8% Net $59.5 $80.5 $95.9 $142.4 $200.3 $267.2 $261.2
4.5% 2.6% 6.1%
Store Sales Income
21Investment Highlights
Leader in Stable, Growing Professional Beauty Supply Channel
Multi-channel Platform with Differentiated Value Proposition
Solid Growth Potential
Strong, Consistent Financial Track Record
Significant Cash Flow Generation
Experienced and Motivated Management Team
22Questions and Answers 23
Cautionary Notice Regarding Forward-Looking Statements

     Statements in this presentation and the schedules hereto which are not purely historical facts or which depend upon future events may be
     forward-looking statements within the meaning of Section 27A of the Securities Act of 1933, as amended, and Section 21E of the Securities
     Exchange Act of 1934, as amended. Words such as “anticipate,” “believe,” “estimate,” “expect,” “intend,” “plan,” “project,” “target,” “can,”
     “could,” “may,” “should,” “will,” “would,” or similar expressions may also identify such forward-looking statements.
     Readers are cautioned not to place undue reliance on forward-looking statements as such statements speak only as of the date they were
     made. Any forward-looking statements involve risks and uncertainties that could cause actual events or results to differ materially from the
     events or results described in the forward-looking statements, including, but not limited to, risks and uncertainties related to: the highly
     competitive nature of, and the increasing consolidation of, the beauty products distribution industry; anticipating changes in consumer
     preferences and buying trends and managing our product lines and inventory; potential fluctuation in our same store sales and quarterly
     financial performance; our dependence upon manufacturers who may be unwilling or unable to continue to supply products to us; the
     possibility of material interruptions in the supply of products by our manufacturers; products sold by us being found to be defective in labeling
     or content; compliance with laws and regulations or becoming subject to additional or more stringent laws and regulations; product diversion
     to mass retailers or other unauthorized resellers; the operational and financial performance of our Armstrong McCall, L.P. franchise-based
     business; the success of our internet-based business; successfully identifying acquisition candidates and successfully completing desirable
     acquisitions; integrating businesses acquired in the future; opening and operating new stores profitably; the impact of the health of the
     economy upon our business; the success of our cost control plans; protecting our intellectual property rights, particularly our trademarks;
     conducting business outside the United States; disruption in our information technology systems; severe weather, natural disasters or acts of
     violence or terrorism; the preparedness of our accounting and other management systems to meet financial reporting and other requirements
     and the upgrade of our existing financial reporting system; being a holding company, with no operations of our own, and depending on our
     subsidiaries for cash; our substantial indebtedness; the possibility that we may incur substantial additional debt; restrictions and limitations in
     the agreements and instruments governing our debt; generating the significant amount of cash needed to service all of our debt and
     refinancing all or a portion of our indebtedness or obtaining additional financing; changes in interest rates increasing the cost of servicing our
     debt or increasing our interest expense due to our interest rate swap agreement; the potential impact on us if the financial institutions we deal
     with become impaired; the costs and effects of litigation; the representativeness of our historical consolidated financial information with
     respect to our future financial position, results of operations or cash flows; our reliance upon Alberto-Culver for the accuracy of certain
     historical services and information; the share distribution of Alberto-Culver common stock in our separation from Alberto-Culver not
     constituting a tax-free distribution; actions taken by certain large shareholders adversely affecting the tax-free nature of the share distribution
     of Alberto-Culver common stock; the voting power of our largest stockholder discouraging third party acquisitions of us at a premium; and the
     interests of our largest stockholder differing from the interests of other holders of our common stock.
     Additional factors that could cause actual events or results to differ materially from the events or results described in the forward-looking
     statements can be found in our most recent Annual Report on Form 10-K for the year ended September 30, 2013, as filed with the Securities
     and Exchange Commission. Consequently, all forward-looking statements in this presentation are qualified by the factors, risks and
     uncertainties contained therein. We assume no obligation to publicly update or revise any forward-looking statements.

24
Addendum: Adjusted EBITDA Reconciliation
Adjusted EBITDA and EPS Reconciliation
($ in millions)
Adjusted EBITDA FY06 FY07 FY08 FY09 FY10 FY11 FY12 FY13
Net Earnings (GAAP) $ 110.2 $ 44.5 $ 77.7 $ 99.1 $ 143.8 $ 213.7 $ 233.1 $ 261.2
Interest expense, net of interest income 0.1 146.0 159.1 132.0 113.0 112.5 $ 138.4 $ 107.7
Provision for income taxes 69.9 38.0 46.2 65.7 84.1 122.2 $ 127.9 $ 151.5
Depreciation and amortization 38.0 42.6 48.5 47.1 51.1 59.7 $ 64.7 $ 72.2
Share-based compensation 5.2 13.1 10.2 8.6 12.8 15.6 $ 16.9 $ 19.2
Transaction expenses (1a, 1b) 41.5 21.5 - - - - - -
Sales-based service fee charged by Alberto-Culver 28.9 3.8 - - - - - -
Non-recurring items - - - - - 5.7 - -
Litigation settlement and non-recurring charges - - - - - (27.0) 10.2 -
Adjusted EBITDA $ 293.8 $ 309.5 $ 341.7 $ 352.5 $ 404.8 $ 502.5 $ 591.1 $ 611.8
Adjusted net earnings and adjusted diluted earnings per share
Net Earnings (GAAP) $ 143.8 $ 213.7 $ 233.1 $ 261.2
Marked-tomarket adjustment for certain interest rate swaps $ (2.4) - -
Loss on extinguishment of debt - - 37.8
Interest expense on redeemed debt - - 5.1
Amortization of deferred financing costs - - 0.2
Litigation settlement and non-recurring items, net (2) (21.3) 10.2
Tax provision for the adjustments to net earnings 0.9 7.9 (19.2)
Adjusted net earnings $ 142.3 $ 200.3 $ 267.2 $ 261.2
Diluted adjusted net earnings per share (non-GAAP): $ 0.77 $ 1.07 $ 1.42 $ 1.48
Diluted GAAP net earnings per share: $ 0.78 $ 1.14 $ 1.24 $ 1.48
(1a) Transaction expenses of $41.5 for termination of the Regis transaction.
(1b) Transaction expenses of $21.5 for separation of the Company from Alberto-Culver in November 2006.
25
(2) Results for the nine months ended June 30, 2011, reflect a $27.0 million benefit of a litigation settlement and non-recurring charges of $5.7 million.You can also read