Q4 Fiscal 2020 Supplemental Slides - SEPTEMBER 28, 2020
←
→
Page content transcription
If your browser does not render page correctly, please read the page content below
Q4 Fiscal 2020
Supplemental Slides

  SEPTEMBER 28, 2020

Disclaimer
Certain information in this presentation and discussed on the conference call which this presentation accompanies constitutes forward-looking information within the meaning of
the Private Securities Litigation Reform Act of 1995. Statements regarding the Company’s business that are not historical facts are “forward looking statements” that involve risks
and uncertainties and are based on current expectations and management estimates; actual results may differ materially. The risks and uncertainties which could impact these
statements are described in filings that United Natural Foods, Inc. (the “Company”) has made under the Securities Exchange Act of 1934, as amended, including its annual report on
Form 10-K for the year ended August 3, 2019 filed with the Securities and Exchange Commission (the "SEC") on October 1, 2019, as updated in its quarterly report on Form 10-Q for
the quarter ended May 2, 2020 and other filings the Company makes with the SEC, and include, but are not limited to, the impact and duration of the COVID-19 outbreak, the
Company’s dependence on principal customers; the Company’s sensitivity to general economic conditions including changes in disposable income levels and consumer spending
trends; the Company’s ability to realize anticipated benefits of its acquisitions and dispositions, in particular, its acquisition of SUPERVALU; the Company’s reliance on the continued
growth in sales of higher margin natural and organic foods and non-food products in comparison to lower margin conventional grocery products; increased competition in the
Company’s industry as a result of increased distribution of natural, organic and specialty products and direct distribution of those products by large retailers and online distributors;
the possibility that restructuring, asset impairment, and other charges and costs we may incur in connection with the sale or closure of our retail operations will exceed our current
expectations; increased competition as a result of continuing consolidation of retailers in the natural product industry and the growth of supernatural chains; the addition or loss of
significant customers or material changes to the Company’s relationships with these customers; union-organizing activities that could cause labor relations difficulties and increased
costs; the Company’s ability to operate, and rely on third parties to operate reliable and secure technology systems; the relatively low margins of the Company’s business;
moderated supplier promotional activity, including decreased forward buying opportunities; the Company’s ability to timely and successfully deploy its warehouse management
system throughout its distribution centers and its transportation management system across the Company and to achieve efficiencies and cost savings from these efforts; the
potential for additional asset impairment charges; the Company’s sensitivity to inflationary and deflationary pressures; the potential for disruptions in the Company’s supply chain or
its distribution capabilities by circumstances beyond its control, including a health epidemic; the risk of interruption of supplies due to lack of long-term contracts, severe weather,
work stoppages or otherwise; volatility in fuel costs; volatility in foreign exchange rates; and our ability to identify and successfully complete asset or business acquisitions. Any
forward-looking statements are made pursuant to the Private Securities Litigation Reform Act of 1995 and, as such, speak only as of the date made. The Company is not undertaking
to update any information in the foregoing reports until the effective date of its future reports required by applicable laws. Any estimates of future results of operations are based
on a number of assumptions, many of which are outside the Company's control and should not be construed in any manner as a guarantee that such results will in fact occur. These
estimates are subject to change and could differ materially from final reported results. The Company may from time to time update these publicly announced estimates, but it is not
obligated to do so.

This presentation also contains the non-GAAP financial measures adjusted EBITDA, adjusted EPS, and adjusted effective tax rate. The reconciliation of these non-GAAP financial
measures to the most directly comparable GAAP financial measure is presented in the appendix to this presentation. The presentation of non-GAAP financial measures is not
intended to be considered in isolation or as a substitute for any measure prepared in accordance with GAAP. The Company believes that presenting non-GAAP financial measures
aids in making period-to-period comparisons, assessing the performance of our business and understanding the underlying operating performance and core business trends, and is
a meaningful indication of its actual and estimated operating performance. The Company's management utilizes and plans to utilize this non-GAAP financial information to compare
the Company's operating performance during certain fiscal periods to the comparable periods in the other fiscal years and, in certain cases, to internally prepared projections.

      2    Better Food. Better Future.
Key Fiscal 2020 Accomplishments

• Leveraged strong third and fourth quarter sales to produce
  record full year adjusted EBITDA of $673 million.
• Reduced outstanding net debt by $388 million; leverage
  reduced to 4.0x.

• Assumed continuing leadership role in supplying America’s
  supermarkets since onset of COVID-19.
• Recruited and onboarded several new key leaders including
  Chief Information Officer, Chief Supply Chain Officer, and Chief
  Marketing Officer.

      Better Food. Better Future.
  3
Strong Fourth Quarter Finish to Year                                                                        (1)
                                                                                                                          Full Year Fiscal 2020 Results
      Leveraged 8% sales growth to 28% growth in Adjusted EBITDA
                                                      Net Sales                                                           Net Sales
                                                                                                                             $26.51B
                                                       $6.75B
                                                     +8.0%(1)                                                             Adjusted EBITDA             (2)

                                                                                                                             $673M

                                                                                                                          A d j u s t e d E P S (2)
       Change                                                                       $198M           Adjusted
                                                                                                                                $2. 72/sha re
      Net Debt        ($55M)                                                     +27.9%(1)           EBITDA

                                             Q4 FY20                                                                      Change in Net Debt
                                                                                                                             ($388M)

                                                     $1.06/share                                                          Ending Adjusted
                                                     +205%(1)
                                                                                                                          EBITDA leverage             (2)

                                                                                                                             4.0x
                                                    Adjusted EPS
(1)    On a 13-week comparable basis to last year ( fiscal 2019 was a 53-week year and its fourth quarter was a 14-week
       quarter). Better
                 Fiscal Food.
                        2019 Better
                              included results from SUPERVALU for 41 of 53 weeks; as such no YOY percent comparisons
                                    Future.
       shown. See appendix for reconciliations for non-GAAP figures.
(1)
        Q4 Consolidated Sales +8% Driven Primarily by Chains & Independents

                                                                                                                                                               $ 113                      ($11)                    $ 6,755
                             $ 6,731                        ($475)
                                                                                                                                                                                            (2.1)%
                                                                                                                                                                +21.4%
                                                                                                                                     $ 39
                                                                                                          $ 183                      +3.6%
      ($s in Millions)

                                                                                                          +11.4%

                                                                               $ 175

                                                                                +6.9%

                                                                                         (1)                             (1)                        (1)                  (1)                        (1)
                             Q4 FY19              Additional Week              Chains               Independents                Supernatural                    Retail                    Other                    Q4 FY20
                             Net Sales                                                                                                                                                                             Net Sales

(1)              Percent sales changes are on a 13-week comparable basis to last year (fiscal 2019 was a 53-week year and its fourth quarter was a 14-week quarter). For the fourth quarter of fiscal 2020, the presentation of net
                 sales by customer channel has been recast to be presented on a basis consistent with customer size. The main effect of the change was to re-categorize the former Supermarkets and Independents channels,
                 previously classified by the majority of product carried by those customers between conventional and natural products, respectively, to classify those stores by the number of customer locations UNFI supplies.

                              Better Food. Better Future.
                         5
(1)
  Q4 Adjusted EBITDA +28% Driven by Strong Wholesale and Retail Performance
  Sales leverage and operating efficiencies partly offset by COVID expenses
                                                                                                                       $ 23                       ($8)
                                                                                                                                                                            $198

                                                                                            $ 59
($s in Millions)

                       $166                          ($11)
                                                                      ($31)

                                                                                                            (2) (3)             (2) (3)                          (2)
           Q4 FY19                           Additional week   COVID expenses Wholesale / Other                        Retail             Disc Ops / Elims                 Q4 FY20
       Adjusted EBITDA                                                                                                                                                 Adjusted EBITDA

   (1) See slide 15 in appendix for the Company’s definition of Adjusted EBITDA and the reconciliation of Adjusted EBITDA to net income for the fourth quarter of fiscal 2019 and fiscal 2020.
   (2) See segment table on slide 21.
   (3) Changes are on a 13-week comparable basis to last year (fiscal 2019 was a 53-week year and its fourth quarter was a 14-week quarter).

                       Better Food. Better Future.
                   6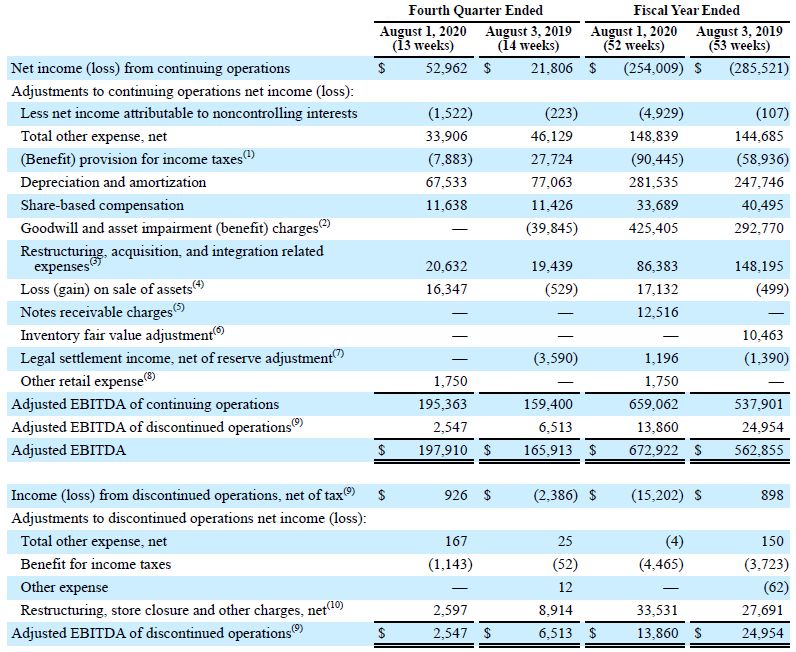
Multiple Drivers of Long-Term, Sustainable Growth
Building on success in Fiscal 2020 for 2021 and beyond

           Cross-Selling           E-Commerce             Private Brands         New Customers
          Achieved $250M           Fastest Growing       Sales increased 17%   Aggressively pursuing
              in FY20               Portion of our        in Q4 & 26% in Q3      with unmatched
                                       Business                                      offerings

     Better Food. Better Future.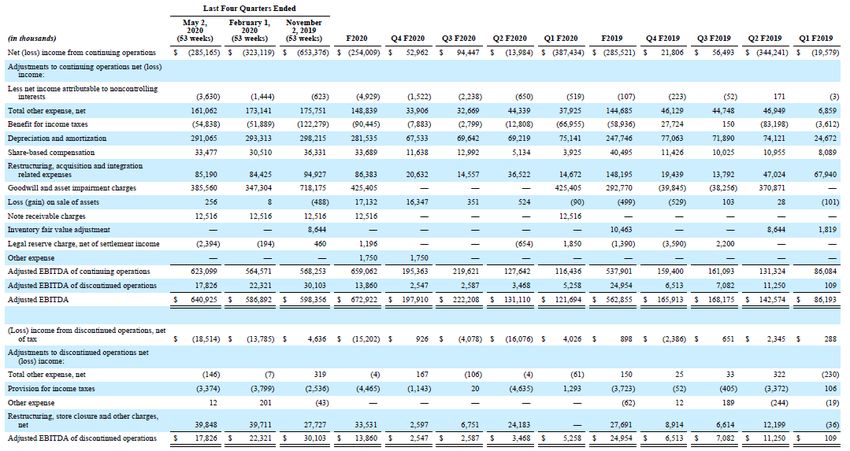
Strong Retail Performance Contributed to Fiscal 2020 Debt Reduction
Continue to operate the two remaining banners for up to 24 additional months

             Stores                                                                                Retail Results (Q4 FY20)
      Total of 71 Stores in Continuing                                                             Same store sales of +21%. Adjusted
      Operations: 52 Cub / 19 Shoppers.                                                            EBITDA increased $16M (+143%) (1)
                                                                                                                                                     24
                          Private Brands                                                                      e-Com Growth                       Months
               Retail had a very strong Quarter                                                              Cub grew delivery and click + collect
               selling Private Brands (+13%)                                                                 services (+309%)

                       Retail segment contributed $86 million of Adjusted EBITDA in Fiscal 2020 (2)
  8      Better Food. Better Future.    (1) Retail Segment Adjusted EBITDA includes rent expense and overhead allocation.
                                        (2) See segment table on slide 21.
Q4 Capital Structure Reflects Ongoing De-Leveraging
Strong liquidity provides continued operating flexibility
($'s in Millions) Amounts Outstanding
Maturity Rate Q4 FY19 Q1 FY20 Q2 FY20 Q3 FY20 Q4 FY20
Secured term loan B-1 October 2025 L + 4.25% $ 1,791 $ 1,787 $ 1,782 $ 1,778 $ 1,773
Secured term loan B-2 October 2019 L + 2.00% 74 - - - -
$2.1B ABL revolver October 2023 L + 1.25% / Prime + 0.25% 1,080 1,318 1,187 816 757
Finance leases (1) Various Various 133 84 70 160 156
Equipment loans Various Various 57 58 55 52 49
Total Debt and Finance leases (face value) $ 3,135 $ 3,247 $ 3,094 $ 2,806 $ 2,735
Balance sheet cash (2) (45) (43) (42) (59) (47)
Total Debt and Finance Leases Net of Cash (face value) $ 3,090 $ 3,204 $ 3,052 $ 2,747 $ 2,688
Face Value Net Debt / LFQ Adjusted EBITDA (3) 5.4x 5.2x 4.3x 4.0x
Available Liquidity (4) $ 964 $ 737 $ 869 $ 1,213 $ 1,282
(1) The decline between Q4 FY19 and Q1 FY20 was primarily driven by the adoption of the new lease accounting standard which derecognized certain finance lease obligations
now reflected as operating lease liabilities. The increase between Q2 FY20 and Q3 FY20 was primarily driven by the addition of a new finance lease obligation at our Moreno
Valley distribution center.
(2) Includes cash of Discontinued Operations. There is no debt in Discontinued Operations.
(3) Net debt, as shown, divided by last-four-quarter adjusted EBITDA of $598, $587, $641, and $673, respectively. See appendix for reconcilation of Adjusted EBITDA.
(4) Balance sheet cash plus unused capacity under the $2.1 billion revolving ABL facility.
9 Better Food. Better Future.Continued Focus on Sustainability & Impact via our ESG Efforts
Building Better for Our: Environmental Social Governance
World • 6th consecutive year on
Food Logistics Top Green
• Invested in safety of distribution
networks
• Board diverse by gender (30%
women) and race/ethnicity
Provider list
Communities • LEED® and solar-
powered buildings more
• 10 million pounds of food
donated throughout COVID-19
• Best practices include annual
elections, one voting class,
pandemic 3/3/20/20 proxy access, majority
People efficient and better for
associates and
environment
• 93 grants totaling $1 million
voting, special meeting rights at
25%, director retirement age,
from UNFI Foundation regular refreshment, annual
• Regular cycling of • Committed to racial equality board evaluations, no poison pill
delivery fleet improves
through pillars of action toward • Executive compensation reflects
efficiency, lowers costs
and protects the planet our people, our communities, pay for performance philosophy
and our world
• Joined the Climate • Reference leading reporting
Collaborative in 3rd frameworks, SASB and GRI in
quarter
Committed to reporting
Upholding our ESG
Completed Materiality Assessment and Established
Principles
Executive Committee Oversight in Fiscal 2020.
Better Food. Better Future.
10Most Importantly…
To our ~30,000 Associates, ~40,000+ Retail Partners, and ~10,000+ Suppliers who ALL went
above and beyond in Fiscal 2020 to provide Freedom of Food Choice when it mattered most…
We look forward to continuing to deliver together in the days and years ahead.
Better Food. Better Future.Fiscal 2021
Full-Year Outlook
Better Food. Better Future.
12Fiscal 2021 Outlook: The Future Looks Bright for UNFI (1)
Assumes food at home consumption remains strong and more significant than food away from home
Net Sales(1) Adjusted EBITDA(1)(2) Adjusted EPS(1)(2) ∆ Net Debt Reduction (1)
$690M -
$27.0B - $27.8B $3.05 - $3.55 ($300M)
$730M
(3.3% growth at midpoint) (5.5% growth at midpoint) (21.3% growth at midpoint)
(1) The outlook provided above is for fiscal 2021. This outlook is forward-looking, is based on management's current estimates and expectations and is subject
to several risks, including many that are outside of management's control. See cautionary language on slide 2 and the risk factors contained in the
Company’s Annual Report on Form 10-K for the year ended August 3, 2019 filed on October 1, 2019 and other filings the Company makes with the SEC.
(2) Please refer to the appendix for reconciliations of Adjusted EPS and Adjusted EBITDA to the most directly comparable financial measures calculated in
accordance with GAAP.
13 Better Food. Better Future.Appendix
14 Better Food. Better Future.
14Reconciliation – Adjusted EBITDA
($’s in Thousands)
The non-GAAP adjusted EBITDA measure is defined as a consolidated measure inclusive of continuing
and discontinued operations results, which we reconcile by adding Net (loss) income from continuing
operations, plus Total other expense, net and (Benefit) provision for income taxes, plus Depreciation
and amortization calculated in accordance with GAAP, plus adjustments for Share-based
compensation, Restructuring, acquisition and integration related expenses, goodwill and asset
impairment charges, certain legal charges and gains, certain other non-cash charges or items, as
determined by management, plus Adjusted EBITDA of discontinued calculated in a manner consistent
with the results of continuing operations outlined above.
15 Better Food. Better Future.Reconciliation – Adjusted EPS
See slide 17 for definition of Adjusted EPS
16 Better Food. Better Future.Reconciliation – FY21 Outlook Adjusted EPS & Adjusted EBITDA
The non-GAAP adjusted earnings per
diluted common share measure is a
consolidated measure, which the Company
reconciles by adding Net Income
attributable to UNFI plus goodwill and
asset impairment benefits and charges,
restructuring, acquisition, and integration
related expenses, certain legal charges and
gains, surplus property depreciation and
interest expense, losses on debt
extinguishment, discontinued operations
store closures and other charges, net, the
impact of diluted shares when GAAP
earnings is presented as a loss and non-
GAAP earnings represent income, and the
tax impact of adjustments and the
adjusted effective tax rate, which tax
impact for fiscal 2020 and fiscal 2020
outlook is calculated using the adjusted
effective tax rate, and certain other non-
cash charges or items, as determined by
management.
17 Better Food. Better Future.Reconciliation – Adjusted Effective Tax Rate
The non-GAAP adjusted effective tax rate excludes the potential impact of changes to various uncertain tax positions and valuation
allowances, as well as stock compensation accounting (ASU 2016-09).
18 Better Food. Better Future.Reconciliation - Adjusted EBITDA 19 Better Food. Better Future.
Reconciliation - Adjusted EBITDA Leverage Ratio

20   Better Food. Better Future.
Historical Segment Sales and Adjusted EBITDA

                       This information is presented to help investors understand historical segment trends as Retail is now part of continuing operations.

21   Better Food. Better Future.
Historical Net Sales by Channel
This information is presented to help investors understand historical segment trends as Retail is now part of continuing operations.
22 Better Food. Better Future.You can also read