AUGUST 2021 Matt Courtney CEO | Leigh Whitton CFO - AFR
←
→
Page content transcription
If your browser does not render page correctly, please read the page content below
Matt Courtney CEO | Leigh Whitton CFO

AUGUST 2021

DISCLAIMER

This presentation contains certain statements and forecasts provided by or on            or matters (express or implied) arising out of, contained in or derived from this
behalf of Intega Group Limited. Any forward‐looking statements reflect various           presentation or any omission from this presentation or of any other written or oral
assumptions by or on behalf of Intega. Accordingly, these statements are subject         information or opinions provided now or in the future to any interested party or its
to significant business, economic and competitive uncertainties and contingencies        advisers. In furnishing this presentation, Intega undertakes no obligation to provide
associated with the business of Intega which may be beyond the control of Intega         any additional or updated information whether as a result of new information,
which could cause actual results or trends to differ materially, including but not       future events or results or otherwise.
limited to competition, industry downturns, inability to enforce contractual and
other arrangements, legislative and regulatory changes, sovereign and political          Except to the extent prohibited by law, the Relevant Parties disclaim all liability
risks, ability to meet funding requirements, dependence on key personnel and             that may otherwise arise due to any of this information being inaccurate or
other market and economic factors. Accordingly, there can be no assurance that           incomplete. By obtaining this document, the recipient releases the Relevant
any such statements and forecasts will be realised. Intega makes no                      Parties from liability to the recipient for any loss or damage which any of them
representations as to the accuracy or completeness of any such statement or              may suffer or incur arising directly or indirectly out of or in connection with any
forecasts or that any forecasts will be achieved and there can be no assurance that      use of or reliance on any of this information, whether such liability arises in
any forecasts are attainable or will be realised.                                        contract, tort (including negligence) or otherwise.

Additionally, Intega makes no representation or warranty, express or implied, in         This document does not constitute, and should not be construed as, either an offer
relation to, and no responsibility or liability (whether for negligence, under statute   to sell or a solicitation of an offer to buy or sell securities. It does not include all
or otherwise) is or will be accepted by Intega or by any of its directors,               available information and should not be used in isolation as a basis to invest in
shareholders, partners, employees, or advisers (Relevant Parties) as to or in            Intega.
relation to the accuracy or completeness of the information, statements, opinions

                                                                                                                                                                                    2
1. PERFORMANCE
   OVERVIEW

2. DETAILED
   FINANCIAL
   REVIEW

3. COMMENTARY
   AND OUTLOOK

                 3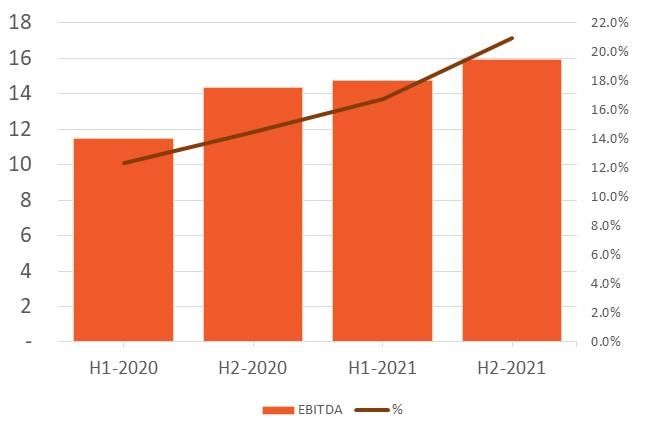
I N F Y 2 1 I N T E G A P E R F O R M E D A H E A D O F P R I O R Y E A R W I T H A S I A PA C I F I C M A I N TA I N I N G M A R K E T
SHARE AND AMERICAS BENEFITING FROM STRONG PIPELINE AND IMPROVED MARGINS

 •   Intega Group has continued to focus on core business strategies, optimising utilisation of resources and the reduction of overhead costs in
     both the head office and back office management structure during FY21
 •   Underlying EBITDA for FY21 was $51.3M up 19.6% on prior year and above guidance
 •   The Company paid an interim dividend of 1.0 cent per share (unfranked) and has declared a final dividend of 1.4 cents per share (unfranked)
 •   Underlying EBIT increased 54.8% on prior year to $19.5 million
 •   Underlying EPS for the year of 2.13c, up from prior year of 1.16c
 •   Net cash from operating activities for the year was $40.3 million, representing cash conversion of 87.3%
 •   Balance sheet remains strong with the business continuing to manage working capital to free up cash, allowing for net debt repayments
     during the year of $17.8 million
 •   Backlog has increased 4.5% on prior year on a constant currency basis with significant wins in Asia Pacific and the Americas including Oak Hill
     Parkway development (CEI), Salt River Project (SUE) and Bruce Highway Cooroy to Curra (CMT)
 •   Asia Pacific and the Americas performance was up on FY20 with a strong pipeline, expansion opportunities and the ongoing turnaround
     initiatives now imbedded in the T2 Utility Engineering business in Americas
 •   Whilst both Asia Pacific and the Americas were impacted by COVID the business remained flexible and responsive to minimise the financial
     impact

                                                                                                                                                       4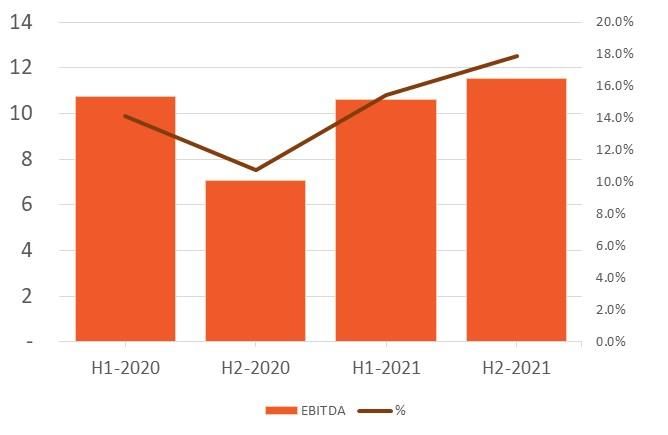
I N T E G A I S A L E A D I N G A S S U R A N C E , T E S T I N G , I N S P E C T I O N A N D C E R T I F I C AT I O N ( AT I C ) B U S I N E S S
T H AT P R O V I D E S C O N S T R U C T I O N M AT E R I A L S T E S T I N G ( C M T ) , S U B S U R FA C E U T I L I T Y E N G I N E E R I N G
S E R V I C E S ( U E S ) A N D Q U A L I T Y A S S U R A N C E F O R E N E R G Y C O M PA N I E S ( Q A )

  Provides construction materials                   Provides subsurface utility                     Provides construction materials            Provides quality, consulting and
   testing, environmental testing,               engineering, utility mapping and                  testing, geotechnical engineering          engineering services with a focus
 subsurface utility engineering and            locating, utility coordination, utility              consulting, project management            on the renewable energy and oil
      geotechnical engineering                        design and surveying                             and quality assurance and                       and gas sectors
                                                                                                           inspection services
Fee revenue down 6.1% from prior               Decrease in fee revenue of 19.9%                   Fee revenue remained flat in local         Fee revenue down 19.1% (local
year due to the wind down of major             (local currency down 11.0%) due to                 currency as the infrastructure             currency 10.1%) as a result of low oil
projects in NSW and NZ and project             closure of loss making areas, wind                 market remained strong (decrease           prices and project delays during the
delays as a result of COVID                    down of major projects and COVID                   on prior year of 9.7% in AUD)              pandemic
                                               impacting on delays and staff
EBITDA margin grew by 4.0% to                  quarantine                                         EBITDA margin down 0.3% on prior           EBITDA margin grew by 2.0% due to
16.6%, driven by overhead savings                                                                 year with additional BD costs in FY21      ability to flex staff and carry through
and flexible operating model                   EBITDA margin expansion 23.5% on                   to bolster business development            cost savings initiatives from prior
                                               prior year with the business                       opportunities and revenue growth in        year through to FY21
                                               continuing to benefit from initiatives             FY22 and beyond
                                               introduced in FY20

 % of Fee
                                      Construction Sciences                              T2 Utility Engineers                 Raba Kistner                           PPI
                                                                                                                                                                                       5
Revenue by
  Division                                   44.8%                                              10.4%                            29.1%                              15.7%
1. PERFORMANCE
OVERVIEW
2. DETAILED
FINANCIAL
REVIEW
3. COMMENTARY
AND OUTLOOK
6FY 21 FY 20 FY 21
F U L L - Y E A R U N D E R LY I N G E B I T D A O F $ 5 1 . 3 M U P O N A$m v % Change
Pro-form a FY 20
PRIOR YEAR PRO-FORMA 1
Gross Revenue $398.1 $452.0 ($53.8) (11.9%)
▪ Underlying EBITDA up 19.6% on prior year pro-forma, increase in Fee Revenue1 $297.5 $334.0 ($36.5) (10.9%)
EBITDA margin 4.4% to 17.2% Underlying EBITDA 2
$51.3 $42.9 $8.4 19.6%
Abnormal Items $5.1 ($1.3) $6.3 501.4%
▪ Abnormal items in FY21 relate to payment of TSA to Cardno, considered
to be a duplication of costs during transition to standalone entity ($3.7 Underlying EBIT $19.5 $12.6 $6.9 54.8%
million) and retention payments for prior acquisitions ($1.4 million). Underlying Net Operating Profit before Tax3 $14.5 $8.0 $6.5 82.0%
With the transition complete, no further TSA costs will be incurred Underlying Net Operating Profit after Tax3 $9.3 $5.2 $4.2 80.9%
Statutory Profit after Tax $5.1 $10.1 ($5.0) (49.6%)
▪ Net Operating Profit after Tax of $9.3 million, up $4.2 million on prior
Backlog4 $349.5 $357.8 ($8.3) (2.3%)
year comparative
Net Cash Flow from Operations $40.3 $47.6 ($7.3) (15.3%)
▪ On a constant currency basis backlog has grown by 4.5% driven by key Dividend declared (cents per share) 2.4 - 2.4 100.0%
wins in both Asia Pacific and Americas
Note: FY 20 Pro-forma numbers represent Intega for the full twelve months including the four months as a subsidiary of
Cardno.
▪ Net Cash Flow from Operations was $40.3 million, which is reflective of
ongoing operating activities following the significant process (1) Gross revenue is total revenue received from services provided and recoverable expenses. Fee revenue is the portion of
gross revenue that relates to fees from services provided only.
improvements in FY20 (2) Included in underlying EBITDA is $1.5 million in public company costs .
(3) Underlying net operating profit provides a measure of operating performance before the impact of underlying
adjustments such as acquisition and demerger costs.
(4) Backlog is reported on a total contract basis, being the total gross value of the signed contract less the value of work
performed to date.
7FY-20
A$ Millions H1-20 H2-20
Pro-form a
H1-21 H2-21 FY-21 FY21 vs FY20
Gross revenue 1 231.0 221.0 452.0 210.7 187.4 398.1 (11.9%)
Fee revenue 169.0 165.0 334.0 157.0 140.5 297.5 (10.9%)
Underlying EBITDA 22.2 20.7 42.9 24.7 26.6 51.3 26.1%
2
Underlying EBITDA Margin 13.1% 12.5% 12.8% 15.7% 18.9% 17.2% 4.4%
Depreciation - ROU Assets 5.1 5.8 10.9 5.5 7.4 12.9 18.3%
Depreciation - Other 4.8 5.7 10.5 5.5 5.6 11.1 5.7%
Amortisation 3 4.4 4.6 9.0 4.1 3.6 7.7 (14.4%)
Interest Expense - ROU Asset 0.7 0.8 1.5 0.7 0.8 1.5 0.0%
Interest Expense - Other 0.9 2.2 3.1 1.9 1.6 3.5 12.9%
Underlying Net Operating Profit before tax 4 6.3 1.7 8.0 7.0 7.6 14.6 82.5%
Underlying Net Operating Profit after tax 3.6 1.6 5.2 5.6 3.7 9.3 79.4%
Statutory Profit after tax 3.0 7.1 10.1 2.0 3.1 5.1 (49.6%)
Net Operating cash flow 13.9 33.7 47.6 17.9 22.4 40.3 (15.3%)
Underlying basic earnings per share (cents) 0.81 0.35 1.16 1.25 0.88 2.13 83.6%
Dividend declared (cents per share) 1.00 1.40 2.40
Note: FY 20 Pro-forma numbers represent Intega for the full twelve months including the four months as a subsidiary of Cardno.
(1) Gross revenue is total revenue received from services provided and recoverable expenses. Fee revenue is the portion of gross revenue that relates to fees from services provided only.
(2) Underlying EBITDA margin is calculated as a percentage of fee revenue
(3) Amortisation relates to identifiable intangible assets acquired via acquisitions. The intangibles are amortised over 3 years and will be fully amortised in December 2021. 8
(4) Net operating profit provides a measure of operating performance before the impact of underlying adjustments such as acquisition and demerger costs.A S I A PA C I F I C E B I T D A I N C R E A S E D 2 4 . 3 % O N P R I O R Y E A R D E S P I T E A
ASIA PACIFIC EBITDA AND % MARGIN
DECLINE IN FEE REVENUE
A$ million
▪ Fee Revenue for FY21 declined 6.1% on prior year with Pacific Highway projects in
northern New South Wales, and Transmission Gully project in New Zealand winding
down, offset by the ramp up of projects in Western Australia, Queensland and
Northern Territory such as, Mount Holland Lithium, Kidston Pumped Hydro and
Townsville Ring Road 5 projects
▪ Underlying EBITDA was $22.1 million compared to $17.8 million in the prior period
▪ Underlying EBITDA margin for FY21 was 16.6%, an improvement of 4.0% on FY20
▪ While Asia Pacific was impacted by COVID causing project delays, border restrictions
impacting on “fly in fly out” workforce and resourcing and staff quarantining
throughout the year, the business has remained flexible and responsive to ensure
that any financial impact is minimised
9T H E A M E R I C A S D I V I S I O N M A I N TA I N E D G R OW T H T R A J EC TO RY F R O M
F Y 2 0 F O R E B I T DA A N D M A R G I N
AMERICAS EBITDA AND % MARGIN
A$ million ▪ Fee Revenue for FY21 declined by 14.6% on FY20 (local currency decline 5.0%),
primarily due to low oil prices, project delays and shutdowns from COVID and the
closure of some loss making business units during the year
▪ The Americas construction materials testing business continues to benefit from
infrastructure spend which resulted in a small increase in fee revenue on prior year
and an increase of US $14 million in backlog during the year
▪ Oil and gas business has continued to see both quality assurance and engineering
revenues impacted project delays as a result of COVID. EBITDA has remained largely
flat year on year as the business flexes workforce and other cost savings in response
▪ Initiatives to turn around the T2 Utility Engineering business have been embedded
with EBITDA up on prior year $7.0 million and margin up 23.5%
▪ Underlying EBITDA for FY21 was $30.7 million up on prior year by $4.7 million from
$26.0 million and an overall increase in underlying EBITDA margin of 5.2% to 18.7%
10
TX State Highway 249B A C K L O G R E P O R T E D O N A T O TA L C O N T R A C T B A S I S , B E I N G T H E T O TA L G R O S S VA L U E O F T H E S I G N E D
C O N T R A C T L E S S T H E VA L U E O F T H E W O R K P E R F O R M E D T O D AT E
Backlog less than 1 Year
Construction Sciences Raba Kistner
Construction
▪ FY 21 backlog includes 1 year of Holcim Sciences ▪ Strong backlog underpinned by large
25%
Supply agreement transportation infrastructure projects
▪ Backlog less than 1 year is approximately estimated for completion over multiple
T2 Utility
$213m years
59% of total Construction Sciences Raba
Engineering Kistner
backlog 11% 64% ▪ Backlog less than 1 year is approximately
63% of total Raba Kistner backlog
Total Backlog
T2 Utility Engineers PPI
▪ Backlog predominately relating to Construction
Sciences
▪ Is predominately a book and burn
transport infrastructure projects 25% business where projects are short term
▪ Backlog less than 1 year is approximately and services are provided on demand in
$349m line with client master service agreements
54% of total T2 backlog T2 Utility Raba
Engineering Kistner (MSA). Therefore PPI does not record
13% 62% backlog
11Restated
FY-20 FY-21
A$000’s A$000’s
CONTINUED FOCUS ON BALANCE SHEET Cash and cash equivalents 40,029 19,645
Trade and other receivables 64,899 57,996
▪ Strong focus on collections activity for trade receivables and Contract assets 26,319 20,598
Inventories 165 166
improvement in billing processes has reduced WIP resulting in a Other current assets 4,065 2,903
more efficient cash cycle Total current assets 135,477 101,308
PPE 18,718 14,798
Right of use asset 38,033 36,640
▪ Reduction in trade and other payables in FY21 due to the timing Intangible assets 99,666 87,268
of payroll and creditor payments and final deferred settlement for Deferred tax assets 21,515 19,743
Total non-current assets 177,932 158,449
Raba acquisition
Total assets 313,409 259,757
Trade and other payables 46,597 31,782
▪ Intangible assets impacted by strengthening AUD against USD Lease Liabilities - Finance 3,306 4,762
Lease Liabilities - Operating 10,335 10,050
(0.6863 30 June 2020 to 0.7518 30 June 2021) Other current liabilities 20,607 19,362
Total current liabilities 80,845 65,956
▪ Net debt as at 30 June 2021 excluding the impact of AASB 16 was Borrowings
Lease Liabilities - Finance
73,199
9,496
51,787
8,546
$45.5 million, in line with FY20 Lease Liabilities - Operating 22,382 20,853
Other non-current liabilities 2,753 2,143
Non-current liabilities 107,830 83,329
▪ All lending covenant ratios met at 30 June 2021 Total liabilities 188,675 149,285
Net assets 124,734 110,472
Net debt 45,972 45,450
Net Debt/EBITDA (lending covenant = 2.0x) 3.0x 3.3x
Net Asset Value (lending covenant >= $80.0M) $127m $112m 12FY-20 FY-21
A$000’s A$000’s
C O N T I N U E D F O C U S O N W O R K I N G C A P I TA L EBITDA 42,946 51,293
Working capital movement 8,776 (5,288)
M A N A G E M E N T T O G E N E R AT E C A S H F O R D E B T
Net interest paid (4,144) (4,904)
REDUCTION Income tax paid 0 (807)
Net cash provided by operating activities 47,578 40,294
▪ Positive net cash from operations driven by continued focus on
working capital management. Working capital movement impacted Proceeds from sale of property, plant and equipment 475 1,189
by payment of TSA costs, otherwise would have been largely flat in Acquisition of subsidiaries, deferred consideration (8,522) (5,983)
FY21 following the significant improvement process in FY20 Payments for PPE (5,020) (3,769)
Net cash used in investing activities (13,067) (8,563)
▪ Final deferred settlement payment relating to acquisition of the Net Proceeds/(Repayments) of borrowings 5,669 (17,798)
Raba business paid Repayment of lease liabilities (13,226) (17,519)
Share buyback 0 (9,816)
Dividend payment 0 (4,253)
▪ Intega paid a dividend of 1.0 cent per share and completed a share Net cash used in financing activities (7,557) (49,386)
buy back including unmarketable parcel buyback during the year
Net increase in cash 26,954 (17,655)
▪ Repayment of borrowings during the year of $17.8 million Cash 1 July 13,062 40,029
Other 13 (2,729)
Cash and cash equivalents 40,029 19,645
▪ Increase in lease liabilities due to increase in operating leases and
Cash Conversion (1) 110.8% 78.6%
actively looking to finance all capex spend to optimise cash flow (2)
Free Cash Flow 33,476 24,717
(1) Cash Conversion represented by net cash provided by operating activities / EBITDA
▪ Cash conversion and free cash flow down on prior year. Cash
conversion excluding TSA and other one off items of 87.3% which is (2) Free
Cash Flow represents net cash provided by operating activities excluding interest and
tax plus capex and lease liabilities payments
more reflective of underlying business 131. PERFORMANCE
OVERVIEW
2. DETAILED
FINANCIAL
REVIEW
3. COMMENTARY
AND OUTLOOK
14D U R I N G T H E Y E A R , T H E G R O U P C O N T I N U E D TO F O C U S O N I M P R O V I N G T H E B A L A N C E S H E E T, B A C K L O G
A N D O V E R A L L R E S U LT I N A C H A L L E N G I N G E N V I R O N M E N T
• Position to benefit from improving market conditions with expected additional investment in Government
ASIA PACIFIC infrastructure and mining infrastructure
• Expansion of niche service lines through acquisition
• Position to benefit from improving market conditions with expected additional investment in Government
infrastructure
AMERICAS
• Geographic expansion of Raba Kistner business both organically and through acquisition
• Completion and integration of two acquisitions in Texas for the Raba business, both expected in Q1 FY22
• Completion of the strategic review announced by the Board in June, aimed at maximizing shareholder value including
exploration of ownership options
• Continuation of the existing dividend policy of distributing between 50 – 70% of NPAT adjusted for amortisation of
GROUP intangibles back to shareholders (franked to the extent possible)
• Refinance of existing debt facilities, including options to increase headroom and improve pricing, due for renewal in
October 2022
15Intega Group Limited
Level 1/17 Byres St,
Newstead, QLD, 4006
T +61 7 3518 2700
intega.netYou can also read