Informing COVID-19 recovery: Insights from NWEA's MAP Growth assessment and policy recommendations
←
→
Page content transcription
If your browser does not render page correctly, please read the page content below
BRIEF

Informing COVID-19 recovery:
Insights from NWEA’s MAP Growth
assessment and policy recommendations
“It’s on us to make the change we need in our country…
              We will need innovative and creative leadership fueled by
              urgency. The resources are there. At the federal, state, and
              local level—we must act.”
              —Secretary Miguel Cardona, Equity Summit, June 22, 2021

Context
Our nation—and the world—have persisted through an unprecedented and challenging year. Although the
pandemic appears to be waning, many of the effects are ongoing. While no one has been left unscathed,
the disruptions have hit communities of color and low-income families the hardest. Student learning has
been disrupted on an unprecedented scale, exposing previously unseen and deeper inequities within our
education system.

Despite the challenges, there is reason for optimism. With the worst of the pandemic hopefully behind us,
and significant federal funding to deploy, we have an opportunity to develop a strong foundation for an
equitable and excellent education for all students. Recovery can lead to transformation, if educators, school
leaders, and policymakers get the resources and support they need to rise to the challenge.

As policymakers and education leaders continue to plan for the next school year—and the years that follow—
data will be critical in ensuring our nation advances the learning of all students and addresses the inequities
that impact both students of color and students living in poverty. Below are highlights from analyses by
NWEA researchers on student growth and achievement during the 2020–21 school year and equity-focused
recommendations to support recovery developed by NWEA’s Policy and Advocacy team—drawing on the
research and wisdom of our colleagues across the civil rights, policy, and advocacy communities.

Summary of key findings1
The data from NWEA’s MAP® Growth™ assessment2, administered in the fall, winter, and spring of the
2020–2021 school year, reveals the disproportionate impact of the pandemic on academic progress and
achievement for our nation’s most underserved students. 3 MAP Growth was administered to about 5.5
million public school students in reading and math. On average, students struggled compared to “normal”
times—the 2018–19 school year in this analysis—and the story varies further by subject and grade level.
The overwhelming takeaway, however, is that educators, as well as state and district leaders, must make
strategic, data-informed decisions about how to advance learning and support success, particularly for
historically marginalized students.

1 This section includes analyses and findings from research by NWEA researchers Karyn Lewis, Megan Kuhfeld, Erik Ruzek, and Andrew
  McEachin released in July 2021. For the full results and more detail on the data and analyses, please see the research brief.
  Note: for simplicity of presentation, numbers and calculations presented in figures in this brief are rounded. Because of this, some numbers
  differ slightly from those presented in the research.
2 MAP Growth is a computer adaptive test that is vertically scaled across grades K–12 and measures student achievement on the RIT scale. RIT
  scores can be used to compare academic growth across students and time—within an academic year and over multiple years.
3 The research is a continuation of previous research conducted by NWEA Research on the early impacts of the COVID-19 pandemic on
  students academically in fall 2020.

                                                                                                                      Informing COVID-19 recovery | 2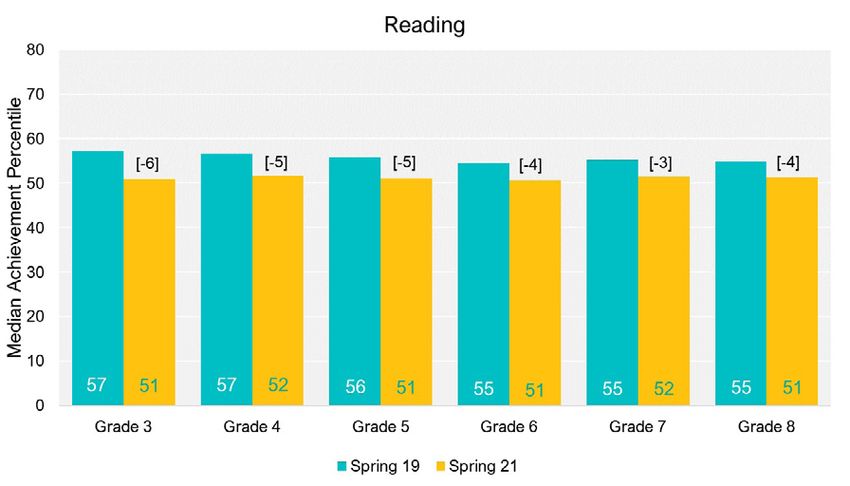
ALL STUDENTS MADE GAINS IN 2020–21 AT A LOWER RATE THAN A “TYPICAL” YEAR
Figures 1.a and 1.b compare the 2018–19 (“typical” year) and 2020–21 academic gains trajectories for fall,
winter, and spring (as measured by mean RIT scores) in reading and math for grades 3–8.4

In reading, students entered the 2020–21 school year at about the same level as a “typical” year. However,
students experienced lower academic gains and ended the school year an average of 3–6 percentile points
behind, compared to 2018–19.

                                  Figure 1.a Average MAP Growth RIT scores for grades 3–8 in reading

In math, students entered the 2020–21 school year behind where they started in a “typical” school year and
also experienced lower academic gains. Students ended the school year an average of 8–12 percentile points
behind compared to the 2018–19 school year.

                                   Figure 1.b Average MAP Growth RIT scores for grades 3–8 in math

4 For greater readability, the grade levels have been divided between two figures for each subject area.

                                                                                                           Informing COVID-19 recovery | 3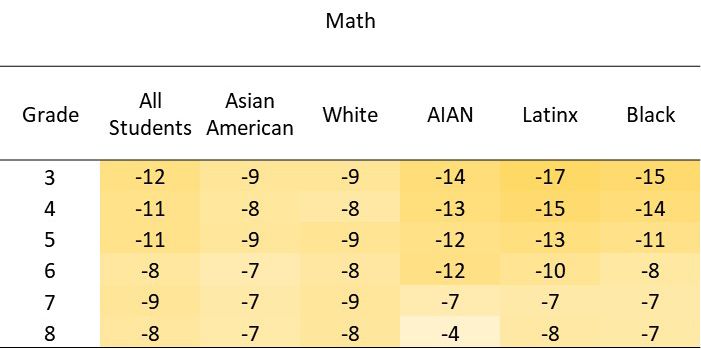
STUDENT ACHIEVEMENT AT THE END OF THE 2020–21 SCHOOL YEAR WAS LOWER
COMPARED TO PRE-PANDEMIC LEVELS, WITH LARGER DECLINES IN MATH
Figures 2.a and 2.b show the median end-of-year achievement percentile ranks5 of a more “typical” year
compared to the median end-of-year achievement percentile ranks for spring 2021. The figures also show
the difference between the two medians in the brackets. All grades experienced a lower median percentile
rank in spring 2021 in both reading and math.

In spring 2019, the median percentile score for third-graders in reading was 57. In spring 2021, the percentile
score for third-graders was 51. Achievement for third-graders in reading was 6 percentile points lower at the
end of spring 2021 than in a “typical” year.

                           Figure 2.a Spring 2019 and 2021 achievement comparisons by grade in reading

In spring 2019, the median percentile score for third-graders was 55; it was 43 for third-graders in spring
2021. Achievement for third-graders in math was 12 percentile points lower at the end of spring 2021 than in
a “typical” year.

                            Figure 2.b Spring 2019 and 2021 achievement comparisons by grade in math

5 Achievement percentiles are based on NWEA’s 2020 MAP Growth norms, which are a nationally representative set of norms based on data
  from 2015–16 to 2017–18. An achievement percentile provides some indication for how a student’s score in a particular grade and subject area
  compares to other same-grade students across the country.

                                                                                                                    Informing COVID-19 recovery | 4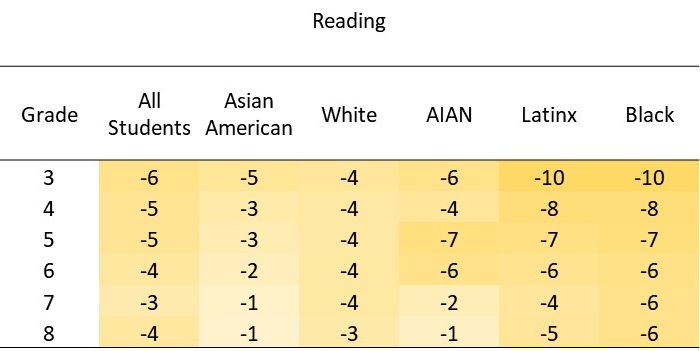
HISTORICALLY MARGINALIZED AND ECONOMICALLY DISADVANTAGED STUDENTS
WERE DISPROPORTIONATELY IMPACTED
Spring achievement declines were particularly evident for students of color in early grades.
Figures 3.a and 3.b present the differences in the median end-of-year achievement percentile ranks of spring
2019 compared to spring 2021 separately for all students and by race/ethnicity of student groups. The
greatest declines in achievement were experienced by Black and Latinx students in grades 3–5 in reading
and American Indian and Alaska Natives (AIAN), Black, and Latinx students in grades 3–5 in math.
In spring 2021, Black and Latinx fifth-graders had a median percentile score that was 7 points lower than
Black and Latinx fifth-graders in spring 2019.
Figure 3.a Differences in achievement from spring 2019 to 2021 by student group in reading
In spring 2021, AIAN third-graders had a median percentile score that was 14 points lower than AIAN third-
graders in spring 2019.
Figure 3.b Differences in achievement from spring 2019 to 2021 by student group in math
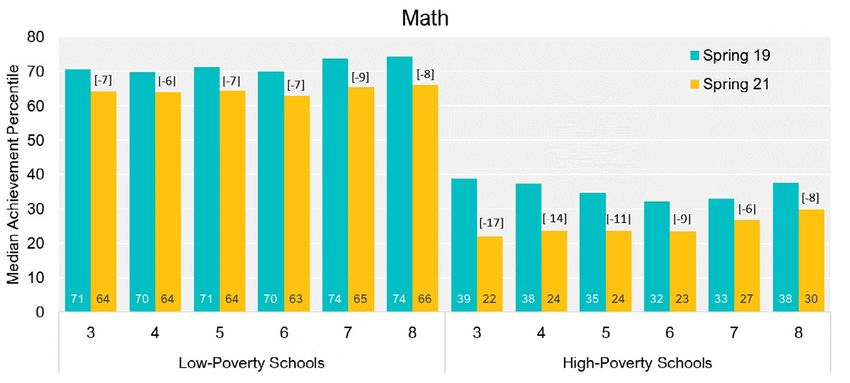
Figure 4 shows the median end-of-year achievement percentile ranks of a “typical” year compared to the
median end-of-year achievement percentile ranks for spring 2021 in math for high- and low-poverty schools.
Poverty level is based on the school-level percentages of students experiencing poverty—with low-poverty
schools having less than 25% of students experiencing poverty and high-poverty schools having more than
75% of students experiencing poverty.6 Students in high-poverty schools (right panel) had a greater decline
in median achievement percentile points, on average nearly double that of low-poverty schools, from 2019
to 2021.
6 This is based on students receiving free and reduced-price lunch.
Informing COVID-19 recovery | 5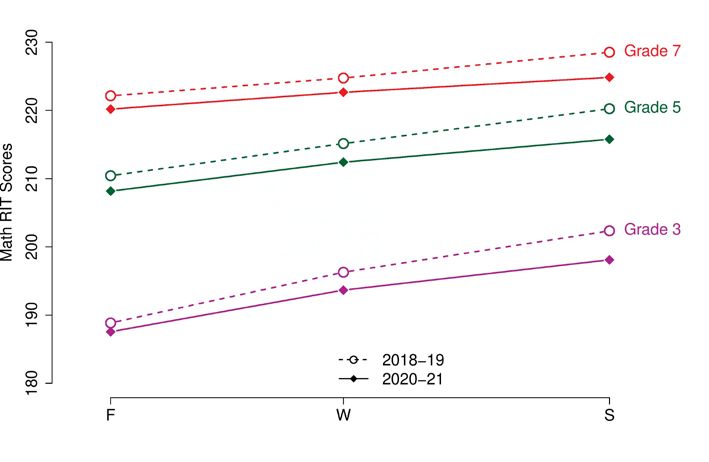
Fourth-graders in high-poverty schools experienced a median percentile score that was 14 percentile points
lower in spring 2021 compared to a “typical” year. Their peers in low-poverty schools experienced a decline
of 6 percentile points as compared to a “typical” year.

             Figure 4. Spring 2019 and 2021 achievement comparisons in math by school socioeconomic status
             and grade

CALL TO ACTION
These results reveal a complex story of the past school year and highlight the important work ahead for
recovery. As policymakers and education leaders review these results, as well as data on their local context
of student success, it is important to reflect on the pre-pandemic existence of significant inequities in
opportunity and achievement. We must not rebuild our system with pre-pandemic structures in mind. To
break the systemic inequities in the education system, we must use this moment to heavily invest in the
transformation of national, state, and local education systems. Our collective call to action is clear: “next year
cannot be a ‘normal’ year.” We must strategically invest federal funding to develop and implement policies
and programs that build a stronger, equitable education system for students, families, and educators.

Policy recommendations to support recovery
As students return to in-person learning this fall, education leaders must continue to attend to the health
and well-being of students and families while renewing efforts to accelerate learning and expand access to
excellent educational opportunities. The following recommendations for federal, state, and district leaders
include strategies to help support learning recovery for all students, especially those most impacted by the
pandemic, and lay a stronger foundation for student success.

Re-engage all students, with a focus on historically underserved students. The pandemic has disrupted
learning on an unprecedented scale, most acutely for students of color, low-income students, and students
with disabilities. States and districts must make similarly unprecedented investments to reconnect students
to their school communities.

   • Deploy intentional strategies with compassion to identify and re-engage students and families who
      were disconnected or “missing” during the pandemic.

   • Thoughtfully expand instructional time and opportunities for learning that will ensure students are
      prepared for grade-level content, such as summer programs, high-dosage and small-group tutoring,
      and mentoring.
                                                                                                 Informing COVID-19 recovery | 6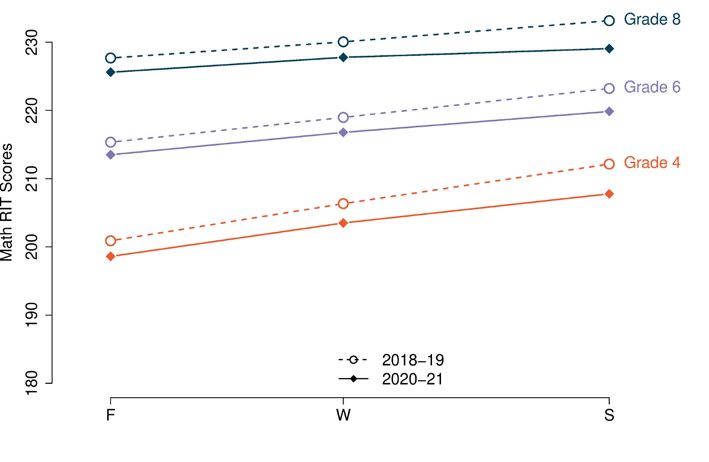
• Ensure students have access to grade-level instruction that will support learning in math and reading.

  • Maintain a well-rounded curriculum that includes instruction in science, social studies, and art.

  • Provide students with disabilities and English learners with targeted supports as they may have
     suffered disproportionately due to decreased instructional time and disruption in services.

  • Support students in transition that experienced particular disruption last year—students entering
     kindergarten, elementary to middle school, middle to high school, and high school to college.

                    A topic of great concern over this past year has been the potential
                    number of “missing” students in schools and data. In fall 2020, NWEA
                    Research reported on patterns of missingness in our test data—
                    revealing that there were differences across subjects and grades in the
                    representation of student groups in fall 2020 compared to fall 2019.
                    From this research, we found that students of color were more likely to
                    be missing from our data. Due to this, the impacts of the pandemic on
                    learning may be underestimated.

Continue to support access to remote learning technology for students and families. Before the
pandemic, the “Homework Gap” left nearly 17 million children offline. With virtual instruction, activities, and
family engagement likely to continue well into the future, it is essential for states and districts to adapt to
support the technological needs of schools, families, and students.

  • Provide all students with high speed internet at school and at home (at necessary upload/download
     speeds), sufficiently powered devices, and technical support.

  • Develop programs that train and support families on “digital literacy,” particularly for families of
     vulnerable students.

  • Evaluate the efficacy of remote instruction compared to in-person learning—differentiating by factors
     like student grade level and race—and ensure that every student is getting access to an equitable and
     excellent education.

  • Ensure that virtual parent and community engagement platforms give families user-friendly access to
     educational tools and school information.

  • Offer remote and in-person options for extracurricular activities, support services, and family
     engagement to maximize access for vulnerable communities.

Attend to physical, social, and mental health needs of students and families. Even as the pandemic wanes
in its intensity, the effects are ongoing. Students and families need support for addressing basic needs and
coping with everything from stress and anxiety to trauma arising from major life and family disruptions,
including the loss of loved ones.

  • Continue to make school meals available to all students and maintain reduced burdens on families in
     applying for meal programs beyond the 2021–2022 school year.

  • Partner with community organizations to connect with and support underserved communities through

                                                                                             Informing COVID-19 recovery | 7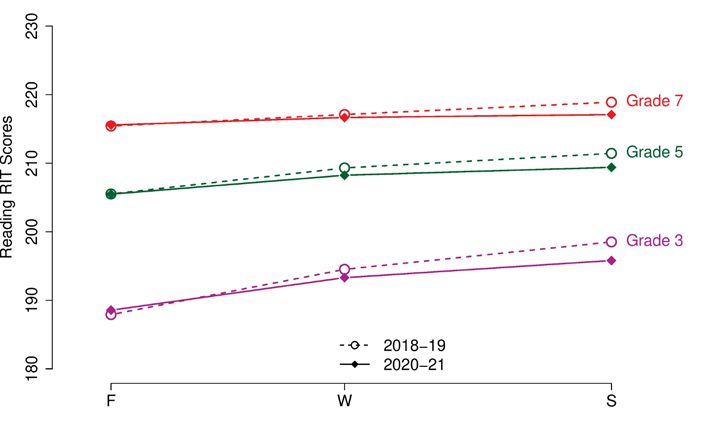
joint activities like hosting evening and online information sessions and providing services (e.g., free
     counseling, grants) to family members.

  • Make mental health services available in schools, including increasing access to school nurses
     and counseling services, as well as conducting comprehensive, “systematic screening” for early
     identification with all students.

  • Foster and incentivize the creation of an affirmative and uplifting school climate by providing resources
     to educators and leaders on how to build a positive school culture.

Measure student progress, rethink assessment systems, and use data to support recovery. The pandemic
has disrupted student learning unevenly across student groups, subjects, and grade levels. To understand
the impacts and inform effective recovery, it is essential that educators and parents, as well as school and
system leaders, have ongoing and high-quality data on student progress and achievement at the student,
classroom, school, and system levels.

  • Evaluate student needs and progress continuously through the 2021–22 school year using a variety of
     balanced assessment measures (summative, interim, and formative) and holistic measures of student
     success (e.g., opportunity to learn, school culture, etc.).

  • Use district- and school-level data continuously to measure academic recovery, strategically target
     resources, and scale promising practices.

  • Give students, teachers, and school and district leaders timely and actionable information—creating
     effective feedback loops—to guide their practice and strategies during the school year.

  • Report de-identified aggregate data on student progress publicly—particularly to parents—to ensure
     transparency and enable action and advocacy to improve student success.

  • Plan for the future by developing a multi-year innovative and equity-focused comprehensive
     assessment plan that will give educators and policymakers the data they need to make informed
     decisions to guide COVID recovery.

Support and train teachers and leaders. Educators have been heroes of the pandemic, but the hard work
is far from over. With indications that the pandemic has significantly impacted the teacher pipeline, states
and districts must support teachers and school leaders with effective and real-time training, coaching, and
professional development to improve instruction and teaching.

  • Invest and build a strong teacher pipeline through targeted recruitment, preparation, and
     retention programs.

  • Build the skills of the educator workforce through activities such as leadership development and
     instructional coaching focused on meeting the needs of students.

  • Attend to educators’ mental and physical health needs, including by acknowledging the difficulties
     teachers encountered and celebrating successes over the past year.

  • Provide targeted and purposeful professional development opportunities to educators, including
     coaching on how to evaluate data on student progress to help all of their students succeed.

                                                                                           Informing COVID-19 recovery | 8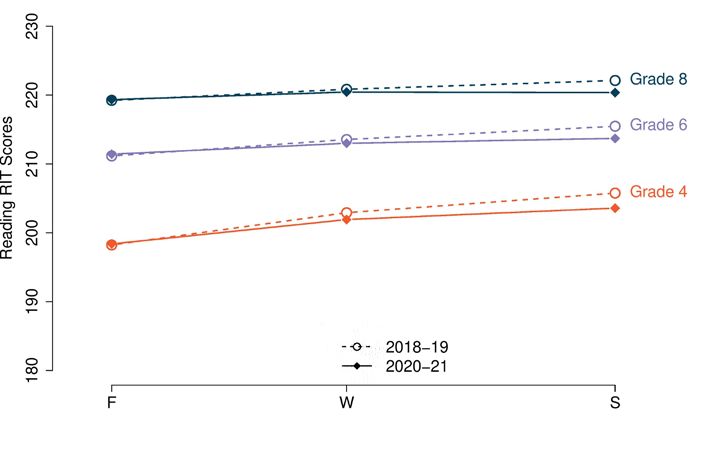
Move from restarting to reimagining accountability and school improvement. After the disruption of the
past two years, states should leverage the flexibilities provided to reevaluate and update accountability
and reporting systems to drive equitable learning recovery, support continuous school improvement, and
support holistic student success.

   • Align system indicators, in the short-term, to state-specific COVID impacts and state recovery plans
       (e.g., state plans to use American Rescue Plan Elementary and Secondary School Emergency Relief).

   • Explore how to provide additional insight on how student groups have been impacted by the
       pandemic and how they are recovering academically over the next 2–3 years.

   • Evaluate the continued relevance of current accountability indicators in driving recovery and moving
       towards more equitable, holistic, and innovative state accountability systems.

   • Upgrade state data systems from P–16 that “collect and connect” data on access to opportunities to
       learn and student outcomes, from kindergarten readiness and high-quality preschool attendance to
       access to advanced coursework and college-going rates.

              For additional information on NWEA Policy and Advocacy,
                       please visit NWEA.org/policy-advocacy

                    Questions or comments about this resource? Contact the authors.

                                      Lindsay Dworkin                                 Katie Carroll
                                        Vice President                                    Director
                                    Policy and Advocacy                    Policy and State Engagement
                                lindsay.dworkin@nwea.org                        katie.carroll@nwea.org

NWEA is a not-for-profit organization that supports students and educators worldwide by providing assessment solutions, insightful reports,
professional learning offerings, and research services. Visit NWEA.org to find out how NWEA can partner with you to help all kids learn.

2021 NWEA®. NWEA and MAP are registered trademarks, and MAP Growth is a trademark, of NWEA in the US and in other countries. The names of
other companies and their products mentioned are the trademarks of their respective owners.

JUL21 | KAP7481                                                                                                       Informing COVID-19 recovery | 9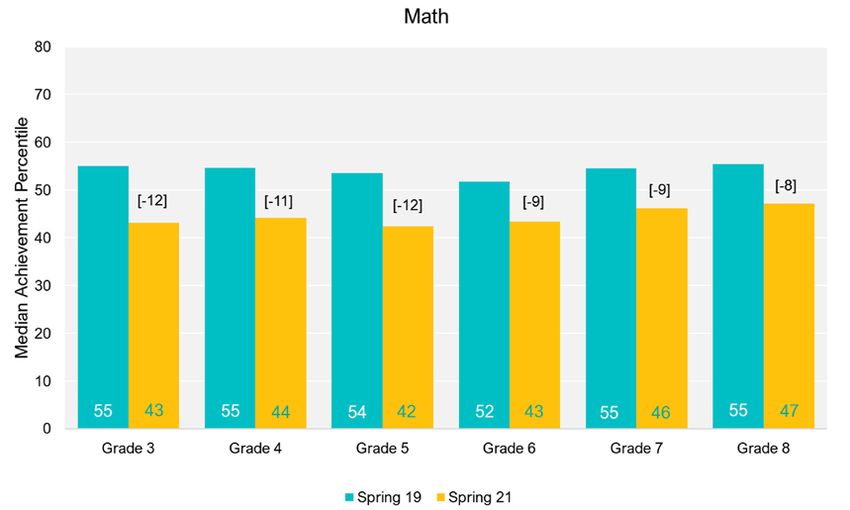
You can also read