FOUR CORNERS PROPERTY TRUST - NYSE: FCPT

Page created by Terrance Hawkins
 
CONTINUE READING
FOUR CORNERS PROPERTY TRUST - NYSE: FCPT
FOUR CORNERS PROPERTY TRUST
           NYSE: FCPT

S U P P L E M E N T AL F I N AN C I AL & O P E R AT I N G I N F O R M AT I O N | Q 1 2 0 2 0   www.fcpt.com

 1 | FCPT | Q1 2020
FOUR CORNERS PROPERTY TRUST - NYSE: FCPT
CAUTIONARY NOTE REGARDING FORWARD-
LOOKING STATEM ENTS

This press release contains forward-looking statements within the meaning of the federal securities laws. Forward-looking
statements include all statements that are not historical statements of fact and those regarding the Company’s intent, belief or
expectations, including, but not limited to, statements regarding: operating and financial performance; announced transactions; and
expectations regarding the making of distributions and the payment of dividends. Words such as “anticipate(s),” “expect(s),”
“intend(s),” “plan(s),” “believe(s),” “may,” “will,” “would,” “could,” “should,” “seek(s)” and similar expressions, or the negative of
these terms, are intended to identify such forward-looking statements. Forward-looking statements speak only as of the date on
which such statements are made and, except in the normal course of the Company’s public disclosure obligations, the Company
expressly disclaims any obligation to publicly release any updates or revisions to any forward-looking statements to reflect any
change in the Company’s expectations or any change in events, conditions or circumstances on which any statement is based.
Forward-looking statements are based on management’s current expectations and beliefs and the Company can give no assurance
that its expectations or the events described will occur as described. Forward-looking statements are subject to a number of risks and
uncertainties that could cause actual results to differ materially from those set forth in or implied by such forward-looking
statements.

For a further discussion of these and other factors that could cause the Company’s future results to differ materially from any
forward-looking statements, see the section entitled “Risk Factors” in the Company’s most recent annual report on Form 10-K, and
other risks described in documents subsequently filed by the Company from time to time with the Securities and Exchange
Commission.

 2 | FCPT | Q1 2020
FOUR CORNERS PROPERTY TRUST - NYSE: FCPT
T AB L E O F C O N T E N T S

     Financial Summary                                       Page

         Consolidating Balance Sheet                           4
         Consolidated Income Statement                         5
         FFO and AFFO Reconciliation                           6
         Net Asset Value Components                            7
         Capitalization and Key Credit Metrics                 8
         Debt Summary                                          9
         Debt Maturity Schedule                               10
         Debt Covenants                                       11

     Real Estate Portfolio Summary

         Property Locations by Brand                          12
         Brand Diversification                                13
         Geographic Diversification                           14
         Lease Maturity Schedule                              15

     Exhibits

         Glossary and Non-GAAP Definitions                    16
         Reconciliation of Net Income to Adjusted EBITDAre    17

3 | FCPT | Q1 2020
FOUR CORNERS PROPERTY TRUST - NYSE: FCPT
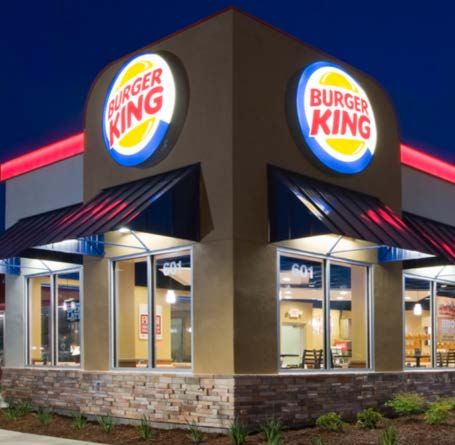
C O N S O L I D AT I N G B AL AN C E S H E E T

                                                                                                          As of 3/31/2020                              As of 12/31/2019
    ($000s, except shares and per share data)                                  Real Estate         Restaurant                         Consolidated        Consolidated
    Unaudited                                                                  Operations          Operations         Elimination        FCPT                 FCPT
                                    ASSETS
    Real estate investments:
      Land                                                                 $        707,596    $          5,051     $          -      $     712,647    $          690,575
      Buildings, equipment and improvements                                       1,275,736              11,885                -          1,287,621             1,277,159
      Total real estate investments                                               1,983,332              16,936                -          2,000,268             1,967,734
        Less: accumulated depreciation                                             (635,886)             (5,511)               -           (641,397)             (635,630)
      Real estate investments, net                                                1,347,446              11,425                -          1,358,871             1,332,104
      Intangible real estate assets, net                                             62,573                 -                  -             62,573                57,917
    Total real estate investments and intangible real estate assets, net          1,410,019              11,425                -          1,421,444             1,390,021
    Cash and cash equivalents                                                        89,845                 646                -             90,491                 5,083
    Straight-line rent adjustment                                                    41,512                 -                  -             41,512                39,350
    Other assets                                                                      5,505               4,275                -              9,780                10,165
    Derivative assets                                                                   -                   -                  -                -                   1,451
    Investment in subsidiary                                                         12,015                 -              (12,015)             -                     -
    Intercompany receivable                                                             338                 -                 (338)             -                     -
      Total Assets                                                         $      1,559,234    $         16,346     $      (12,353)   $   1,563,227    $        1,446,070
                        LIABILITIES AND EQUITY
    Liabilities:
      Term loan ($400,000, net of deferred financing costs)                $        395,445    $            -       $          -      $    395,445     $          395,012
      Revolving facility ($250,000 capacity)                                        178,000                 -                  -           178,000                 52,000
      Unsecured notes ($225,000, net of deferred financing costs)                   223,007                 -                  -           223,007                222,928
      Rent received in advance                                                        8,554                 -                  -             8,554                 10,463
      Derivative liabilities                                                         19,488                 -                  -            19,488                  5,005
      Dividends payable                                                              21,417                 -                  -            21,417                 21,325
      Other liabilities                                                              10,227               5,110                -            15,337                 12,596
      Intercompany payable                                                                -                 338               (338)              -                      -
    Total liabilities                                                      $        856,138    $          5,448     $         (338)   $    861,248     $          719,329
    Equity:
      Preferred stock                                                      $            -      $            -       $          -      $         -      $              -
      Common stock                                                                        7                 -                  -                  7                     7
      Additional paid-in capital                                                    689,601              12,015            (12,015)         689,601               686,181
      Accumulated other comprehensive (loss) income                                 (27,803)                -                  -            (27,803)               (3,539)
      Noncontrolling interest                                                         3,928                 -                  -              3,928                 5,691
      Retained earnings                                                              37,363              (1,117)               -             36,246                38,401
    Total equity                                                           $        703,096    $         10,898     $      (12,015)   $     701,979    $          726,741
      Total Liabilities and Equity                                         $      1,559,234    $         16,346     $      (12,353)   $   1,563,227    $        1,446,070

 4 | FCPT | Q1 2020
FOUR CORNERS PROPERTY TRUST - NYSE: FCPT
C O N S O L I D AT E D I N C O M E S T AT E M E N T

                 ($000s, except shares and per share data)                 Three Months Ended March 31,
                 Unaudited                                                  2020                 2019
                 Revenues:
                   Rental revenue                                      $        37,725     $          34,208
                   Restaurant revenue                                            4,704                 5,393
                    Total revenues                                              42,429                39,601

                 Operating expenses:
                  General and administrative                                     3,842                 3,946
                  Depreciation and amortization                                  7,054                 6,361
                  Property expenses                                                635                   308
                  Restaurant expenses                                            4,502                 4,983
                   Total operating expenses                                     16,033                15,598

                 Interest expense                                               (7,003)               (6,747)
                 Other income                                                        4                   413
                 Realized gain on sale, net                                        -                     -
                 Income tax expense                                                (61)                  (68)
                 Net income                                                     19,336                17,601

                  Net income attributable to noncontrolling interest               (71)                  (98)
                 Net Income Attributable to Common Shareholders        $        19,265     $          17,503

                 Basic net income per share                            $          0.28     $             0.26
                 Diluted net income per share                          $          0.27     $             0.26
                 Regular dividends declared per share                  $        0.3050     $          0.2875

                 Weighted-average shares outstanding:
                  Basic                                                      70,052,772           68,202,950
                  Diluted                                                    70,258,211           68,453,720

 5 | FCPT | Q1 2020
FOUR CORNERS PROPERTY TRUST - NYSE: FCPT
F F O & AF F O R E C O N C I L I AT I O N

     ($000s, except shares and per share data)                                                  Three Months Ended March 31,
     Unaudited                                                                                   2020                 2019
       Net income                                                                           $         19,336    $           17,601
       Depreciation and amortization                                                                   7,036                  6,344
     FFO (as defined by NAREIT)                                                             $         26,372    $           23,945
       Straight-line rent                                                                             (2,161)                (2,359)
       Stock-based compensation                                                                          831                  1,214
       Non-cash amortization of deferred financing costs                                                 512                    513
       Other non-cash interest income                                                                     (1)                    (3)
       Non-real estate investment depreciation                                                            18                     17
       Amortization of above and below market leases, net                                                185                     12
     Adjusted Funds From Operations (AFFO)                                                  $         25,756    $           23,339

                                                                   (1)
     Fully diluted shares outstanding                                                             70,515,859             68,802,268

     FFO per diluted share                                                                  $           0.37     $             0.35
     AFFO per diluted share                                                                 $           0.37     $             0.34

___________________________
(1) Assumes the issuance of common shares for OP units held by non-controlling interests.

  6 | FCPT | Q1 2020
FOUR CORNERS PROPERTY TRUST - NYSE: FCPT
N E T AS S E T V AL U E C O M P O N E N T S

                                                                   Purchase                       Total Square     Avg. Rent Per      Tenant          Lease Term     Annual Cash Base
                                                                     Price           # of             Feet          Square Foot      EBITDAR          Remaining           Rent              % Total Cash Base
                                                                                                                                             (1)             (2)               (3)                   (3)
     Real Estate Portfolio as of 3/31/2020                          ($000s)       Properties         (000s)             ($)          Coverage           (Yrs)           ($000s)                  Rent
      Olive Garden                                                         -          305             2,599               29             5.4x             10.4             74,356                        52.4%
      LongHorn Steakhouse                                                  -          110              614                33             4.6x              9.3             20,574                        14.5%
      Other Brands - Non-Darden                                            -          294             1,437               30             3.1x             12.4             42,909                        30.2%
      Other Brands - Darden                                                -           13              120                35             3.9x              8.6              4,167                         2.9%
     Total Owned Portfolio                                                 -          722             4,770               30             4.7x             10.8             142,006                      100.0%

                                    (4)
     Q1'20 Transaction Activity
      Properties acquired                                            36,226           23               137                18             N/A              5.9               2,498                         1.8%
      No sales in Q1 2020

     Tangible Assets                                                                                                                                                                      Book Value ($000s)
      Cash, cash equivalents, and restricted cash                                                                                                                                       $            90,491
      Other tangible assets                                                                                                                                                                           5,774
     Total Tangible Assets                                                                                                                                                              $            96,265

     Debt                                                                                                                                                                                 Face Value ($000s)
      Term loan                                                                                                                                                                         $          400,000
      June 2024 note                                                                                                                                                                                 50,000
      December 2026 note                                                                                                                                                                             50,000
      June 2027 note                                                                                                                                                                                 75,000
      December 2028 note                                                                                                                                                                             50,000
      Revolving credit facility                                                                                                                                                                    178,000
     Total Debt                                                                                                                                                                         $          803,000

     Tangible Liabilities                                                                                                                                                                 Book Value ($000s)
      Dividends payable                                                                                                                                                                 $            21,417
      Rent received in advance, accrued interest, and other accrued expenses                                                                                                                         16,138
     Total Tangible Liabilities                                                                                                                                                         $            37,555

     Shares Outstanding
      Common stock (shares outstanding as of 3/31/2020)                                                                                                                                              70,323,828
      Operating partnership units (OP units outstanding as of 3/31/2020)                                                                                                                                204,392
     Total Common Stock and OP Units Outstanding                                                                                                                                                     70,528,220
___________________________
(1) See glossary on page 16 for tenant EBITDAR and EBITDAR coverage definitions; 89% of portfolio ABR included in calculations based on portfolio reporting obligations.
(2) Lease term weighted by annual cash base rent (ABR) as defined in glossary.
(3) Current scheduled minimum contractual rent as of 3/31/2020.
(4) FCPT acquired 23 properties and leasehold interests in Q1 2020; FCPT had no dispositions in the quarter.

 7 | FCPT | Q1 2020
FOUR CORNERS PROPERTY TRUST - NYSE: FCPT
C AP I T A L I Z A T I O N & K E Y C R E D I T M E T R I C S

                                                                                                                                                          % of Market
                  Q1 2020 Capitalization ($000s, except shares and per share data)                                                                        Capitalization
                  Equity:
                   Share price (3/31/2020)                                 $           18.71
                   Shares and OP units outstanding (3/31/2020)                    70,528,220
                  Equity Value                                             $       1,319,583                                                                 62.2%
                  Debt:
                   Term loan                                               $         400,000                                                                  18.8%
                   Revolving credit facility                                         178,000                                                                   8.4%
                   Unsecured notes                                                   225,000                                                                  10.6%
                  Total Debt                                               $         803,000                                                                  37.8%
                  Total Market Capitalization                              $       2,122,583                                                                 100.0%
                   Less: cash                                                        (90,491)
                  Implied Enterprise Value                                 $       2,032,092

                  Dividend Data (fully diluted)                                                                                       Q1 2020
                  Common dividend per share                                                                                           $0.3050
                  AFFO per share                                                                                                       $0.37
                  AFFO payout ratio                                                                                                    82.9%

                  Credit Metrics                                                               Net Debt(1)               Adjusted EBITDAre (2)                Ratio
                  Net debt to Adjusted EBITDAre                                        $           712,509                    $                 133,907       5.3x

___________________________
(1) Principal debt amount less cash and cash equivalents.
(2) Current quarter annualized. See glossary on page 16 for definitions of EBITDAre and Adjusted EBITDAre and page 17 for reconciliation to net income.

  8 | FCPT | Q1 2020
FOUR CORNERS PROPERTY TRUST - NYSE: FCPT
D E B T S U M M AR Y

                                                                                                                                          Cash Interest Rate               Weighted
                                                                                    Balance as of March                                    as of March 31,                 Average
                            Debt Type                     Maturity Date               31, 2020 ($000s)                % of Debt                 2020(4)                  Maturity (Yrs.)
                                         (1)
                     Credit Facility
                      Revolving facility                     Nov-21                  $                178,000                22.2%                 2.28%                          1.6
                      Term loan                              Nov-22                                   150,000                18.7%                 2.87%                          2.6
                      Term loan                              Nov-23                                   150,000                18.7%                 2.77%                          3.6
                      Term loan                              Mar-24                                   100,000                12.5%                 2.77%                          3.9
                                                        Principal Amount             $                578,000
                     Unsecured Notes(2)
                      June 2017                              Jun-24                  $                 50,000                   6.2%               4.68%                          4.2
                      June 2017                              Jun-27                                    75,000                   9.3%               4.93%                          7.2
                      December 2018                          Dec-26                                    50,000                   6.2%               4.63%                          6.7
                      December 2018                          Dec-28                                    50,000                   6.2%               4.76%                          8.7
                                                        Principal Amount             $                225,000
                                               (3)
                     Mortgages Payable
                      None                                                                                  -               -                         -                            -
                     Total/Weighted Average                                          $                803,000              100.0%                 3.24%                           3.9

                     Unamortized Deferred Financing Costs
                      Credit facility                                                $                  (4,555)
                       Unsecured notes                                                                  (1,993)
                     Debt Carrying Value (GAAP)                                      $                796,452

                       Fixed rate                                                    $                525,000                   65%
                       Variable rate                                                 $                278,000                   35%

                     Credit Rating (Fitch): BBB-
___________________________
(1) Borrowings under the term loan accrue interest at an average rate of LIBOR plus 1.29%. FCPT has entered into interest rate swaps that fix 75% of the term loan's rate exposure through November 2022, 63%
     through November 2023, and 38% through March 2024. The all-in cash interest rate on the 75% of the term loan that is fixed is approximately 3.0%, 3.4%, and 3.4% for 2020, 2021, and 2022, respectively. A
     LIBOR rate of 0.99% as of 3/31/2020 is used for the 25% of term loans that are not hedged.
(2) These notes are senior unsecured fixed rate obligations of the Company.
(3) As of 3/31/2020, FCPT had no mortgage debt and 100% of FCPT properties were unencumbered.
(4) Excludes amortization of deferred financing costs on the credit facility and unsecured notes.

  9 | FCPT | Q1 2020
F C P T D E B T M AT U R I T Y S C H E D U L E

                                                                                    Current Debt Maturity Schedule

     4.6-year weighted average                                                                                                                                                                          (1)
     term for notes/term loans                                                                                                                                                 Undrawn Revolver Capacity

           65% fixed rate debt                                                                                                                                                 Drawn Revolver

   3.2% weighted average cash
          interest rate                                                                                                                                                        Unsecured Term Loan

       $72 million available on
               revolver                                                                                                                                                        Unsecured Notes
                                            $250

                                                                     $150                    $150                     $150

                                                                                                                      $100
                                            $178                                                                                                                                   $75
                                                                                                                                                                        $50                      $50

                                                                                                                       $50
                     $0

                    2020                    2021                     2022                    2023                     2024                     2025                    2026       2027           2028
% of Total Debt       0%                     22%                       19%                     19%                      19%                      0%                       6%       9%             6%
Outstanding

   ___________________
   Figures as of 3/31/2020
   (1) The revolving credit facility expires on November 9, 2021 subject to FCPT’s availability to extend the term for two additional six-month periods to November 9, 2022.

    10 | F C P T | Q 1 2 0 2 0
D E B T C O V E N AN T S

          As of March 31, 2020
          The following is a summary of the key financial covenants for our unsecured credit facility. These
          calculations are not based on U.S. GAAP measurements and are presented to demonstrate compliance
          with current credit covenants.

          Covenants                                  Requirement                                   Q1 2020
          Limitation on incurrence of total debt     ≤ 60% of consolidated capitalization value     36.4%
          Limitation on incurrence of secured debt   ≤ 40% of consolidated capitalization value       0.0%
          Fixed charge coverage ratio                ≥ 1.50x                                           5.2x
          Limitation on unencumbered leverage        ≤ 60%                                          38.0%
          Unencumbered interest coverage ratio       ≥ 1.75x                                           5.7x
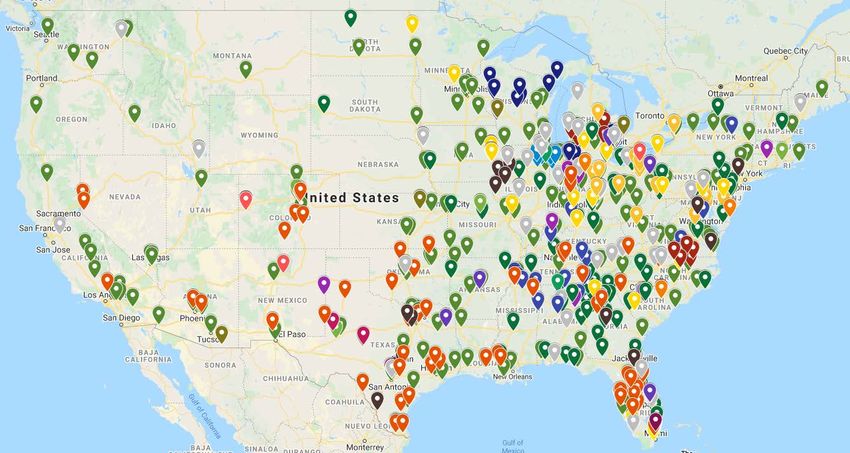
 11 | F C P T | Q 1 2 0 2 0
P R O P E R T Y L O C AT I O N S B Y B R AN D

                                                                  Lease Count:

                                                                           (1)

                                                                  725 Leases (1)
                                                                  66 Brands

  ___________________________
  Figures as of 3/31/2020
  (1) FCPT owns 722 properties as of 3/31/2020 with 725 leases.

  12 | F C P T | Q 1 2 0 2 0
B R AN D D I V E R S I F I C AT I O N

FCPT Portfolio Brands                                                                                                                                        FCPT total ABR(1):
                                                               Square Feet           % of                                                                    $142.0 million
                                                                                        (1)
Rank    Brand Name                          Number                  (000s)         ABR
1       Olive Garden                           305                   2,599         52.4%
2       Longhorn Steakhouse                    110                    614          14.5%
3       Chili's                                 64                    352            9.0%                                             15%
4       Red Lobster                             21                    155            3.4%                                           110 units
5       Burger King                             23                     74            2.3%
6       Buffalo Wild Wings                      18                    111            2.1%
7       Bahama Breeze                            9                     84            2.1%
8       Bob Evans                               17                     93            1.9%
                                                                                                                                                        9%
9       KFC                                     20                     57            1.2%                                                             64 units
10      Arby's                                  14                     44            1.0%
11      BJ's Restaurant                          7                     58            1.0%                       52%
12      Taco Bell                               11                     28            0.7%                     305 units                                 3% 13 units
                                                                                                                                                                      Other Darden2
13      Seasons 52                               2                     18            0.5%
14      Outback Steakhouse                       5                     33            0.5%                                              Other Restaurants
15      Wendy's                                  7                     24            0.5%                                                    20%
16      McDonald's                               5                     23            0.5%                                                  215 units
17      McAlister's Deli                         4                     15            0.4%
                                                                                                                                          43 brands
18      Chick-Fil-A                              5                     24            0.4%
19      Texas Roadhouse                          6                     43            0.4%
20      Starbucks                                5                     11            0.3%
21      Panera                                   4                     22            0.3%
22      Pizza Hut                                6                     15            0.3%
23      Steak 'N Shake                           4                     15            0.3%
24      Popeyes                                  4                     12            0.3%                                  Non-Restaurant Retail
25      REI                                      1                     20            0.2%                                 1% / 18 units / 16 brands
26-66   Other                                   48                     207           3.7%
        Total Lease Portfolio                  725                   4,750          100%
   ___________________
   1.   Represents current scheduled minimum Annual Cash Base Rent (ABR) as of 3/31/2020, as defined in glossary.
   2.   Other Darden represents Bahama Breeze, Cheddar’s, Seasons 52, and Eddie V’s branded restaurants.

    13 | F C P T | Q 1 2 0 2 0
G E O G R AP H I C D I V E R S I F I C AT I O N

                                                                          ND
                     WA                                   MT
                                                                                             MN
                                                                                                                                                                            ME
                                                                          SD                            WI
                                          ID                                                                            MI                                       VT NH
                     OR
                                                               WY                                                                                         NY
                                                                                                  IA                                                              MA
                                                                               NE                                                                                CT RI
                                                                                                                                               PA
                                                                                                                               OH
                                 NV                                                                      IL        IN                                     NJ
                                                     UT             CO                                                                              MD
                                                                                KS                                                   WV                  DE
                                                                                                   MO
                                                                                                                        KY                     VA

                          CA                                                                                       TN
                                                                                     OK                                                   NC
                                                                                                   AR                                                                % ABR(1)
                                                                                                                                                                     ≥10.0%
                                                   AZ               NM                                                               SC

                                                                                                        MS     AL
                                                                                                                              GA                                     5.0%–10.0%
                                                                                                   LA
                                                                               TX                                                                                    3.0%–5.0%
                                                                                                                                                                     2.0%–3.0%
                                                                                                                                                                     1.0 %–2.0%
                                                                                                                                    FL
L E AS E M AT U R I T Y S C H E D U L E

                                                      Lease Maturity Schedule (% Annualized Cash Base Rent1)

                                                                                                                        16.0%
             99.6% occupied2                  as of 3/31/2020
                                                                                   14.0%
                                                                           12.8%

                                                                                           11.4% 11.3%
             Weighted average lease term of                                                              10.4%
                       10.8 years

                                                                                                                 7.4%

             Less than 6.1% of rental income
                  matures prior to 2027
                                                                                                                                                     2.9%          3.2%
                                                                                                                                              2.5%

                                  1.2% 0.9% 1.3% 1.1%                                                                           1.0% 0.7%
                        0.7%                          0.8%
              0.0%                                                                                                                                          0.2%          0.1%

              2020      2021      2022      2023      2024   2025   2026   2027    2028    2029   2030   2031    2032   2033    2034   2035   2036   2037   2038   2039   2040

___________________
Note: Excludes renewal options. All data as of 3/31/2020
1.    Annual cash base rent (ABR) as defined in glossary.
2.    Occupancy based on portfolio square footage.

15 | F C P T | Q 1 2 0 2 0
G L O S S AR Y AN D N O N - G A A P D E F I N I T I O N S

                                          Non-GAAP Definitions and Cautionary Note Regarding Forward-Looking Statements:
This document includes certain non-GAAP financial measures that             employed by other REITs.                                                  condition and results from operations, the utility of FFO as a measure
management believes are helpful in understanding our business, as                                                                                     of our performance is limited. FFO is a non-GAAP measure and
further described below. Our definition and calculation of non-GAAP         Tenant EBITDAR is calculated as EBITDA plus rental expense.               should not be considered a measure of liquidity including our ability
financial measures may differ from those of other REITs and therefore       EBITDAR is derived from the most recent data provided by tenants          to pay dividends or make distributions. In addition, our calculations of
may not be comparable. The non-GAAP measures should not be                  that disclose this information, representing approximately 89% of our     FFO are not necessarily comparable to FFO as calculated by other
considered an alternative to net income as an indicator of our              ABR. For Darden, EBITDAR is updated once annually by multiplying          REITs that do not use the same definition or implementation
performance and should be considered only a supplement to net               the most recent individual property level sales information (reported     guidelines or interpret the standards differently from us. Investors in
income, and to cash flows from operating, investing or financing            by Darden twice annually to FCPT) by the brand average EBITDA             our securities should not rely on these measures as a substitute for any
activities as a measure of profitability and/or liquidity, computed in      margin reported by Darden in its most recent comparable period, and       GAAP measure, including net income.
accordance with GAAP.                                                       then adding back property level rent. FCPT does not independently
                                                                            verify financial information provided by its tenants.                     Adjusted Funds From Operations “AFFO” is a non-GAAP
ABR refers to annual cash base rent as of 3/31/2020 and represents                                                                                    measure that is used as a supplemental operating measure specifically
monthly contractual cash rent, excluding percentage rents, from             Tenant EBITDAR coverage is calculated by dividing our reporting           for comparing year over year ability to fund dividend distribution
leases, recognized during the final month of the reporting period,          tenants’ most recently reported EBITDAR by annual in-place cash           from operating activities. AFFO is used by us as a basis to address our
adjusted to exclude amounts received from properties sold during that       base rent.                                                                ability to fund our dividend payments. We calculate adjusted funds
period and adjusted to include a full month of contractual rent for                                                                                   from operations by adding to or subtracting from FFO:
properties acquired during that period.                                     Funds From Operations (“FFO”) is a supplemental measure of our              1. Transaction costs incurred in connection with the acquisition of
                                                                            performance which should be considered along with, but not as an                 real estate investments
EBITDA represents earnings (GAAP net income) plus interest                  alternative to, net income and cash provided by operating activities as     2. Stock-based compensation expense
expense, income tax expense, depreciation and amortization.                 a measure of operating performance and liquidity. We calculate FFO          3. Amortization of deferred financing costs
                                                                            in accordance with the standards established by NAREIT. FFO                 4. Other non-cash interest expense
EBITDAre is a non-GAAP measure computed in accordance with                  represents net income (loss) (computed in accordance with GAAP),            5. Non-real estate depreciation
the definition adopted by the National Association of Real Estate           excluding gains (or losses) from sales of property and undepreciated        6. Merger, restructuring and other related costs
Investment Trusts (“NAREIT”) as EBITDA (as defined above)                   land and impairment write-downs of depreciable real estate, plus real       7. Impairment charges on non-real estate assets
excluding gains (or losses) on the disposition of depreciable real estate   estate related depreciation and amortization (excluding amortization        8. Amortization of capitalized leasing costs
and real estate impairment losses.                                          of deferred financing costs) and after adjustments for unconsolidated       9. Straight-line rent revenue adjustment
                                                                            partnerships and joint ventures. We also omit the tax impact of non-        10. Amortization of above and below market leases
Adjusted EBITDAre is computed as EBITDAre (as defined above)                FFO producing activities from FFO determined in accordance with the         11. Debt extinguishment gains and losses
excluding transaction costs incurred in connection with the acquisition     NAREIT definition.                                                          12. Recurring capital expenditures and tenant improvements
of real estate investments and gains or losses on the extinguishment of
debt.                                                                       Our management uses FFO as a supplemental performance measure             AFFO is not intended to represent cash flow from operations for the
                                                                            because, in excluding real estate related depreciation and amortization   period, and is only intended to provide an additional measure of
We believe that presenting supplemental reporting measures, or non-         and gains and losses from property dispositions, it provides a            performance by adjusting the effect of certain items noted above
GAAP measures, such as EBITDA, EBITDAre and Adjusted                        performance measure that, when compared year over year, captures          included in FFO. AFFO is a widely-reported measure by other REITs;
EBITDAre, is useful to investors and analysts because it provides           trends in occupancy rates, rental rates and operating costs. We offer     however, other REITs may use different methodologies for
important information concerning our on-going operating                     this measure because we recognize that FFO will be used by investors      calculating AFFO and, accordingly, our AFFO may not be
performance exclusive of certain non-cash and other costs. These non-       as a basis to compare our operating performance with that of other        comparable to other REITs.
GAAP measures have limitations as they do not include all items of          REITs. However, because FFO excludes depreciation and
income and expense that affect operations. Accordingly, they should         amortization and captures neither the changes in the value of our         Properties refers to properties available for lease.
not be considered alternatives to GAAP net income as a performance          properties that result from use or market conditions, nor the level of
measure and should be considered in addition to, and not in lieu of,        capital expenditures and capitalized leasing commissions necessary to
GAAP financial measures. Our presentation of such non-GAAP                  maintain the operating performance of our properties, all of which
measures may not be comparable to similarly titled measures                 have real economic effect and could materially impact our financial

    16 | F C P T | Q 1 2 0 2 0
R E C O N C I L I AT I O N O F N E T I N C O M E T O
AD J U S T E D E B I T D A R E

                       ($000s, except shares and per share data)             Three Months Ended March 31,
                       Unaudited                                               2020              2019
                       Net Income                                          $       19,336    $       17,601
                       Adjustments:
                         Interest expense                                           7,003             6,747
                         Income tax expense                                            61                68
                         Depreciation and amortization                              7,054             6,361
                       EBITDA(1)                                                   33,454            30,777
                       Adjustments:
                        Gain on dispositions and exchange of real estate              -                 -
                        Provision for impairment of real estate                       -                 -
                                          (1)
                       EBITDAre                                                    33,454            30,777
                       Adjustments:
                        Real estate transaction costs                                  23               -
                        Gain or loss on extinguishment of debt                        -                 -
                       Adjusted EBITDAre (1)                                       33,477            30,777
                       Annualized Adjusted EBITDAre                        $      133,907   $       123,108

___________________________
(1) See glossary on page 16 for non-GAAP definitions.

17 | F C P T | Q 1 2 0 2 0
FOUR CORNERS PROPERTY TRUST
           NYSE: FCPT

S U P P L E M E N T AL F I N AN C I AL & O P E R AT I N G I N F O R M AT I O N | Q 1 2 0 2 0   www.fcpt.com

 18 | F C P T | Q 1 2 0 2 0
You can also read