LAFARGE AFRICA PLC
     Analyst Presentation

             June 20th, 2019
←
→
Page content transcription
If your browser does not render page correctly, please read the page content below
LAFARGE AFRICA PLC
Analyst Presentation
June 20th, 2019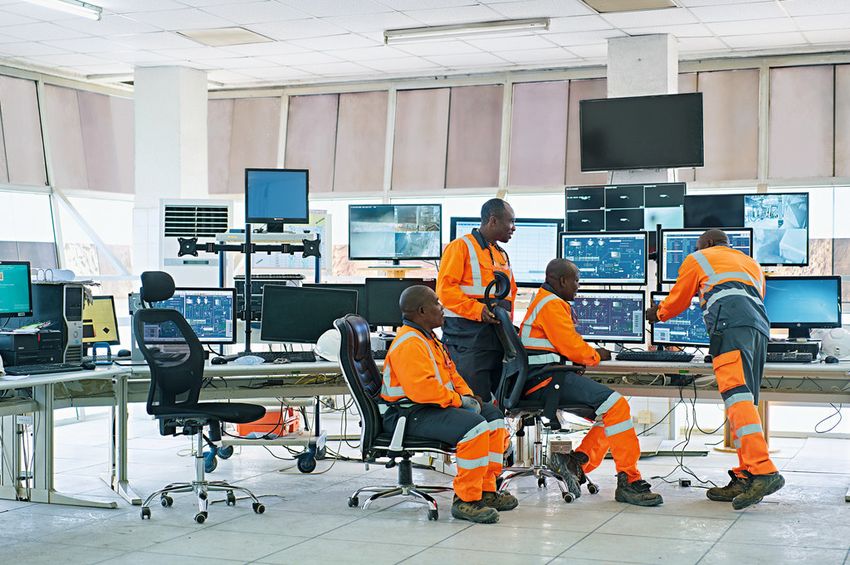
Agenda

Section 1 – Q4 and 2018 Full Year Results

Section 2 – Q1 2019 Results

Section 3 – Divestment of South African Operations

                                                     2
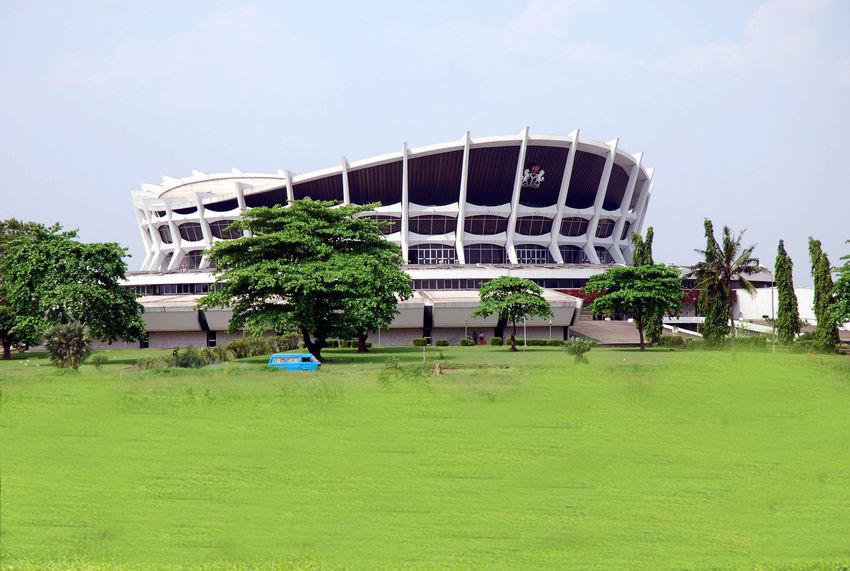
Lekki-Ikoyi Link Bridge, Lagos, Nigeria

  Q4 and FY 2018 Results
  Michel Puchercos, CEO
  Bruno Bayet, CFO
OVERVIEW OF GROUP RESULTS
Turnaround Plan delivering positive results in Q4

q FY 2018 Revenue at N308,4bn (+3,1% vs LY)
         FY 2018 revenue in Nigeria grew at +6,5% vs LY with revenue at N217,8bn. Trend
         continued in Q4 with revenue at N52,2bn (+6,8% vs LY)
         South Africa FY 2018 revenue at N90,6bn (-4,3% vs LY)

q Operating EBITDA at N51,0bn in FY 2018
         Nigeria: Operating EBITDA of N58,4bn and EBITDA margin of 27%, impacted by Inventory
         N9.4bn
         Restructuring plan delivering in South Africa. EBITDA in Q4 up 113% vs LY

q Operating Profit multiplied by 3x in 2018

                                           Audited Quarter 4 and FY 2018 - Analyst Presentation   4
2018 KEY FIGURES

 Cement Volumes
                          Net Sales                   Operating Profit                       Free Cash Flow
     Sold

      +4%                +3,1%                            +215%                                  +121%
   (+9% Nigeria)         (+7% Nigeria)
                                                                                                       Q4 2018

      6,097 kt             N308,4 bn                         N24,8 bn                             N1,9 bn
Q4 2018              Q4 2018

          +6%                  -1,8%
    (+10% Nigeria)        (+7% Nigeria)

                                          Audited Quarter 4 and FY 2018 - Analyst Presentation                   5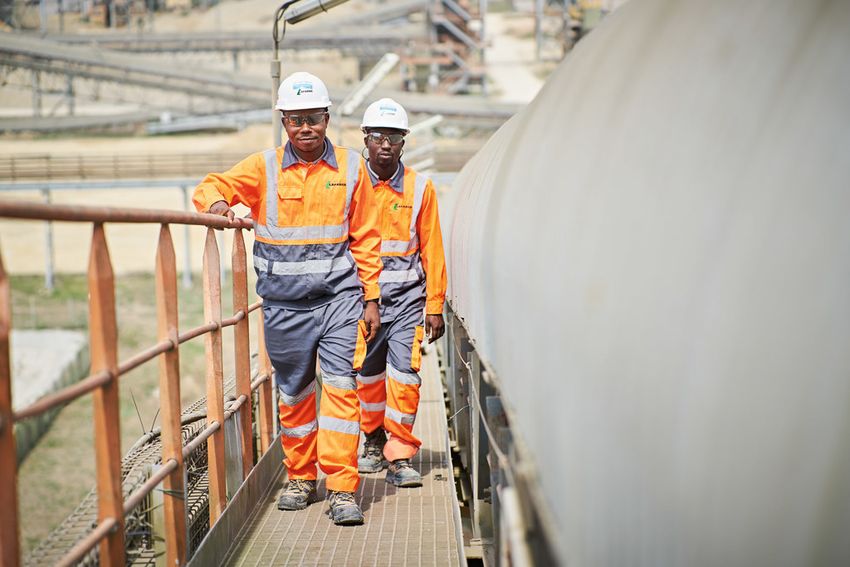
FINANCIAL PERFORMANCE Q4 AND FY 2018
(in NGN Million)                                                       Q4 2018          Q4 2017            Variation      FY 2018     FY 2017 Variation

Net Sales                                                                 74,125           75,485           -1.8%         308,425     299,153    3.1%
Operating EBITDA                                                          12,982           12,920            0.5%           51,044     57,610    -11.4%
% margin                                                                     18%             17%                               17%        19%
                                     1
Restructuring, litigation and others                                         (652)         (7,623)                          (2,812)   (10,378)
                                                                                                                                              2
Depreciation & amortization                                                (5,889)        (25,578)                         (22,877)   (41,752)
                                                                                                                                             3
Net other income/(expenses)                                                  (762)           (427)                            (543)     2,406
EBIT                                                                        5,679         (20,708)                          24,811      7,886 214.6%
% margin                                                                       8%            -27%                               8%         3%
Net finance costs & FX loss                                              (10,772)         (14,278)                         (44,254)   (41,778)
Share in net income or (loss) from Associates                                (54)            (140)                             (65)      (140)
Net Income Before Taxes                                                   (5,148)         (35,126)          85.3%          (19,508)   (34,032)   42.7%
Income taxes                                                               6,719             (413)                          10,707       (569)
Profit After Tax                                                           1,571          (35,539)          104.4%          (8,802)   (34,601)   74.6%
1 Others include SAP implementation and other non-recurring costs
2 Includes impairment of Mfamosing road and Ashaka pre-heater, S.A. PPE impairment of kiln 2 Lichtenburg
3 Other Income relates largely to the disposal gain on building (Elephant House) sold in 2017

             Net sales increased by 3,1% in FY 2018, slow growth largely affected by South Africa
             Nigeria performance remain strong. Positive performance trend in South Africa with recovery in Q4.
             Operating profit x3
             Pioneer Certificate delivered for Mfamosing Line 2

                                                                               Audited Quarter 4 and FY 2018 - Analyst Presentation                       6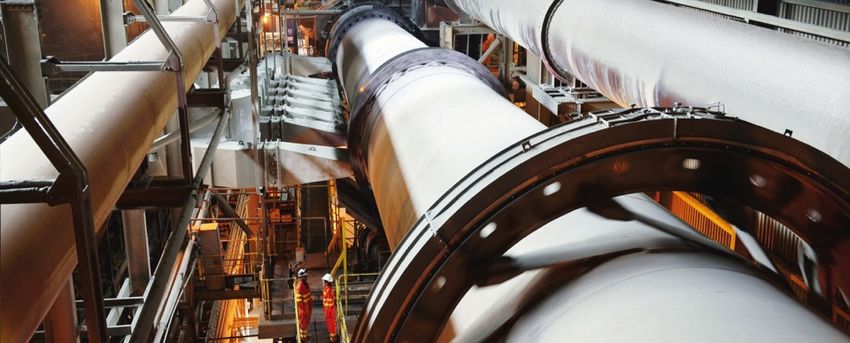
REGIONAL PERFORMANCE - NIGERIA
NIGERIA CONTINUE GOOD PROGRESS ON TURNAROUND AND STRATEGY EXECUTION
(in NGN Million)                                                      Q4 2018    Q4 2017       Variation             FY 2018          FY 2017    Variation
Volume
- Cement (kt)                                                           1,158        1,057       9.6%                   4,841           4,458      8.6%
- Ready-Mix (Kcm3)                                                         47            31      51.9%                    191              174     9.8%

Net Sales                                                              52,186       48,874        6.8%               217,813          204,485      6.5%
Operating EBITDA                                                       12,569       16,213      -22.5%                 58,432          66,085     -11.6%
% margin                                                                 24%           33%                               27%              32%
                                     1
Restructuring, litigation and others                                     (355)      (2,729)                              (716)         (5,189)
Depreciation & amortization                                            (4,705)     (20,684)     -77.3%                (18,734)        (34,042)    -45.0%
Net other non-operating income/(expenses)                                (560)         504                               (453)          3,302
EBIT                                                                    6,949       (6,696)     203.8%                 38,528          30,156     27.8%
% margin                                                                 13%          -14%                                18%            15%
Net finance costs & FX loss                                            (8,909)     (13,610)                           (40,038)        (39,815)
Share in net income or (loss) from Associates                             -           (112)                               -              (112)
Net Income Before Taxes                                                (1,960)     (20,418)      90.4%                 (1,510)         (9,772)    84.5%
                                                                                                                                  2
Income taxes                                                            9,711       (2,328)                             9,607          (6,127)
Profit After Tax                                                        7,751      (22,746)     134.1%                  8,097         (15,899)    150.9%
1   Others include SAP implementation and other non-recurring costs
2   Pioneer status and deduction of evacuation road

           Implementation of route-to-market strategy impacting performance favorably despite price erosion in 2018
           Strong contribution from fuel and energy strategy and strict cost discipline
           Decline in FY 2018 EBITDA (-22,5% vs LY), largely attributable to inventory movement and SAP related costs
           Significant improvement in net finance costs and FX in Q4 (-35% vs LY) thanks to hedging and additional BOI fund

                                                                                                                Lafarge Africa Staff
                                                                           Audited Quarter 4 and FY 2018 - Analyst Presentation                           7
REGIONAL PERFORMANCE – SOUTH AFRICA
STRONG IMPROVEMENT IN Q4 DESPITE WEAK RESULTS FROM FULL YEAR

(in NGN Million)                                      Q4 2018     Q4 2017       Variation             FY 2018 FY 2017 Variation

Net Sales                                               21,940       26,611       -17.6%                90,612    94,669        -4.3%
Operating EBITDA                                          413        (3,292)      112.5%                (7,388)       (8,475)   12.8%
% margin                                                  -4%          -12%                                -9%           -9%
                                               1
Restructuring, litigation and others                      (297)      (4,895)                            (2,096) (5,189)
Depreciation & amortization                             (1,184)      (5,744)      -79.4%                (4,144) (8,559)         -51.6%
Net other non-operating income/(expenses)                 (199)          (81)                               (90)     (47)
EBIT                                                    (1,267)     (14,012)      91.0%                (13,718) (22,270)        38.4%
% margin                                                  -10%         -53%                               -16%     -24%
Net finance costs & FX loss                             (1,863)        (668)                            (4,216) (1,962)
Share in net income or (loss) from Associates              (54)         (28)                               (65)     (28)
Net Income Before Taxes                                 (3,185)     (14,707)      78.3%                (17,999) (24,261)        25.8%
Income taxes                                            (2,992)       1,914                              1,100    5,558
Profit After Tax                                        (6,177)     (12,793)      51.7%                (16,899) (18,703)        9.6%
1   Others include other non-recurring costs

            South African construction market continued to decline in Q4 affecting our aggregates operations by -15,8%,
            while progressive recovery in our cement activities. Price increase to compensate for inflation
            Continuous implementation of the turnaround plan yielding significant EBITDA improvement in Q4 (+113% vs LY)
                                                                                               Lafarge Africa Staff
            Restructuring costs reflecting the SG&A cost saving program

                                                          Audited Quarter 4 and FY 2018 - Analyst Presentation                           8
Q1 2019 Results Michel Puchercos, CEO Bruno Bayet, CFO
Q1 2019 HIGHLIGHTS
Turnaround plan retaining momentum in line with plan in Q1

q Q1 2019 Revenue down 2,6% to N78,5bn
        Q1 2019 revenue in Nigeria grew +0,6% vs LY with revenue at N58bn

        South Africa Q1 2019 revenue at N20,5bn (-10,8% vs LY), impacted by economic slowdown

q Recurring EBITDA at N15,1bn in Q1 2019 (+6,7% vs LY) (pre-IFRS 16)
        Nigeria: Recurring EBITDA of N16,9bn and EBITDA margin of 29%
        Restructuring plan delivering in South Africa. EBITDA in Q1 up 55,7%

q Restored earnings with Profit After Tax of N3.1bn
q Successful Rights Issue fully subscribed deleveraging Lafarge Africa by N88,4bn

                                               Unaudited Quarter 1 2019 - Analyst Presentation   10
Q1 2019 KEY FIGURES
Cement Volumes Recurring EBITDA
Net Sales Free Cash Flow
Sold (pre-IFRS 16)
+1% -2,6% +6,7% +N10,8bn
(+2% Nigeria) (+1% Nigeria) (+55,7% South Africa)
1,635 kt 78,5 bnN 15,1 bnN 25,0 bnN
Unaudited Quarter 1 2019 - Analyst Presentation 11Q1 2019 PERFORMANCE
(NGN’bn)
Net Sales Recurring EBITDA
(pre-IFRS 16)
80.6 -2,6% 15.1
+6,7%
78.5
14.2
Q1 2018 Q1 2019 Q1 2018 Q1 2019
Unaudited Quarter 1 2019 - Analyst Presentation 12Q1 2019 PERFORMANCE
(in NGN Million) Q1 2019 Q1 2018 Variation
Net Sales 78,512 80,643 -2.6%
Recurring EBITDA (pre-IFRS 16) 15,113 14,161 6.7%
% margin 19% 18%
Recurring EBITDA (post-IFRS 16) 18,686 - 31.9%
Restructuring, litigation & others (345) (92)
Depreciation and amortization (8,434) (5,644)
Net other non-operating income/expenses (1,482) (2,169)
Operating profit 8,425 6,256 34.7%
% margin 11% 8%
Net finance costs (8,281) (9,202) 10.0%
Share in net income from Associates (21) -
Net Income Before Taxes 123 (2,946)
Income taxes 3,022 944
Profit (Loss) After Tax 3,145 (2,002)
Net sales down 2,6% in Q1 2019, largely affected by South
Africa
Significant improvement in Q1 2019 EBITDA and operating
profit, attributable to turnaround and cost reduction strategy
Reduction of finance costs since proceed from Rights Issue
Strong improvement in earnings with Profit After Tax of
N3,1bn
Unaudited Quarter 1 2019 - Analyst Presentation 13REGIONAL PERFORMANCE – NIGERIA
VISIBLE RESULTS FROM TURNAROUND AND STRATEGY EXECUTION
(in NGN Million) Q1 2019 Q1 2018 Variation
Net Sales 58,016 57,671 0.6%
Recurring EBITDA (pre-IFRS 16) 16,916 18,233 -7.2%
% margin 29% 32%
Recurring EBITDA (post-IFRS 16) 20,305 -
Restructuring, litigation and others - -
Depreciation and amortization (7,350) (4,630)
Net other non-operating income/expenses (1,461) (2,169)
EBIT 11,494 11,433 0.5%
% margin 20% 20%
Net finance costs (6,907) (8,441) 18.2%
Share in net income from Associates - -
Net Income Before Taxes 4,588 2,992 53.3%
Income taxes 1,714 (616)
Profit (Loss) After Tax 6,302 2,376 165.2%
Q1 2019 net sales at N58bn, up +0,6%, despite election
impact and price erosion
Turnaround strategy and cost reduction effort delivering
results.
Unaudited Quarter 1 2019 - Analyst Presentation 14REGIONAL PERFORMANCE – SOUTH AFRICA
ECONOMIC SLOWDOWN STILL IMPACTING PERFORMANCE
(in NGN Million) Q1 2019 Q1 2018 Variation
Net Sales 20,495 22,972 -10.8%
Recurring EBITDA (pre-IFRS 16) (1,803) (4,072) 55.7%
% margin -9% -18%
Recurring EBITDA (post-IFRS 16) (1,619) -
Restructuring, litigation & others (345) (92)
Depreciation and amortization (1,084) (1,014)
Net other non-operating income/expenses (21) -
EBIT (3,069) (5,178) 40.7%
% margin -15% -23%
Net finance costs (1,374) (761)
Share in net income from Associates (21) -
Net Income Before Taxes (4,465) (5,938) 24.8%
Income taxes 1,308 1,560
Profit (Loss) After Tax (3,157) (4,378) 27.9%
Net sales was down 10,8% vs LY, despite price increase
Countinuity of accelerated industrial performance and cost
reduction effort in line with turnaround strategy
Q1 2019 impacted by kiln shut down and purchase of clinker
Improvement in EBITDA , compared to LY
Unaudited Quarter 1 2019 - Analyst Presentation 15DELEVERAGING : SUCCESSFUL RIGHTS ISSUE FOR N88,4BN
Successful rights issue concluded on 8 March 2019
Fully subscribed enabling the deleveraging of Lafarge Africa
Proceed to affect favorably Q1 2019 financial charges
Before Rights Issue After Rights Issue
Associated Lafarge Associated Lafarge
Caricement BV International Associated Caricement BV International Associated
Cement Nigeria Ltd Cement Nigeria Ltd
48.55% 18.82% 8.95% 56.04% 22.95% 4.82%
LafargeHolcim Minority LafargeHolcim Minority
Group shareholders Group shareholders
76.3% 23.7% 83.8% 16.2%
Lafarge Africa Plc Lafarge Africa Plc
Unaudited Quarter 1 2019 - Analyst Presentation 16GROUP NET FINANCIAL DEBT Q1 2019
(NGN’bn)
-41,0%
(105,2)
22,0
(1,0)
289,6
205,4
183,4
NFD Dec 2018 Nigeria South Africa NFD Mar 2019 (pre-IFRS IFRS 16 NFD Mar 2019 (post-IFRS
16) 16)
Unaudited Quarter 1 2019 - Analyst Presentation 17NIGERIA NET FINANCIAL DEBT Q1 2019
(NGN’bn)
(25,9)
6,9
(88,4)
19,9
3,2 (1,0)
247,5
162.2
142,3
NFD Dec 2018 Cashflow from Capital Rights issue Net finance cost Others NFD Mar 2019 IFRS 16 NFD Mar 2019
operations expenditure proceeds paid (pre-IFRS 16) (post-IFRS 16)
Unaudited Quarter 1 2019 - Analyst Presentation 18OUTLOOK 2019
q Nigeria
Positive trend in cement growth expected in Q2
Stable pricing environment foreseen in Q2
Cost reduction strategy, route-to-market and energy initiatives to continue to deliver in Q2
Significant deleverage and reduction in finance costs from Q2
Unaudited Quarter 1 2019 - Analyst Presentation 19STRONG AMBITION FOR 2019
ACCELERATION OF GROWTH AND IMPROVEMENT OF EARNINGS
To be achieved through full deployment of route-to-market
Growth initiatives commercial strategy and product portfolio expansion
Logistics & supply Further improve service delivery to meet clients’ demands and
chain deepen penetration
Continuous implementation of energy efficiency initiatives to drive
Production down production costs
efficiencies
SAP implementation as an enabler performance efficiency
Fixed costs Cost optimization and pioneer tax status to lead expense savings
reduction and tax
savings
Restructure existing debt from rights issue proceeds and divestment
Deleveraging from South Africa to optimize shareholders’ returns
Unaudited Quarter 1 2019 - Analyst Presentation 20Lekki-Ikoyi Link Bridge, Lagos, Nigeria Proposed Divestment of Lafarge South Africa Holdings (LSAH) Bruno Bayet, CFO
DIVESTMENT OF SOUTH AFRICA OPERATIONS
                                Ø    Lafarge Africa Plc (Seller)
Parties to the Transaction      Ø    Caricement BV, an affiliate of the LafargeHolcim Group (Buyer)
                                Ø    Lafarge South Africa Holding (Pty) (Target)

Stake being sold                Ø    100%

Transaction value               Ø    US$317 mn

                                Ø    Set-off of 100% intercompany loan (293 mn$) plus interest as per
Use of proceeds
                                     31/07/2019

                                Ø    Standard Chartered Bank
Financial Advisers              Ø    PwC

Legal Advisers                  Ø    Aluko & Oyebode

                                                                                                        22
                             Source : Extract from Explanatory Note
BACKGROUND
KPMG Professional Services as auditors informed the management
that, based upon its assessment of the 2018 performance of LSAH, the
External Auditors valuation of LSAH in the accounts of the Company would have to be
Assessment of LSAH impaired to a tune of N 70 billion.
› The Board sought optimal resolution of this significant issue
› Considered various options including an immediate exit
› The Board then arrived at the conclusion that the disposal of LSAH was
the best option for limiting any further downside
› The Board reached the conclusion that a buy-back by LafargeHolcim
Action taken by (LH) was the most appropriate means of deriving the best value from
the Board Of Directors the proposed sale in the interest of all stakeholders and most especially
the minority shareholders.
› Understanding the implication of the potential impairment on the
Company, LH acted timeously by agreeing to enter into negotiations
with the Company with respect to the potential sale.
23
Source : Extract from Explanatory NotePROCESS AND VALUATION
› Constitution of the Independent Committee
• Recusal of LH Group Directors
• Appointment of Transaction Advisers
• Valuation of LSAH by the Financial Adviser
› Negotiation on terms of the transaction done by the Independent
Action taken by committee and representatives of the LH Group
the Board Of Directors
› Fairness opinion by PwC
› Independent Committee’s recommendation to the Board for approval
› NSE Clearance of Explanatory Note and “No Objection” of the
Securities & Exchange Commission
› Valuation range
• Equity value range of US$50 million – US$117 million
• SCB estimated current market value at US$50 million or less
(bottom end of EV/2020 EBITDA range, plus estimated value of
Valuation Summary tax losses)
› Market Value could increase to US$100 million – US$140 million, if
LSAH demonstrates progress towards its 2021 financial projections
› LSAH’s carrying value on the books of Lafarge Africa is a historical cost
of N118.10 billion (c.US$328.05 million)
24
Source : Extract from Explanatory NoteBENEFITS OF THE PROPOSED TRANSACTION
q Transaction objective
The Proposed Sale is expected to enhance the value of shareholders’ investments in
Lafarge Africa. The proceed of the Proposed Sale (US$317m) will be used to completely
extinguished Lafarge Africa’s shareholder loan of US$293 million and accumulated
interests as at July 31, 2019.
q Benefits of the transaction
Boost Lafarge Africa’s cash-flow and net income, given the reduction in debt service
outflows;
Eliminate fully all foreign currency denominated debt and cut annual interest expense by
c.N9.9 billion on account of the full repayment of the foreign currency shareholder loan;
Enable Lafarge Africa to reinvest in (and expand) operations in existing plants;
Enable the management of Lafarge Africa to devote attention to its Nigerian plants;
Strengthen Lafarge Africa’s Balance Sheet
25PRO FORMA IMPACT ON THE NET FINANCIAL DEBT
(113,8)
205,4
8.41
(43,2)
56.8
NFD Q1 2019 Offer price (LSAH) Payment of interest Deconsolidation of LSAH Pro forma NFD Q1 2019
1Interest paid on shareholders’ loan. Agreement signed on 26 September 2018 included the provision of a 2-year moratorium on the payment of the interest
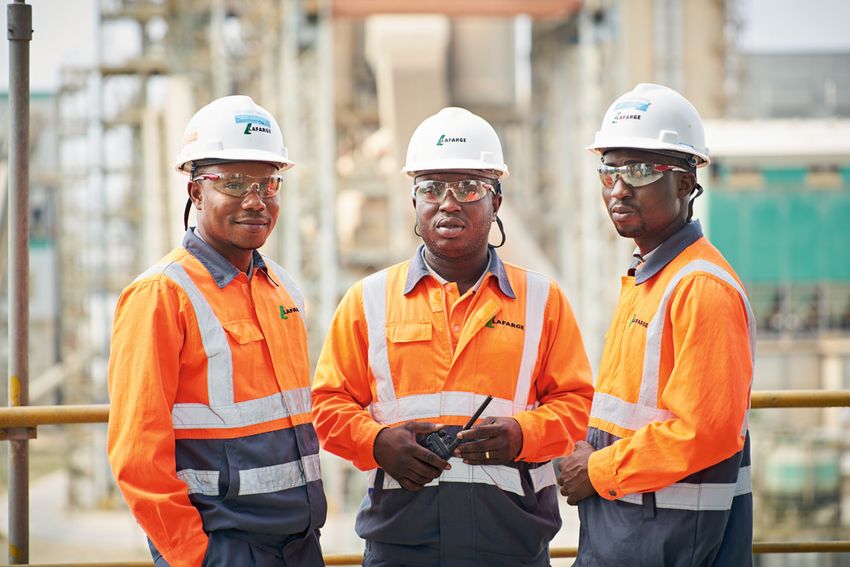
Unaudited Quarter 1 2019 - Analyst Presentation 26Ewekoro Plant Appendix
FY 2018 CONDENSED STATEMENT OF FINANCIAL POSITION
                                 31/12/2018    31/12/2017                                                31/12/2018    31/12/2017

ASSETS                                                      LIABILITIES
Property, plant and equipment   394,488,765   393,651,934   Borrowings                                  172,373,209    78,278,215
Intangible assets                 6,194,518     2,634,326   Deferred tax liabilities                     10,200,112     1,463,106
Other assets                     16,837,851    20,803,114   Provisions                                    3,645,751     3,472,388
Other financial assets            1,135,057     1,582,622   Deferred revenue                              2,597,602     1,518,467
Deferred tax asset               28,720,032    17,514,432   Employee benefits obligation                  4,729,183     4,916,931
NON-CURRENT ASSETS              447,376,223   436,186,427   NON-CURRENT LIABILITIES                     193,545,857    89,649,107

Inventories                      47,156,521    58,266,466   Trade & other payables                       80,537,817   113,000,180
Trade & other receivables        21,163,993    25,110,116   Borrowings                                   93,833,850   187,831,583
Other assets                     10,594,409    15,162,092   Provisions                                    1,281,247     1,166,217
Other financial assets            1,140,956      592,539    Deferred revenue                               315,452       110,732
Current tax asset                  658,291       917,797    Current tax payable                           1,156,231     3,251,525
Derivative assets                   95,573       640,091    Derivative liability                           244,176      4,212,406
Cash and cash equivalents        12,550,697    50,414,757   Bank overdraft                               35,280,945    31,081,780
CURRENT ASSETS                   93,360,440   151,103,857   CURRENT LIABILITIES                         212,649,718   340,654,422

TOTAL ASSETS                    540,736,663   587,290,284   TOTAL EQUITIES & LIABILITIES                540,736,663   587,290,284

                                                      Unaudited Quarter 1 2019 - Analyst Presentation                         28
Q1 2019 CONDENSED STATEMENT OF FINANCIAL POSITION
31/3/2019 31/3/2018 31/3/2019 31/3/2018
ASSETS LIABILITIES
Property, plant and equipment 419,603,074 394,488,764 Borrowings 190,745,218 172,707,588
Intangible assets 6,061,431 6,194,518 Deferred tax liabilities 10,040,362 10,200,112
Other assets 15,050,728 16,671,760 Provisions 2,720,365 3,645,751
Other financial assets 1,327,655 1,301,148 Deferred revenue 2,517,079 2,597,602
Deferred tax asset 32,065,541 28,720,032 Employee benefits obligation 4,840,192 4,394,804
NON-CURRENT ASSETS 474,108,430 447,376,222 NON-CURRENT LIABILITIES 210,863,216 193,545,857
Inventories 43,330,783 47,156,521 Trade & other payables 93,489,374 80,537,818
Trade & other receivables 21,397,926 21,163,993 Borrowings 41,199,276 93,833,850
Other assets 9,221,389 10,594,409 Provisions 1,291,038 1,281,247
Other financial assets 819,109 1,140,956 Deferred revenue 555,925 315,452
Current tax asset 466,439 658,291 Current tax payable 1,770,034 1,156,231
Derivative assets 95,574 95,574 Derivative liability 1,748,176 244,176
Cash and cash equivalents 47,758,296 12,550,697 Bank overdraft 21,242,000 35,280,945
CURRENT ASSETS 123,089,516 93,360,441 CURRENT LIABILITIES 161,295,823 212,649,719
TOTAL ASSETS 597,197,946 540,736,663 TOTAL EQUITIES & LIABILITIES 597,197,946 540,736,663
Unaudited Quarter 1 2019 - Analyst Presentation 29Disclaimer
This presentation is based on Lafarge Africa Plc’s audited financial results for the Q4/FY 2018 and Q1 2019 consistent with IFRS reporting
standards and these figures are for illustrative purposes. Lafarge Africa Plc (“Lafarge Africa” or the “Company”) has obtained information in this
presentation from sources it believes to be reliable. Although Lafarge Africa has taken all reasonable care to ensure that the information herein
is correct and accurate, Lafarge Africa makes no representation or warranty, express or implied, as to the accuracy, completeness or
correctness of such information. Furthermore, Lafarge Africa makes no representation or warranty, express or implied, that its future operating,
financial or other results will be consistent with results implied, directly or indirectly, by information contained herein or with Lafarge Africa’s past
operating, financial or other results. Any information herein is as of the date of this presentation and may change without notice.
Lafarge Africa undertakes no obligation to update the information in this presentation. In addition, some of the information in this presentation
may be condensed or incomplete, and this presentation may not contain all material information in respect of the Company.
This presentation also contains “forward-looking statements” that relate to, among other things, Lafarge Africa’s plans, objectives, goals,
strategies, future operations and performance. Such forward-looking statements may be characterized by words such as “estimates,” “aims,”
“expects,” “projects,” “believes,” “intends,” “plans,” “may,” “will” and “should” and similar expressions but are not the exclusive means of
identifying such statements. Such forward-looking statements involve known and unknown risks, uncertainties and other important factors that
could cause Lafarge Africa’s operating, financial or other results to be materially different from the operating, financial or other results
expressed or implied by such statements. These factors should be considered carefully and undue reliance should not be placed on the
forward-looking statements. For additional information with respect to certain risks or factors, reference should be made to Lafarge Africa’s
continuous disclosure materials filed from time to time with the Nigerian Stock Exchange and other relevant regulatory authorities.
Although Lafarge Africa believes the basis for such forward-looking statements to be fair and reasonable, Lafarge Africa makes no
representation or warranty, express or implied, as to the fairness or reasonableness of such forward-looking statements. Furthermore, Lafarge
Africa makes no representation or warranty, express or implied, that the operating, financial or other results anticipated by such forward looking
statements will be achieved. Such forward-looking statements represent, in each case, only one of many possible scenarios and should not be
viewed as the most likely or standard scenario. Lafarge Africa undertakes no obligation to update the forward-looking statements in this
presentation.
Not for distribution directly or indirectly into the United States, Canada, Australia or Japan or to US persons.
30You can also read