Thule Group Road Show Presentation - October-November, 2016

Page created by Samuel Hernandez
 
CONTINUE READING
Thule Group Road Show Presentation - October-November, 2016
Thule Group
Road Show Presentation
October-November, 2016
Thule Group Road Show Presentation - October-November, 2016
The Thule Group Vision – Active Life, Simplified.

Slide 2         Thule Group AB (publ) – Road Show Presentation, October-November 2016
Thule Group Road Show Presentation - October-November, 2016
We are a Global Premium Branded Sports&Outdoor Company
                         Net Sales by Segment 2015                                                Net Sales and Underlying EBIT Breakdown
                                                                                               2015 (SEKm)
    Outdoor&Bags                                                                                                            Underlying EBIT Margin:
    (91%)                                                                                                                            16.0%
                                             Sport&Cargo
                                               Carriers                                                       5,320
                                                  60%                                                 9%
       Region
      Americas
          34%
          35%                                    Bags for                                                      91%                850        6%
                                                Electronic
                                                 Devices
                                                                                                                                  94%
                                                   16%
                                                                                                             Outdoor&Bags      Specialty
                        Region
                    Europe and ROW               Other
                            65%              Outdoor&Bags                                            Global Reach – Sales in 140 Countries
                                                   15%

    Specialty
    (9%)
                                               Work Gear

                                                   9%

     Source: Company informatio

Slide 3                           Thule Group AB (publ) – Road Show Presentation, October-November 2016
Thule Group Road Show Presentation - October-November, 2016
A Compelling Story in the Attractive Sports&Outdoor Market
                        1                                                                           2

                We Operate in                                                        We have Everything in Place to
             an Attractive Market                                                      Deliver Profitable Growth

                                                              Strong User-influenced Innovation and Product Development
                                                              Differentiated Premium Brand

        Favorable Mega-Trends Driving                        Global Route-to-Market Strategy and Implementation
         Long-Term Market Growth                              Strong Position in the Value Chain
                                                              Sustainable business approach

4                           Thule Group AB (publ) – Road Show Presentation, October-November 2016
Thule Group Road Show Presentation - October-November, 2016
1   Favorable Mega-Trends in the Sports&Outdoor Market

                                                                            Favorable Trends

            Increased consumer focus on                     Consumers are enjoying                  Emergence of new sports    Consumers are active longer
                    active lives                               multiple activities

          Parents want to continue to enjoy            Consumers want to be connected             Consumers are increasingly    Growing GDP and increasing
          their activities with their small kids          at all times and share their            aware of which brands and    consumer interest in sport and
                                                                   experiences                       products they seek             outdoor activities in
                                                                                                                                   developing economies

5                                     Thule Group AB (publ) – Road Show Presentation, October-November 2016
Thule Group Road Show Presentation - October-November, 2016
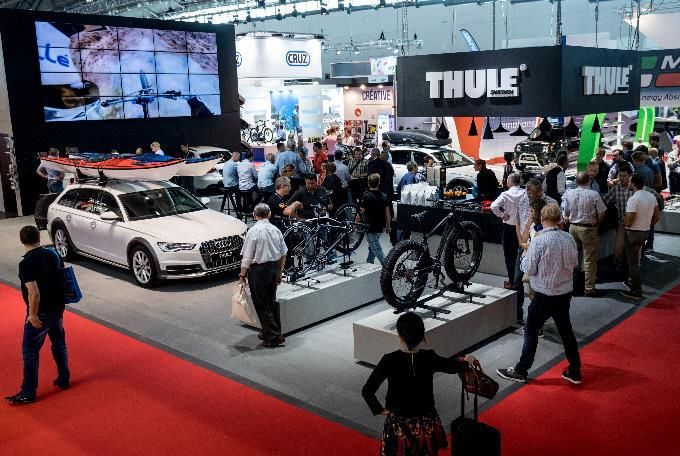
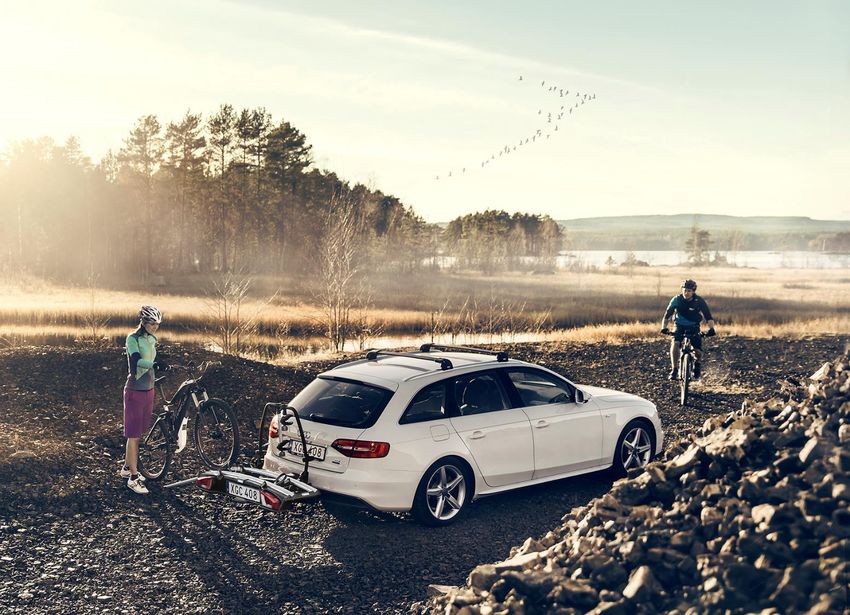
2       A Premium Brand that Captures the Emotions of the Outdoors

Slide 6              Thule Group AB (publ) – Road Show Presentation, October-November 2016
Thule Group Road Show Presentation - October-November, 2016
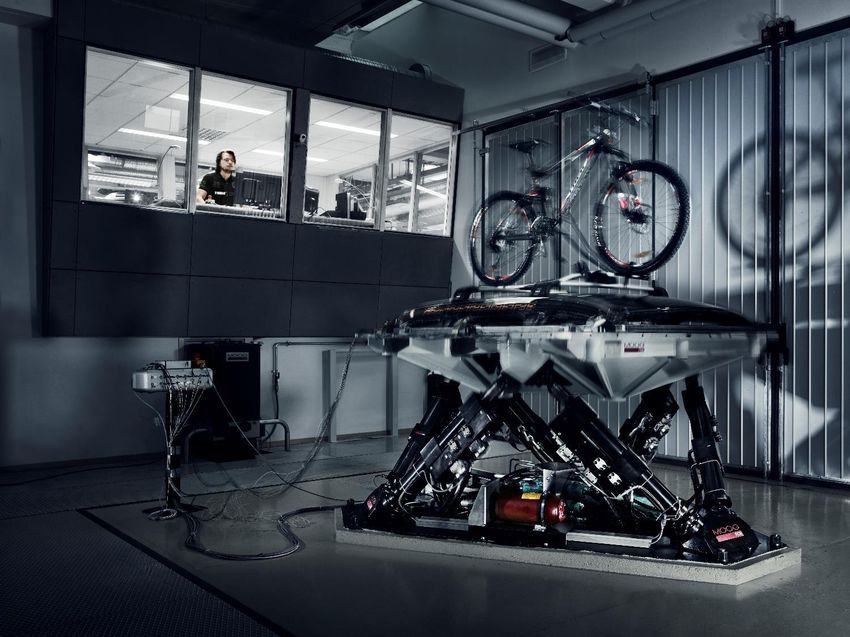
2       Market Leading Product Development with Strong User Focused DNA

                                 Top Management focus area

                                 Passionate users within the company

                                 Close co-operation with world class
      “Product is King”           athletes and consumers for input
      mind-set in entire
                                 140 FTEs dedicated to product design
        organization
                                  and development

                                 Product Development spend as share
                                  of sales has increased from 2.8% (2009)
                                  to more than 4% in 2013 – 2015

                                               2009                                        2015

                                                                   32%                            50%
              High                                                                                      Share of Net Sales
          Share of Sales                                                                                generated from
                                                                                                        products launched in
              From                                                                                      the last 3 years
          New Products

                                 Product replacement cycles have been reduced by 1/3 in the last 5 years

Slide 7                Thule Group AB (publ) – Road Show Presentation, October-November 2016
Thule Group Road Show Presentation - October-November, 2016
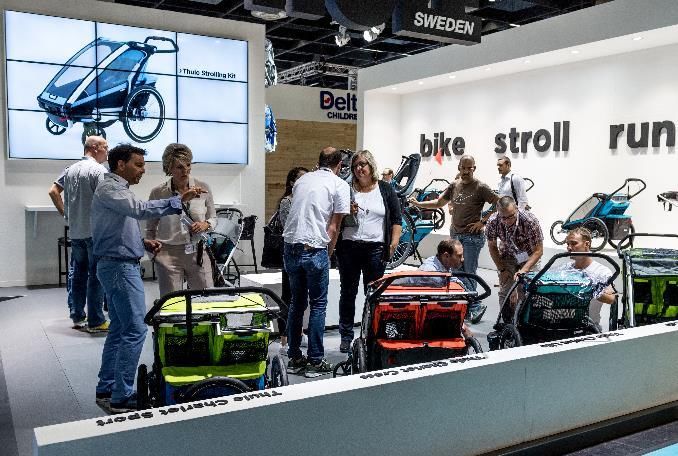
2       A Proven Distribution Strategy Implemented from 2010

      A Structured Go-To-Market Approach                                              Creating a Global Thule Retail Presence

           Category Captaincy Approach
              with Key Retail Chains

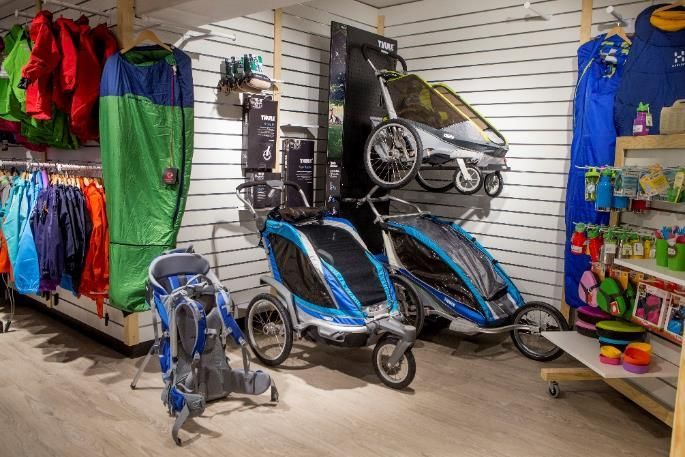
          Thule Retail Partner Program for                                     Outdoor&Bags
                  Smaller Stores                                                > 2,900 Thule Retail Partner doors
                                                                                 out of >31,000 shops selling our products

           Product Assortment Focus and
           Support for Look&Feel in Store

               Training of Store Staff

Slide 8                  Thule Group AB (publ) – Road Show Presentation, October-November 2016
Thule Group Road Show Presentation - October-November, 2016
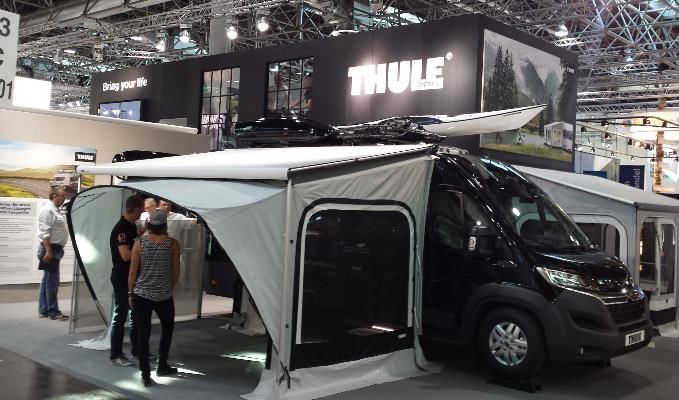
2       A Strong Position in the Value Chain

                                     Direct Material Spend by Supplier (2015)                            9 Thule Group Assembly Sites

                                                    Top 10
                                                   Suppliers                                                  Chicago
                                                     29%                                                         Seymour

                                                                                                            Perry
            Broad
                                                                                                                                       Hillerstorp
          Supply Base
                                                                                                                           Haverhill        Huta

                                                                                                                              Menen        Neumarkt
                                                                                                             Sao Paolo

                                                Sales by Customer (2015)                                    Sales in 140 Countries

                                                    Top 10
                                                   Customers
                                                      18%
            Broad
           Customer
             Base

   Source: Company information

Slide 9                          Thule Group AB (publ) – Road Show Presentation, October-November 2016
Thule Group Road Show Presentation - October-November, 2016
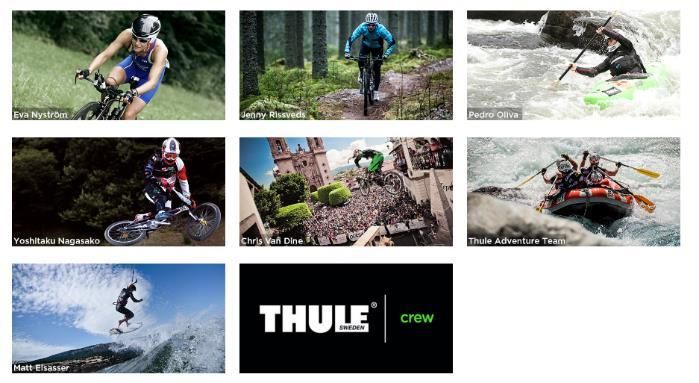
2        A Modern Approach to Consumer Communication
             Mobile device focused online platform (81 market version in 24 languages)

                           Earned Media with PR and User Content as Driver

Slide 10               Thule Group AB (publ) – Road Show Presentation, October-November 2016
Future Top-line Growth Derived from Several Sources within Outdoor&Bags
                            A      Sport&Cargo Carriers                     B       Other Outdoor&Bags   C      Bags for El. Devices

             Share of                                                                                        15.7%
           Thule Group                                                                                       (18.6%)
            Sales 2015                                    60.2%
                                                           (59.5%)              15.5%
              (2014)
                                                                                 (13.5%)

              Growth
           2015 vs. 2014
      (Constant Currency)
                                          +6.7%                                    +20.7%                       -11.2%

                                Continue to drive growth                     Continue to drive growth    Focus on more stable
             Strategic          via product innovation                       via widened offer in new    growing categories with
              Focus             and retail partner program                   product categories          less device dependancy

Slide 11                    Thule Group AB (publ) – Road Show Presentation, October-November 2016
A        Sport&Cargo Carriers – More of the same

           Continue to build the                         Omni-channel focus                       More new great
                best brand                                 & competence                         products than ever

Slide 12                Thule Group AB (publ) – Road Show Presentation, October-November 2016
B        Other Outdoor&Bags - Broad New Product Expansions

                    RV Products                                         Active with Kids                      Sport&Travel Bags

           Drive growth via product                            Drive growth via widened                   Drive growth via widened
           innovation and key                                  offer and more shelf-space                 offer and more shelf-space
           account focus                                       in new retailers                           in new retailers

           NB! Europe&ROW focus

Slide 13                          Thule Group AB (publ) – Road Show Presentation, October-November 2016
C        Bags for Electronic Devices – Focus on growing sub-categories

            Focus on
             Growth
           Categories

           Dual Brand
           Approach

                                             Use Economies of Scale in Sourcing

Slide 14                Thule Group AB (publ) – Road Show Presentation, October-November 2016
2016/Q3 Update

Slide 15
Thule Group – YTD 2016 Performance vs. Financial Targets

                                                            Constant Currency Net Sales Growth (excl. Acquisitions)

           Organic
           Growth       ≥ 5%                           5.2%                                       5.7%          -0.4%
                                                Thule Group                                Outdoor&Bags        Specialty

       Underlying
         EBIT           ≥17%                           19.9%                         September 2016 LTM at 17.2%
        Margin

           Net Debt /
            EBITDA      c. 2.5x                           1.6x                        2.3x (YE 2015)

           Dividend                                                                   Dividend of SEK 2.50 per share in 2015
            Policy      ≥ 50%                             56%                         decided by the AGM in April

Slide 16                  Thule Group AB (publ) – Road Show Presentation, October-November 2016
YTD September 2016 – Strong organic growth drives EBIT growth

                                                 Reported Net Sales                                           Underlying EBIT and Margin

                               SEKm          4 341                             4 541                   SEKm     18.5%                      19.8%

                                                                                                                 802                       901

       Thule Group

                                            YTD 2015                         YTD 2016                          YTD 2015                  YTD 2016
                                                            Thule Group                                                   Thule Group

                               SEKm          3 998                             4 201                   SEKm     21.0%                      22.0%

                                                                                                                 841                       924
           Outdoor
              &
            Bags
                                            YTD 2015                         YTD 2016                          YTD 2015                  YTD 2016
                                                           Outdoor&Bags                                                   Outdoor&Bags

                               SEKm                                                                    SEKm     12.3%                      16.9%
                                               342                               340
                                                                                                                                           57
                                                                                                                 42
           Specialty                                    O&B Americas

                                            YTD 2015                          YTD 2016                         YTD 2015                  YTD 2016
                                                              Specialty
                                                                                                                            Specialty

     Note: EBIT adjusted for non-recurring items & depr/amort on excess values
     1 Constant currency adjustment based on average FX rates 1 January-30 September 2016

Slide 17                            Thule Group AB (publ) – Road Show Presentation, October-November 2016
Operating Working Capital and Operational Cash Flow

                       Operating Working Capital                                                                       Comments
    SEKm
                                                                                                  Operating working capital as of 30 September 2016:
                   19,5%                    20,5%
                                                                18,1%            20%
                                                                                                      Inventory: SEK 678m (694)
     1500                                                                                             Accounts receivables: SEK 728m (745)
                                            1073                 1001                                 Accounts payable: SEK 406m (366)
     1000           869
                                                                                 10%              Despite strong sales growth we have lowered
      500                                                                                          inventory and accounts receivables, in absolute
                                                                                                   numbers, vs PY
           0                                                                     0%
                    Q3 14                   Q3 15                Q3 16                            Currency effect SEK 17m vs prior year

                              OWC            OWC % of Net Sales

                           Operational Cash Flow                                                                       Comments
    SEKm
                                                                                                  Q3 Operational cash flow SEK 492m (425),
      450
                                                                                                   an improvement by SEK 67m
                                                       492
                                                 425                                              YTD Operational cash flow SEK 857m (560),
                                      385
      250
                                                                                                   an improvement by SEK 297m
                               263
                                                                 183
                                                                                                  Positive effect this year due to
           50                                                                                         Higher EBITDA
                -128 -20                                                                              Improved OWC (lower inventory and accounts
     -150                                                                                              receivables)
                  Q1                Q2              Q3              Q4

                       2015    2016

Slide 18                              Thule Group AB (publ) – Road Show Presentation, October-November 2016
Key Events – Successful fair season for products to hit market in 2017
     Broadest and deepest launch program ever to trade
     Successful fairs in Q3 with strong launches
            Q3 is always the most busy fair season when we introduce
             new products to the Trade for the coming season
     Major Global/Regional fairs with key launches
              Outdoor Retailer (Outdoor trade, US)
              Eurobike (Bike trade, Global)
              Automechanika (Car Accessory trade, Global)
              Caravan Salon (RV Products trade and consumer, Global)
              IFA (Consumer Electronics, Global)
              Kind&Jugend (Juvenile trade, Global)

                                                                                         Caravan Salon (Düsseldorf, Germany)

     Kind&Jugend (Köln, Germany)                                                         Automechanika (Frankfurt, Germany)

Slide 19                         Thule Group AB (publ) – Road Show Presentation, October-November 2016
Continued focus on Profitable Growth and preparing for Spring 2017 season

   Continue to Drive Profitable Organic Growth
       Continue to drive European momentum in Sport&Cargo Carriers
        and manage US retail struggles by offering great service
       Drive growth in Active with Kids and Sport&Travel Bags via new
        products and retail expansion
            Successful fast integration of GMG Bike Child Seat business
       RV Products - Continued market share gains in strong motorhome
        market via product innovation
       Bags – Continue to push in the growth segment of “everyday bags”
        (backpacks and laptop bags) at higher price points

   Capture gains from Operational Efficiency and execute on
    Distribution strategy
       Secure continued cost efficient handling with high
        On-Time-In-Full performance across all sites
       Finalize Phase 2 in North America distribution center efficiency
        projects
       Prepare for season ramp-up and growth expectations with
        pre-build of some key products to enable easier distribution
        center moves
       Start building work on new assembly plant in Poland

   Create market buzz for retailers and consumers for our 2017
    launch program in traditional as well as new product categories
   Continue to drive profitability in Specialty, while concluding
    Strategic Review
       Focus on production efficiencies
       Finalize strategic review of category and communicate direction

                       Image of the new Thule Chariot Cross multi-sport trailer with jogging kit

Slide 20                           Thule Group AB (publ) – Road Show Presentation, October-November 2016
Q&A
Disclaimer

     This presentation has been prepared by Thule Group AB (publ) (the “Company”) solely for use at this presentation and is furnished to you solely for
      your information and may not be reproduced or redistributed, in whole or in part, to any other person. The presentation does not constitute an
      invitation or offer to acquire, purchase or subscribe for securities. By attending the meeting where this presentation is made, or by reading the
      presentation slides, you agree to be bound by the following limitations.
     Statements in this presentation, which are not historical facts, such as expectations, anticipations, beliefs and estimates, are forward-looking
      statements within the meaning of the United States Private Securities Litigation Reform Act of 1995. Such statements involve risks and uncertainties
      which may cause actual results to materially differ from those expressed in such forward-looking statements.
     This presentation may contain various forward-looking statements that reflect management’s current views with respect to future events and
      financial and operational performance. The words “believe,” “expect,” “anticipate,” “intend,” “may,” “plan,” “estimate,” “should,” “could,” “aim,”
      “target,” “might,” or, in each case, their negative, or similar expressions identify certain of these forward-looking statements. Others can be identified
      from the context in which the statements are made. These forward-looking statements involve known and unknown risks, uncertainties and other
      factors, which are in some cases beyond the Company’s control and may cause actual results or performance to differ materially from those
      expressed or implied from such forward-looking statements. These risks include but are not limited to the Company’s ability to operate profitably,
      maintain its competitive position, to promote and improve its reputation and the awareness of the brands in its portfolio, to successfully operate its
      growth strategy and the impact of changes in pricing policies, political and regulatory developments in the markets in which the Company operates,
      and other risks.
     The information and opinions contained in this document are provided as at the date of this presentation and are subject to change without notice.
     No representation or warranty (expressed or implied) is made as to, and no reliance should be placed on, the fairness, accuracy or completeness of
      the information contained herein. Accordingly, none of the Company, or any of its principal shareholders or subsidiary undertakings or any of such
      person’s officers or employees accepts any liability whatsoever arising directly or indirectly from the use of this document.

                                                     www.thulegroup.com

Slide 22                         Thule Group AB (publ) – Road Show Presentation, October-November 2016
You can also read