Christmas Unwrapped 2017 - Webinar Key learnings from consumer online behaviour during - Hitwise
←
→
Page content transcription
If your browser does not render page correctly, please read the page content below
Christmas
Unwrapped 2017
Webinar
Key learnings from consumer online behaviour during
the holidays and key sale periods

About Us
        Hitwise is the online measurement and audience targeting service that enables
             businesses to reach, acquire and retain profitable customer segments.

     SAMPLE SIZE                       DATA DEPTH                   DATA FREQUENCY
 1M+ AU Online Panelists               3.7 M Websites              Bespoke Hourly Insights
 170+ Industry Categories               45 M Searches                   Through To
Across Mobile and Desktop          20K Respondent surveys              Yearly Trends

                                                                               Christmas Unwrapped Webinar
About the Speakers

ANDREW BARTON
 Research Analyst

                    Christmas Unwrapped Webinar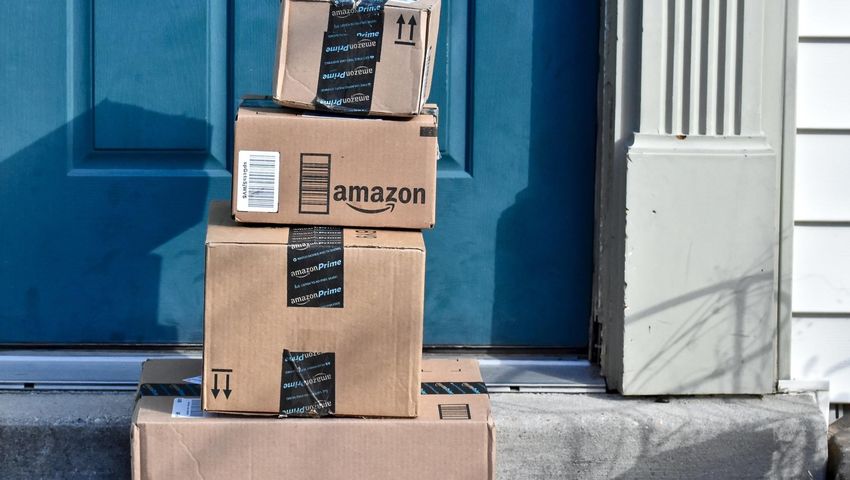
Agenda

1. What happened in online retail overall?
 •    Weekly retail foot traffic year on year (Shoppertrak)
 •    Shopping & Classifieds industry visits, overall and by sub-industry
 •    Daily total Shopping & Classifieds visits across the key sales events of 2017
 •    Key sale day visitation compared 2017 vs 2016

2. How did brands perform in key sales?
 •    Black Friday & Cyber Monday hourly visitation for key online retailers
 •    Top retailer visit growth Nov-17 to Dec-17 in key sub-industries
 •    Amazon AU launch – products viewed, purchase rate & retailer comparison
 •    Boxing Day – retailers leveraging traffic and key search concepts

3. Summary
  •   An optimised e-commerce experience on your site is more key than ever

                                                                       Christmas Unwrapped Webinar
1.
What happened in
online retail overall?
Whilst Boxing Day remains the
largest sale day, Click Frenzy &
Black Friday are far outpacing its
growth in visitation

Cumulative retail foot traffic was down from 2016 to 2017

 In-Store Traffic – Shoppertrak Index

 The Shoppertrak Index gauges foot traffic across
 Australian retail stores, and cumulatively across the year
 there was a 3.8% decline for 2017 as compared to 2016.

 Whilst retail footfall was up in December 2017 compared
 to 2016, it didn’t reach anywhere near the level seen in
 2015.

 Source: Weekly in-store foot traffic provided by Shoppertrak, www.shoppertrak.com

                                                                                     Christmas Unwrapped Webinar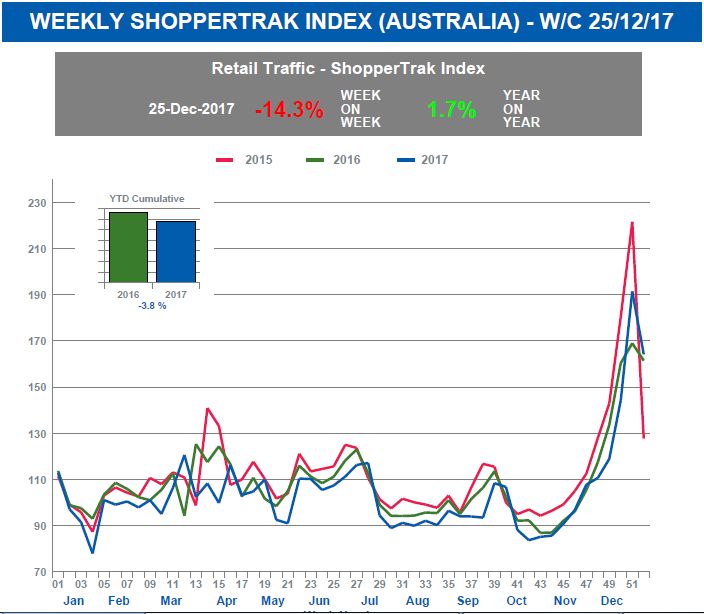
Each holiday period has seen YoY online retail visits growth
                    Online Retail Visits: 2017, 2016 and 2015 by Month                                                 Shopping & Classifieds Visits Growth YoY - Q4
                                                                                                               1,100,000,000
                                                                                                   Q4                                                                           9.25%
1,100,000,000                                                                                                                                                              4.15%
                                                                                                               1,000,000,000                           11.15%
1,000,000,000                                                                                                                      8.79%
                                                                                                                900,000,000                        9.74%
                                                                                                                               8.17%
 900,000,000
                                                                                                                800,000,000
 800,000,000

                                                                                                                700,000,000
 700,000,000

 600,000,000                                                                                                    600,000,000
                  Jan     Feb      Mar      Apr    May      Jun       Jul   Aug   Sep    Oct       Nov   Dec                           Oct                   Nov                   Dec

                      Total Visits - 2015          Total Visits - 2016       Total Visits - 2017                          Total Visits - 2015   Total Visits - 2016   Total Visits - 2017

 Visitation in Q4 2017 was up 10% from 2016

 November in particular saw strong growth from 2016 to 2017, with over 11% more                                The visitation ramp up through Q4 towards Christmas is
 total visits – this was partially driven by Amazon visitation surge in the midst of                           lengthening – rather than a significant surge going into
 significant launch speculation towards the end of November.                                                   December only (as seen in 2015), 2017 saw a more steady (but
                                                                                                               still significant) growth across October, November and
                                                                                                               December

 Source: Hitwise, Monthly Visits to Shopping & Classifieds industry

                                                                                                                                                     Christmas Unwrapped Webinar
Department stores & electronics saw significant growth
Monthly Total Visits - Shopping & Classifieds Sub-Industries - Dec-16 vs Dec-17
Average % change YoY 160,000,000 29% 30%
across all sub-industries 140,000,000
21% 21% 20% 21% 20%
was 10% uplift 120,000,000 15% 16%
18%
15%
17%
14%
9% 9% 10%
With the launch of Amazon AU, the 9%
% Change YoY
100,000,000
6% 5% 6%
Total Visits
Department Stores sub-industry saw
more total visits than Auctions in 2017. 80,000,000 0% 0%
-4%
House & Garden also performed 60,000,000
exceptionally well, overtaking the -9% -10% -10%
-13%
Rewards & Directories sub-industry. 40,000,000
-20%
Whilst not double digit growth, the 6% 20,000,000
rise in Apparel total visits is significant 0 -30%
given the sub-industry’s size.
Total Visits - Dec-16 Total Visits - Dec-17 % Change
Source: Hitwise, December visits to Shopping & Classifieds sub-industries 2017 vs 2017
Christmas Unwrapped WebinarClick Frenzy outperformed Black Friday & Cyber Monday
Boxing Day remains the
most well-known sale day, Shopping & Classifieds - Daily Total Visits
seeing over 54 million visits 60,000,000
Click Frenzy Boxing Day
Australians are definitely sitting up and taking 1st day: 41.1M Visits 54.1M Visits
50,000,000 2nd day: 37.2M Visits
notice of Click Frenzy, which saw the second
highest visits surge in Q4 behind the Boxing
Day surge. 40,000,000
Beyond this, Black Friday was the only other
period in Q4 to see total visitation peak 30,000,000
above 40 million – this sale day is fast gaining
traction in Australia.
20,000,000 Black Friday
40.6M Visits
Cyber Monday was much less prominent,
being the slowest of the key sale periods to Cyber Monday
10,000,000 39.2M Visits
catch on with Australian consumers.
0
02/11/2017 09/11/2017 16/11/2017 23/11/2017 30/11/2017 07/12/2017 14/12/2017 21/12/2017 28/12/2017
Source: Hitwise, daily total visits to Shopping & Classifieds industry, November & December 2017
Christmas Unwrapped WebinarClick Frenzy & Black Friday are growing substantially
Shopping & Classifieds Total Visits - Key Sale Days
2016 vs 2017
Boxing Day saw only single 60,000,000 25%
digit growth
50,000,000 21% 20%
Whilst Boxing Day remains the largest sale day 20%
overall, Click Frenzy & Black Friday seem to be
growing twice as quickly year on year, with over 40,000,000
% Change YoY
20% growth. 15%
Total Visits
Cyber Monday was much less prominent 30,000,000
amongst Australian consumers, seeing much
smaller growth and lower total visits (despite the 10% 10%
fact that Mondays naturally see higher visitation 9%
20,000,000
than other days in the week).
5%
10,000,000
0 0%
Click Frenzy Black Friday Cyber Monday Boxing Day
Total Visits - 2016 Total Visits - 2017 % Change YoY
Source: Hitwise, daily total visits to Shopping & Classifieds industry, key sale dates 2017
Christmas Unwrapped Webinar2. How did brands perform in key sales? Hourly visitation, top product searches, December visits growth - Black Friday, Amazon AU, Boxing Day
Black Friday was a morning AND evening affair

Kogan enjoyed a distinct
visits surge around lunch                                                                                                          Black Friday Hourly Visitation
                                                                                                                   (from users who searched for Black Friday terms) Top Retailers
time                                                                                                       7,000                                                                               50,000
                                                                                                                                                                                               45,000

                                                                     Total Visits – Individual Retailers
                                                                                                           6,000
JB Hi Fi peaked very early in the day at                                                                                                                                                       40,000
10AM, surpassing even the likes of eBay &                                                                  5,000

                                                                                                                                                                                                        Total Visits - Top 15
                                                                                                                                                                                               35,000
Amazon for total visits in that hour.
                                                                                                                                                                                               30,000
                                                                                                           4,000
Contrasting this, eBay instead peaked later                                                                                                                                                    25,000
that night at 9PM, seeing the highest hourly                                                               3,000
visitation of the day.                                                                                                                                                                         20,000

                                                                                                           2,000                                                                               15,000
Looking at the overall total visits to the top
15 Black Friday retailers, there seem to be                                                                                                                                                    10,000
                                                                                                           1,000
three distinct peaks across the day: Early-                                                                                                                                                    5,000
mid morning, late afternoon (just after work)
                                                                                                              0                                                                                0
and then later evening (after dinner).

                                                                                                              Top 15   www.ebay.com.au    www.amazon.com      www.jbhifi.com.au     www.kogan.com.au

 Source: Hitwise, hourly total visits to selected retailer websites, 24 November 2017

                                                                                                                                                                        Christmas Unwrapped Webinar
Cyber Monday was much more volatile than Black Friday
Cyber Monday Hourly Visitation (from users who searched for Cyber
Mid morning was again key,
Monday terms) - Top Retailers
but delayed compared to 2,000 9,000
Black Friday 1,800 8,000
Total Visits – Individual Retailers
1,600
7,000
eBay capitalised on both the morning AND 1,400
Total Visits – Top 15
evening surges this time, and overall enjoyed 6,000
the most visits across the day. 1,200
5,000
Where Kogan punched above its weight on 1,000
4,000
Black Friday, Catch of the Day did so on Cyber 800
Monday, even outperforming eBay, Amazon 3,000
and JB Hi Fi at the 10PM hour mark. 600
2,000
On the whole though, Australian’s interest in 400
Cyber Monday was much less significant than 200 1,000
Black Friday and much more fickle, resulting in
more volatile and inconsistent visitation across 0 0
the day.
Top 15 www.ebay.com.au www.amazon.com www.jbhifi.com.au catchoftheday.com.au
Source: Hitwise, hourly total visits to selected retailer websites, 24 November 2017
Christmas Unwrapped WebinarTech deals were the key focus, and more so on Amazon than eBay
Top Products Searched In Amazon – Black Friday Top Products Searched In eBay – Black Friday
Search Term Search Share Search Term Search Share
tv 0.682% xbox one 0.161%
Gaming consoles were headphones 0.385% bbq 0.158%
dominant for product ps4 0.349% laptop 0.127%
coffee machine 0.268% lego 0.108%
searches on Black Friday
ipad 0.253% ps4 controller 0.096%
playstation 4 0.243% ozito 0.093%
The top searched product list on Amazon was
almost entirely tech dominated, with the only lego 0.241% mobile phones 0.091%
exceptions being ‘coffee machine’, ‘lego’ and tablet 0.240% google home 0.087%
‘mighty mug mini’. iphone 0.213% ps4 0.080%
Whilst still heavily tech focused, eBay product gtx 1080 ti 0.212% xbox one s 0.077%
searches saw more variety with household goods mighty mug mini 0.206% pool filter 0.072%
like ‘pool filter’ and ‘dyson’ appearing, or even
bluetooth speakers 0.201% dash cam 0.063%
the likes of Auto related products with ‘dash
cam’ and ‘trailer’. 8tb 0.194% gtx 1060 0.060%
samsung gear s3 0.188% dash camera 0.060%
eBay seems to remain the go-to marketplace for
more varied lifestyle goods, whilst Amazon has gtx 1060 0.185% ipad 2017 0.060%
become tech Mecca. raspberry pi 3 0.183% note 8 case 0.058%
earphones 0.183% trailer 0.057%
switch 0.177% sound bar 0.057%
gtx 1060 3gb 0.173% dyson 0.057%
mobile phone 0.170% ue boom 0.057%
Source: Hitwise, search terms used within key marketplaces, 24 November 2017
Christmas Unwrapped WebinarTop Visits Growth Nov to Dec 2017 – Electronics
Website Nov-17 Visits Dec-17 Visits % Growth
312,815 551,720 76%
791,770 1,352,458 71%
16,444,944 23,442,193 43%
415,917 592,642 42%
6,763,662 9,570,411 41%
9,326,644 12,829,168 38%
620,841 832,315 34%
1,599,399 2,124,133 33%
1,505,302 1,996,666 33%
427,416 543,504 27%
Source: Hitwise, monthly visits to selected Appliances/Electronics websites, November & December 2017Top Visits Growth Nov to Dec 2017 – Apparel/Accessories
Website Nov-17 Visits Dec-17 Visits % Growth
47,877 145,429 204%
73,745 187,345 154%
74,704 143,484 92%
613,080 1,075,911 75%
154,676 261,883 69%
2,898,461 4,681,349 62%
151,091 240,859 59%
586,819 926,082 58%
766,078 1,198,168 56%
66,735 102,373 53%
Source: Hitwise, monthly visits to selected Apparel/Accessories websites, November & December 2017Top Visits Growth Nov to Dec 2017 – Department Stores
Website Nov-17 Visits Dec-17 Visits % Growth
7,184,811 15,333,435 113%
2,325,739 4,204,247 81%
3,793,849 5,968,499 57%
5,674,991 8,099,646 43%
395,490 524,993 33%
893,495 1,181,342 32%
955,439 1,212,730 27%
11,550,242 14,650,197 27%
10,871,184 13,415,173 23%
16,268,949 19,311,887 19%
Source: Hitwise, monthly visits to selected Department Stores websites, November & December 2017Amazon AU Snapshot – What happened during launch week?
Top Products Viewed In Amazon AU – Launch Week Australian Audience - Amazon AU vs Amazon US -
Daily Purchase Rate
Total Page Views Product Price (at 13/12/2017)
66,085 Amazon Fire TV Stick (Basic) $69.00 7% Launch Day
34,519 Sennheiser Bluetooth Headphones $198.97
6%
31,537 Nintendo Switch - Neon Blue $399.00
25,278 Kindle Paperwhite (Black) $154.00 5%
Purchase Rate
22,222 PlayStation 4 500GB - White $399.00
4%
22,012 Nintendo Switch - Gray $399.00
18,513 Playstation 4 Pro 1TB - Black $469.00 3%
18,480 Xbox One S 1TB Minecraft Limited Edition $318.00
2%
16,490 Kindle E-Reader (Black) $109.00
13,348 Bluetooth Wireless Sports Earphones $21.99 1%
13,320 Huggies Ultimate Nappies - Unisex, Newborn $65.00
0%
13,064 FI FA 18 (PS4) $49.00
7/12/2017 8/12/2017 9/12/2017 10/12/2017 11/12/2017
12,567 Star Wars Battlefront I I (PS4) $49.00
Amazon US Amazon AU
10,628 Huggies Ultra Dry Nappies - Boys, Size 2 $65.00
10,502 Call of Duty: WW2 (PS4) $49.00
Source: Hitwise, product pages viewed on Amazon AU & overall purchase rate, 7 days ending 12 December 2017
Christmas Unwrapped WebinarAmazon AU Snapshot – What happened during launch week?
Amazon AU vs Other Retail Sites - Total Visits, Visit Time & Page Views Per Visit
Page Views Per Visit
14
High Pages per Visit High Pages per Visit Amazon AU
Low Visit Time High Visit Time
12
Bubble Size = Total Visits
David Jones 10 Myer
Axes intercept represents average values
Catch.com.au
8 Target
Amazon US
0:02:00 0:03:00 0:04:00 0:05:00 0:06:00 0:07:00
Visit Time
Big W 6 Kmart
Westfield 4
Low Pages per Visit Low Pages per Visit
Target
Low Visit Time High Visit Time
2
Source: Hitwise, visitation engagement metrics to selected retail websites, 1 week ending 9 December 2017
Christmas Unwrapped WebinarBoxing Day news & deal aggregators saw high search traffic
Finder captured more than Top Websites Receiving Traffic From Boxing Day Search Terms
10% of the overall Boxing
Finder.com.au
Day related search traffic 0.89% 9.38%
news.com.au 0.06% 6.95%
Amazon AU performed strongly ahead of
Myer & Kogan, however this was thanks to an JB Hi-Fi Australia 1.84% 4.03%
aggressive paid search spend.
OzSale was the other of these top sites to see Amazon.com.au 2.77% 0.98%
a high paid search rate, with nearly 80% of
their traffic being paid clicks. Myer 1.04% 2.70%
There appear to be two distinct strategies
here: capture the search traffic directly via Kogan 1.67% 1.80%
extensive paid search efforts, or work with
aggregators/news sites like Finder & The Good Guys 0.59% 2.69%
News.com.au to feature deals prominently in
the eyes of those visiting those sites via OZsale.com.au 2.48% 0.65%
organic search looking for information on the
best deals.
Harvey Norman - Australia 0.30% 1.64%
EB Games Australia 1.76%
Paid Clicks Share Organic Clicks Share
Source: Hitwise, Boxing Day search traffic to selected websites, 1 week ending 30 December 2017
Christmas Unwrapped WebinarBoxing Day Searches
Excluding 'Sale' - Top Boxing Day Search Related Keywords Top Boxing Day Search Related Keywords - Non-
Retailer Branded
2.5% 35%
35% 30%
Search Clicks Share
2.0%
30% 30%
Search Clicks Share
Average Paid Rate
25% 25% 30% 25% 25%
22%
24%
25%
23%
1.5% 20% 20% 20%
18% 19% 18% 18% 20%
1.0%
16% 15% 16% 15%
15%
11%
9% 10% 11% 10%
8% 10%
0.5% 7% 7% 6% 6%
5% 5%
5% 5%
0.0% 0% 0% 0% 0%
sale sales online sydney best
Search Clicks Share Average Paid Rate
Search Clicks Share Average Paid Rate
‘Sale’/’sales’ were of course the most prominent keywords, with average Both ‘deals’ and ‘specials’ as keywords saw paid rates in line with that
paid rates over 20% and high search share of ‘sales’, suggesting search targeting is already well across all
variations of the ‘sale’
The strong performance of ‘online’ as a keyword highlights the continued
transition of Australian consumers to online retail The spread of city names likely reflects the portion of the audience
researching ahead of a day of actual in-store shopping
Interestingly, given how prevalent the term ‘best’ was, it had a somewhat
low average paid rate – this term is potentially under-targeted For the few actual product keywords appearing in the top 20, there
was a distinct skew in paid rates, with ‘tv’ and ‘apple’ attracting much
higher paid rates than ‘Nintendo’ and ‘switch’
Source: Hitwise, Boxing Day search traffic to selected websites, 1 week ending 30 December 2017
Christmas Unwrapped Webinar3. Key presentation points Online retail visitation grew 10% for Q4 2017 - an optimised e-commerce experience on your site is more key than ever
Summary

           What happened in online retail overall?                                  How did brands perform in key sales?

•   2017 retail footfall was down, but online retail visitation          •   Mid-morning, late afternoon, and late evening were the key
    continues to grow (10% for Q4 2017 year on year) - ensuring an           visit surges during Black Friday, though Kogan managed to
    optimised e-commerce experience on your site is more key                 capitalise on a significant lunchtime visits spike
    than ever

                                                                         •   Black Friday is dominated by tech product searches (especially
•   Key visit growth areas year on year included Department Stores           on Amazon), but household goods were also top of mind in
    (21% - propelled by the Amazon AU launch), Electronics (20%),            eBay searches
    House/Garden (21%) and Apparel (6%)

                                                                         •   Amazon AU's launch week saw mostly tech and gaming
•   Whilst Boxing Day remains the largest sale day, Click Frenzy &           products leading the way, and whilst generally considered a
    Black Friday are far outgrowing it in visitation (>20% growth YoY)       lacklustre launch, the site saw strong page views per visit and
    - implementing offerings on these days will become more and              average visit time figures
    more lucrative over the next years

                                                                         •   Finder & News.com.au captured a significant portion of Boxing
                                                                             Day sale search traffic - leveraging this indirect Boxing Day
                                                                             traffic (via display ads on these sites, for instance) could lend a
                                                                             valuable edge during the most important sale period

                                                                                                                         Christmas Unwrapped Webinar
Thank you! contact-au@hitwise.com www.hitwise.com
You can also read