Year-End 2019 Results Conference Call - TSX | CAR.UN February 27, 2020
←
→
Page content transcription
If your browser does not render page correctly, please read the page content below

Year-End 2019
Results Conference Call
TSX | CAR.UN
February 27, 2020
Disclaimer
Today’s session and our answers to questions contain statements that constitute forward-looking statements about
expected future events and financial and operating results of CAPREIT. These statements represent CAPREIT’s
intentions, plans, expectations and beliefs as of the date hereof and are subject to certain risks and
uncertainties. These statements are based on certain factors and assumptions regarding expected growth, results of
operations, performance and business prospects and opportunities. Although such forward-looking statements are
based upon assumptions that management believes are reasonable, there can be no assurance that actual results will
be consistent with these forward-looking statements and actual results in future periods may differ materially from
those expressed or implied by such forward-looking statements. These risks and uncertainties are more fully described
in CAPREIT’s regulatory filings, including our Annual Information Form and Managements’ Discussion and Analysis of the
Results of Operations and Financial Condition, all of which can be obtained on SEDAR at www.sedar.com. Investors
should not place undue reliance on any such forward-looking statements. Subject to applicable law, CAPREIT does not
undertake any obligation to update or revise any forward-looking information.

Non-IFRS Financial Measures
CAPREIT prepares and releases unaudited consolidated interim financial statements and audited consolidated annual
financial statements in accordance with International Financial Reporting Standards (“IFRS”). In the MD&A, earnings
releases and investor conference calls, CAPREIT discloses financial measures not recognized under IFRS which do not
have standard meanings prescribed by IFRS. These include stabilized net rental income (“Stabilized NOI”), Funds From
Operations (“FFO”), Normalized Funds From Operations (“NFFO”), Adjusted Cash Flow from Operations (“ACFO”), FFO and
NFFO per Unit amounts and FFO, NFFO and ACFO payout ratios, and Adjusted Cash Generated from Operating Activities
(collectively, the “Non-IFRS Measures”). Since these measures are not recognized under IFRS, they may not be
comparable to similar measures reported by other issuers. CAPREIT presents the Non-IFRS measures because
Management believes Non-IFRS measures are relevant measures of the ability of CAPREIT to earn revenue and to
evaluate its performance and cash flows. A reconciliation of these Non-IFRS measures to the comparable IFRS measures,
along with further definitions and discussion, is provided in Section IV under Non-IFRS Financial Measures. The Non-IFRS
measures should not be construed as alternatives to net income or cash flows from operating activities determined in
accordance with IFRS as indicators of CAPREIT’s performance or sustainability of our distributions.

                                                                                                                      2
A Year of Significant Accomplishments
Mark Kenney
President & Chief Executive Officer
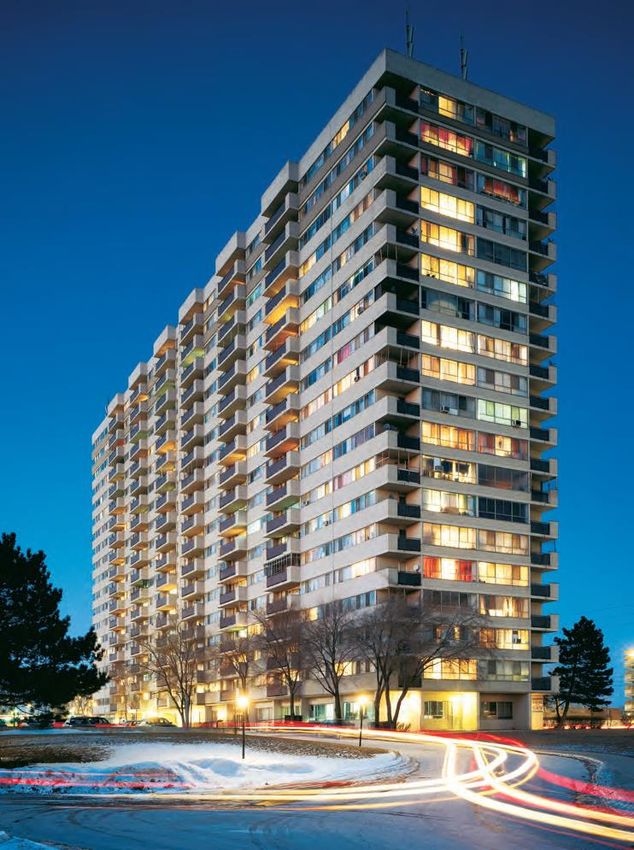
Fraser Flats
Nursery
Vancouver,Heights
BC
3
View Royal, BC
Record Results Across All Platforms

       Growth                                        Accomplishments

        39% market cap growth
                                                     ✓ Total of $1.12 billion gross equity raised in 2019
        18% portfolio growth
                                                     ✓ Executed 13 transactions in 2019 acquiring 6,957 suites for $639M in Canada
        15% NOI growth
                                                     ✓ Largest year of acquisition volume since 2004
        17% NFFO growth

        169% portfolio growth                        ✓ Total of $311 million (€213 million) gross equity raised
        114% NOI growth                              ✓ Vended-in the last Dutch properties from CAPREIT to ERES
        100% FFO growth                              ✓ Executed 7 transactions acquiring 3,541 suites for €752 million

        42% market cap growth
        37% portfolio growth                         ✓ Total of €134 million ($198 million) gross equity raised
        23% NOI growth                               ✓ Executed 5 transactions in 2019 acquiring 987 suites for €337M
        19% NFFO growth                              ✓ Increased credit facility from €350M to €600M
        NFFO equivalent in Europe is EPRA Earnings

                                                                                                                                     4
Strong Returns in The Netherlands

EUROPEAN RESIDENTIAL REIT (TSX: ERE.UN)                   2019 Highlights

Market Capitalization: $1.07 billion                      • Acquired 3,541 suites in 2019, of which 2,710 suites
                                                            were from CAPREIT resulting in a growth of 169% since
✓ Continued CAPREIT investment as part of its
                                                            inception
  diversification strategy
                                                          • September and December 2019 equity offerings raised gross
✓ As at December 2019, owns 5,632 rental units
                                                            proceeds of $311 million to finance acquisitions and repay
  throughout the Netherlands
                                                            debt
✓ CAPREIT provides property and asset management
                                                          • Repayment of credit facility resulting in $109 million available
  services for recurring fees
                                                            liquidity, including the bridge facility
     o   Fee revenues of $6.1 million in
         2019 (eliminated upon consolidation)

✓ 66.0% CAPREIT majority ownership position

✓ $46.0 million in NOI from ERES with an additional
  $10.2 million in NOI prior to assets vended into ERES

                                                                                                                               5
Strong Returns in Ireland

IRISH RESIDENTIAL PROPERTIES REIT plc (Euronext Dublin: IRES)   2019 Highlights

Market Capitalization: €829.5 million                           • Portfolio growth of circa 37% since Dec 2018 to
                                                                  3,666 units
✓ Continued CAPREIT investment as part of its
  diversification strategy                                      • Successfully raised gross proceeds of approximately
                                                                  €134 million in June and July 2019
✓ As at December 2019, owns 3,666 properties across
  Ireland                                                       • Largest acquisition in Ireland of 815-unit portfolio
                                                                  completed Q3 2019
✓ CAPREIT provides property & asset management
  services for recurring fees                                   • Currently 219 units contracted under pre-purchase
                                                                  contracts; in addition, development opportunity with
     o Fee revenues of $8.0 million in 2019, up 10.3%
                                                                  planning permission received for 627 units
       from last year
✓ 18.3% CAPREIT retained interest, receiving
  $7.2 million in dividends throughout 2019

                                                                                                                         6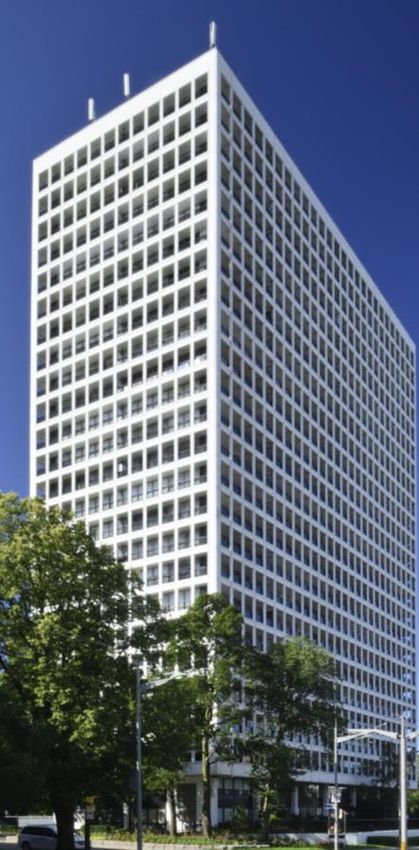
Strong & Accretive Growth

      2019 Acquisitions                Suites    Cost
      Netherlands Residential Suites     2,284   $745.8 M

      Canada Residential Suites          1,774   $356.0 M

      Canada MHC Sites                   5,183   $283.1 M

      Total Suites & Sites              9,241    $1.38 B

The Carrington
Calgary, AB                                                 7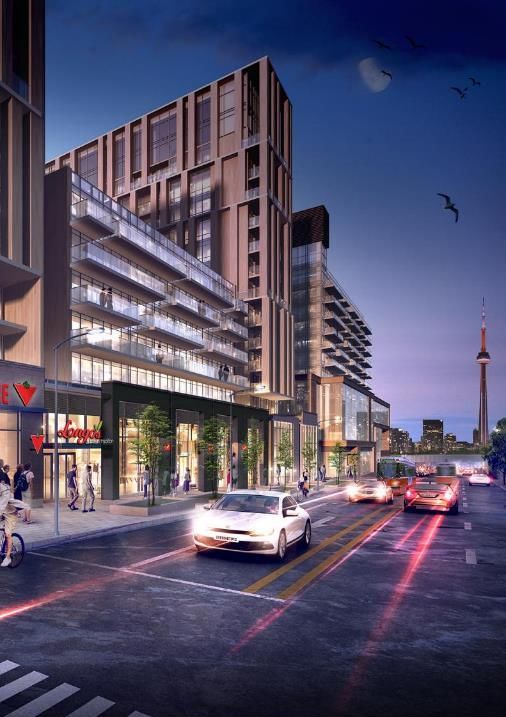
Canada’s Second Largest MHC Owner
MHC presence across 72 communities Canada-wide

                                                                                                               Newfoundland
                                                                                                               and Labrador

         British
        Columbia
                     Alberta                   Manitoba
                                                                                    Quebec               PEI                  772
                                                                                                                              Sites
                                Saskatchewan

                                                                  Ontario

488                                                                                                            Nova                     MHC: communities present
                                                                                                New            Scotia
Sites                                                                                        Brunswick

                                                                                                                                      Manufactured Housing Community
             2,079                                    3,962                                                              127
             Sites                                        Sites                                                          Sites          72    Communities

                        376                                                                                                           11,680 Sites / Pads
                        Sites                                               429                          3,447
                                                                            Sites                         Sites

                                                                                                                                                                       8
Modernizing Our Asset Base
Rental properties built in the last 10 years

     6                                                                                                  Newfoundland
                                                                                                        and Labrador

    British
   Columbia                                                                  1
                    Alberta                  Manitoba
                                                                           Quebec                 PEI                  451
                                                          2                                 11                         Suites
                              Saskatchewan                                                        1
                                                        Ontario
                                                                                                        Nova                             Rental: no. of properties
              778                                                                   New                 Scotia
              Suites                                                                Brunswick

                                                                                                                                Rental properties under 10 years old
                                              593
                                              Suites                                       71                                     21      Properties
                                                                                         Suites
                                                                                                                                 2,014    Total units
                                                                  121
                                                                  Suites

                                                                                                                                                                     9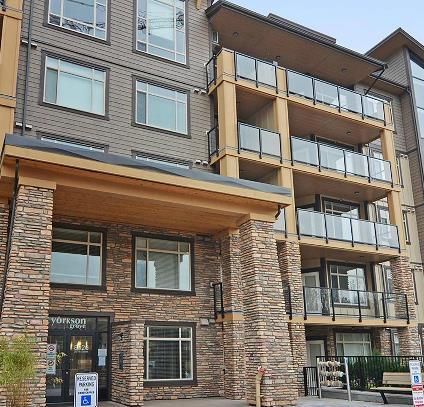
Strong Operating Performance
                                                              Year Ended     December 31, 2019

                                  Stabilized Occupancy: Residential Suites            99.2%
                                              Stabilized Occupancy: MHCs              97.3%
                 Stabilized Net Average Monthly Rents: Residential Suites             $1,258
                             Stabilized Net Average Monthly Rents: MHCs                 $412
               Canadian Residential Rent Increases on Renewal / Turnover     2.1% / 13.5%
                                             Same Property NOI Increase                 4.9%

The Meridian                        Stabilized Strengthening NOI Margins              64.4%
Langley, BC
                                                                                                 10
Driving Top-Line Growth
Change in Monthly Change in Monthly Weighted Average Increase
Rent on Turnovers Rent on Renewals in Stabilized Net AMR
Canada 13.5% 2.1% 4.6%
Netherlands 6.4% 3.5% 4.3%
IRES REIT 3.1% increase in monthly rents through renewals and turnovers
Overall 4.1% Increase in Stabilized Net Average Monthly Rents
11Attractive Spreads
Weighted Average Cap Rates Weighted Average Interest Rates
Canada 4.11% 3.07%
Netherlands 3.99% 1.64%
IRES REIT 4.90% 1.86%
12Another Quarter Ended December 31, 2019
Strong Operating Revenues + 16.4%
+ 20.8%
Quarter
Net Operating Income (NOI)
Stabilized NOI + 5.7%
Normalized Funds from Operations (NFFO) + 25.1%
Strong NFFO Payout Ratio 63.5%
NFFO per Unit + 11.2%
Kings Club
Weighted Average Units Outstanding + 12.4%
Toronto, ON
13Record Results in 2019
Year Ended December 31 2019 2018 (1) Change (%)
Operating Revenues $777.9M $688.6M + 13.0%
NOI $508.2M $440.6M + 15.3%
Stabilized NOI $454.5M $433.1M +4.9%
NFFO $339.1M $289.3M + 17.2%
NFFO Payout Ratio 64.6% 65.7% - 1.1%
NFFO per Unit $2.139 $2.024 + 5.7%
Weighted Avg. Units O/S (000’s) 158,553 142,974 + 10.9%Scott Cryer
Chief Financial Officer
The Point
Nursery Heights
Langley, BC
15
View Royal, BCStrong & Flexible Financial Position
Year Ended December 31 2019 2018
Total Debt to GBV 34.99% 39.37%
Weighted Average Mortgage Interest Rate 2.78% 3.05%
Weighted Average Term to Maturity (years) 5.13 5.10
Debt Service Coverage 1.87x 1.75x
Interest Coverage 3.69x 3.44x
Robust flexibility to provide the financial resources in support of
our continued portfolio growth
16Well-Positioned Mortgage Portfolio Total Mortgage Maturities and Interest Rates
Solid Liquidity Position

         $1.1 billion in equity offerings in 2019   Parkbridge
       $477 million of available cash at year-end   BC, AB, ON
                                                           18
Capital Strategy
Current Debt Exposure Asset Debt Leverage
▪ Over $3 Billion Dollars of
CMHC Based Debt
Canadian Mortgages (CMHC) 10,497 3,258
▪ Over $1 Billion Dollars of
MHC Debt/Conventional Debt 600 184 EURO based Debt at share
Total Canadian 11,097 3,442 31%
▪ Lower cost of borrowing for
EURO based Debt
Netherland Mortgage Debt (66%) 1,295 579 45% ▪ Significant MHC based
acquisitions growth with
ERES LOC (66%) 24 mean bigger need for non
CMHC Debt
EURO based borrowings 655
Ireland Equity Investment (@FV) 221 ▪ Development will impact our
need for Short Term Debt
Total Europe 1,516 1,258 83% Financing - LOC
▪ Unencumbered Pool of over
Total Leverage 12,613 4,700 37% $940MMark Kenney
President & Chief Executive Officer
The Carrington
Calgary, ABDevelopment Pipeline Pipeline of Potential Developments Completed Projects: 1 Active Applications: 2
ESG Integration Highlights

2019                             Q2                           Q3                           Q4                         2020   Q1
       Q1

            Established a             Formed ESG                   Initiated ESG-related        2019 Corporate ESG                Formalized
            dedicated in-house        Sub-Committees               policies and                 Report disclosure                 Corporate ESG
            ESG team                  • Building                   programs                     readiness                         Policy
                                        Accountability             • Corporate ESG              • Annual Report
                                      • Building Efficiency           Policy                      issuance on
                                                                   • Sustainability &             February 26, 2020
                                                                      Conservation
                                                                      Standard

                                                                                                                                                  22
Delivering Value: Corporate Strategy
LIVE WORK INVEST
Resident Employee Unitholders
✓ Modernizing portfolio
✓ Enable self-service ✓ People development programs
✓ Risk & Insurance Management
✓ Enhance resident experience ✓ Foster business agility
✓ ESG Policy implementation
23Contact Us
Canadian Apartment Properties REIT Mark Kenney
11 Church Street, Suite 401 President & Chief Executive Officer
Toronto, Ontario
M5E 1W1 Scott Cryer
Canada Chief Financial Officer
+1416-861-9404
www.capreit.net ir@capreit.net
Thank you!Property
Portfolio
Kings Club
Toronto, ON
25Portfolio Snapshot as at December 31, 2019
To date, CAPREIT manages 64,379 suites and
sites across Canada, the Netherlands and Ireland
9% Total NOI1 Residential Suites NOI1 MHC Sites NOI1
7%
1% 18%
$508.2M $476.9M $31.3M
45%
Irish Residential Properties REIT (“IRES”) is listed on the ISE2
▪ IRES IPO in April 2014
▪ CAPREIT holds 18.3% interest of IRES
o $7.2 million in dividends in 2019
▪ Strong recurring asset and property management revenues
The Netherlands 6% o $8.0 million in 2019, up 10.3% from last year
European Residential REIT (“ERES”) is listed on the TSXV3
9% 2%
▪ ERES reverse take-over completed in March 2019
▪ CAPREIT holds 66.0% ownership interest of ERES
▪ Providing property and asset management services for fees
3% ▪ $56.2M in NOI from ERES as at Q41
1. For the year ended December 31, 2019.
2.
3.
ISE stands for the Irish Stock Exchange, now trading as Euronext Dublin.
TSXV stands for the Toronto Ventures Stock Exchange.
26Regional Overview
Ontario
Residential Suites as at Dec. 31, 2019 2018
% Total NOI(1) 47.2% 50.8%
NOI ($000)(1) 239,634 224,103
NOI Margin (%)(1) 65.2 64.4
Occupancy (%) 99.2 99.4
Net Average Monthly Rents ($) 1,375 1,321
(1) For the year ended December 31, 2019
27Regional Overview
Quebec
Residential Suites as at Dec. 31, 2019 2018
% Total NOI(1) 15.4% 17.6%
NOI ($000)(1) 78,477 77,862
NOI Margin (%)(1) 58.8 58.3
Occupancy (%) 99.2 99.2
Net Average Monthly Rents ($) 1,006 970
(1) For the year ended December 31, 2019
28Regional Overview
British Columbia
Residential Suites as at Dec. 31, 2019 2018
% Total NOI(1) 11.9% 12.1%
NOI ($000)(1) 60,679 53,230
NOI Margin (%)(1) 70.6 72.4
Occupancy (%) 99.1 98.7
Net Average Monthly Rents ($) 1,403 1,297
(1) For the year ended December 31, 2019
29Regional Overview
Alberta
Residential Suites as at Dec. 31, 2019 2018
% Total NOI(1) 4.3% 5.0%
NOI ($000)(1) 21,869 21,816
NOI Margin (%)(1) 60.6 61.6
Occupancy (%) 97.3 98.3
Net Average Monthly Rents ($) 1,113 1,086
(1) For the year ended December 31, 2019
30Regional Overview
Nova Scotia
Residential Suites as at Dec. 31, 2019 2018
% Total NOI(1) 2.9% 3.2%
NOI ($000)(1) 14,733 14,004
NOI Margin (%)(1) 61.3 61.4
Occupancy (%) 98.1% 98.6
Net Average Monthly Rents ($) 1,184 1,125
(1) For the year ended December 31, 2019
31Regional Overview
Saskatchewan
Residential Suites as at Dec. 31, 2019 2018
% Total NOI(1) 0.3% 0.5%
NOI ($000)(1) 1,600 2,014
NOI Margin (%)(1) 55.9 55.3
Occupancy (%) 97.9 96.2
Net Average Monthly Rents ($) 1,035 1,035
(1) For the year ended December 31, 2019
32Regional Overview
Prince Edward Island
Residential Suites as at Dec. 31, 2019 2018
% Total NOI(1) 0.7% 0.8%
NOI ($000)(1) 3,655 3,355
NOI Margin (%)(1) 50.5 50.4
Occupancy (%) 99.1 98.9
Net Average Monthly Rents ($) 1,083 1,027
(1) For the year ended December 31, 2019
33MHC Portfolio
Residential Sites as at Dec. 31, 2019 2018
% Total NOI(1) 6.2% 4.6%
NOI ($000) (1) 31,295 20,421
NOI Margin (%) (1) 65.9 64.1
Occupancy (%) 96.0 97.6
Net Average Monthly Rents ($) 383 395
(1) For the year ended December 31, 2019
34Regional Overview
Europe
Residential Suites as at Dec 31, 2019 2018
% Total NOI(1) 11.1% 5.4%
NOI ($000)(1) 56,208 23,760
NOI Margin (%) (1) 77.0 71.7
Occupancy (%) 97.2 97.9
Net Average Monthly Rents ($) 1,231 1,268
Inclusive of commercial properties within the ERES portfolio
(1) For the year ended December 31, 2019
35You can also read