World Pressure Sensitive Tapes - Current overview and future growth Presented by: Afera
←
→
Page content transcription
If your browser does not render page correctly, please read the page content below
World Pressure Sensitive Tapes

  Current overview and future growth

                         Presented by:
                         Anurag Yadav
                         Scapa Group plc, UK
                         Head of Global Product Portfolio Management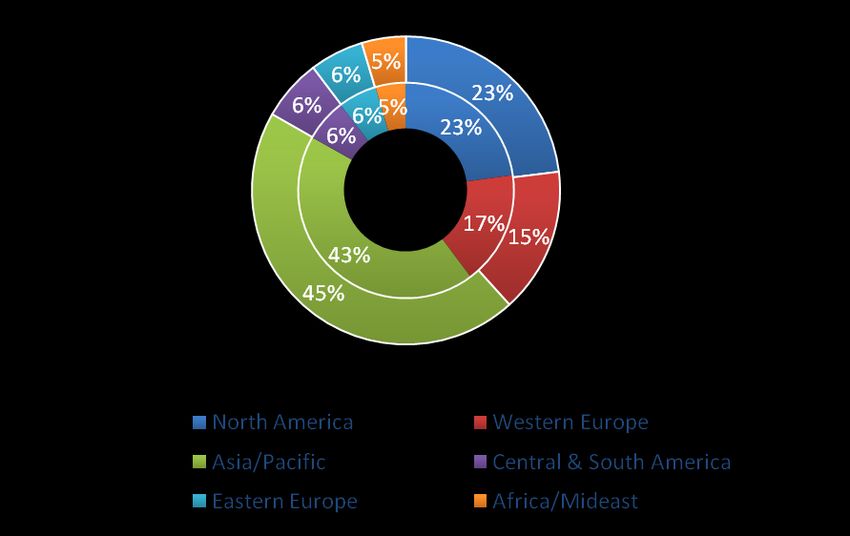
Methodology – Source of variance Data derived from variety of sources. Definitional differences. Details may not add up to the totals due to rounding up. Conversion from the national currencies to the USD may account for some statistical discrepancies All GDP estimates are based on the PPP benchmarked in 2012, i.e., a year before the base used in this study. Some narrative not factually correct, e.g., factory, office, product
PSA Overview
Asia/Pacific
In 2003 accounted for 40% of world
PSA production
5% 4% North America
In 2013 this stood at 55%
5% Western Europe
Tape sales in more advanced economies 22% Asia/Pacific
declined between 2008 – 2013:
Central & South America
Western Europe slowed
Growth in the US at less than 1%. Eastern Europe
Africa/Mideast
Tape manufacturing:
China is now world’s largest manufacturer,
15%
supplying to APAC, Eastern Europe, and North
America. 49%
Taiwan and Indonesia also produce tapes
mainly destined for export markets.
Italy is Europe’s leading manufacturer, Sales Volume- 39.3 bil m2
supplying much of the market in both Western
2013 Average Sales Price- 1.03 $/m2
and Eastern Europe. Sales Value- bil $ 40.5
.
PSA Demand Overview
By 2018 world PSA sales will
increase: 40,000
5% YoY to be 50 bil m2
6.5% YoY in market value 35,000
to be bil $ 55.5. 30,000
Average selling price is 2013
Millions $
25,000
1.11 $/m2 2018
The greatest share of PSA production to 20,000
be in the APAC region.
2023
15,000
Carton Sealing tape will continue to
account for over 2/3rd of PSA sales. 10,000
The second largest category, Masking
tape sales will be driven by 5,000
construction and automotive
0
production particularly in APAC.
North Western Asia / Central & Eastern Africa /
Appreciable gains in specialized tapes.
America Europe Pacific South Europe Mideast
Medical tape sales will increase due to America
increased healthcare accessibility
around the world.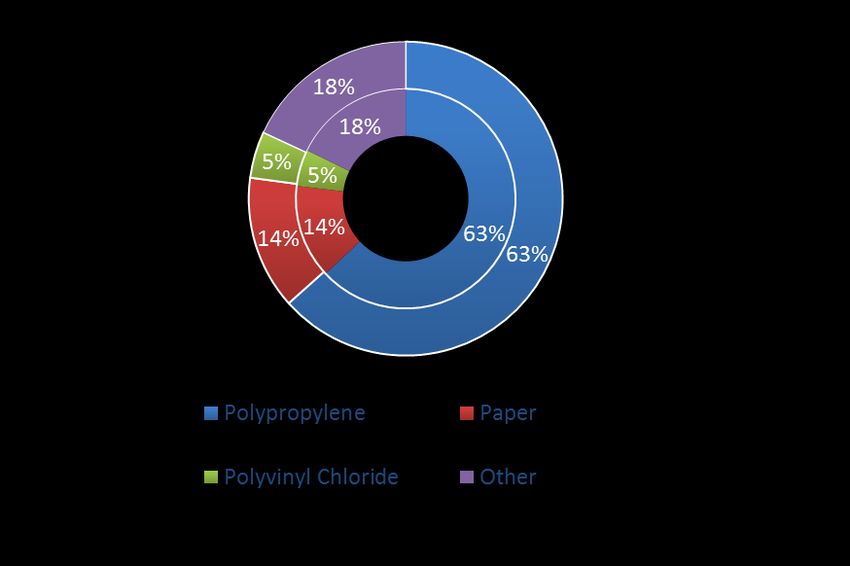
Market Players
The top four companies (20% of global share)

                                       Other significant Suppliers
                                       North America
                                       Intertape Polymer Group
      3M – bil $4                      Shurtape Technologies

                                       Europe
                                       Stokvis Tape Group (ITW)
      tesa – over bil $1               Scapa Group
                                       Boston Tapes (Chargeurs)
      Nitto Denko - over bil $1        Asia/ Pacific
                                       ACHEM Technology
                                       Four Pillars Enterprise
      Lintec - over bil $1             Sekisui Chemicals
                                       Zhejiang Yonghe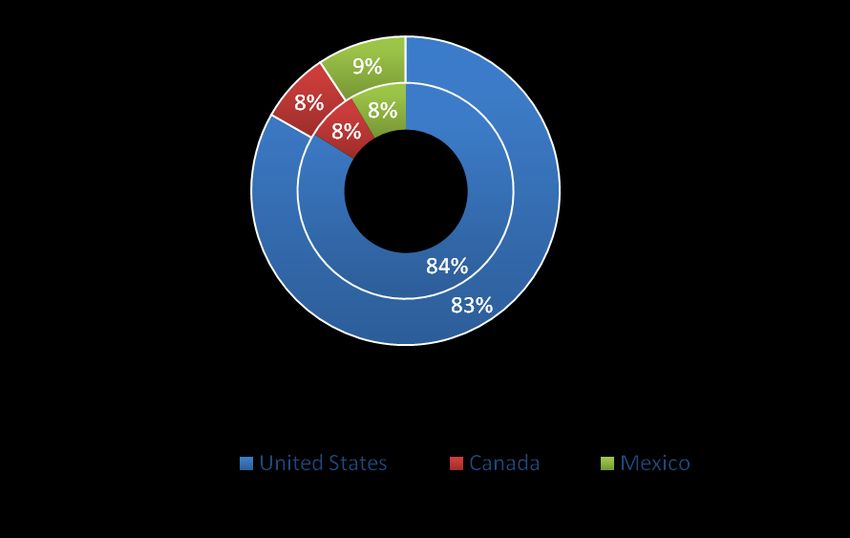
Market Variables
Factors influencing PSA sales (most of which are external to the industry
itself and beyond its direct control) are:

                                 Per Capita
                                    GDP        Pricing
                     Inflation
                                               Trend

          Spending                                       Foreign
          Patterns                                        Trade

     Consumer                     PSA                       Overall
                                                           Economic
      Income                     Sales                      Health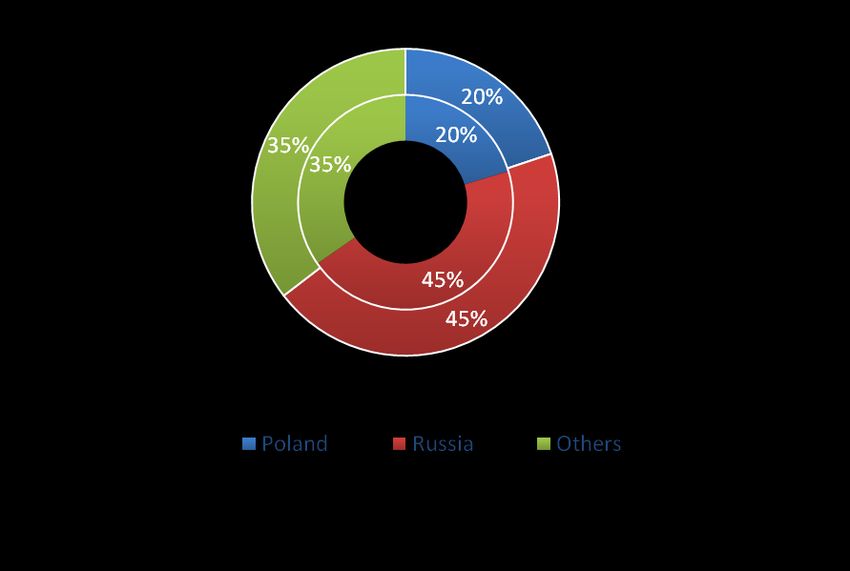
World Economic Outlook (GDP)
60,000
50,000 2013
40,000 2018
Billion $
30,000 2023
20,000
10,000
0
North America Western Europe Asia / Pacific Central & South Eastern Europe Africa / Mid East
America
World GDP to expand 3.8% YoY through to 2018 Africa/Middle East GDP will rise by 4.1% YoY
(faster than 2008 – 2013 but slower than 2003 – through to 2018.
2008). The rise in the middle classes will push this
China and India will continue to post growth rates demand higher in Nigeria and Sub Saharan Africa.
that are fastest in the world. Central and South America will see GDP rise to
Modest economic recovery in Western Europe will 3.5% through to 2018, benefiting from strong
support export oriented industries in Eastern growth in Chile, Colombia, and Peru. Brazil is
Europe, sparking growth in the region. projected to have moderate advances in real GDP.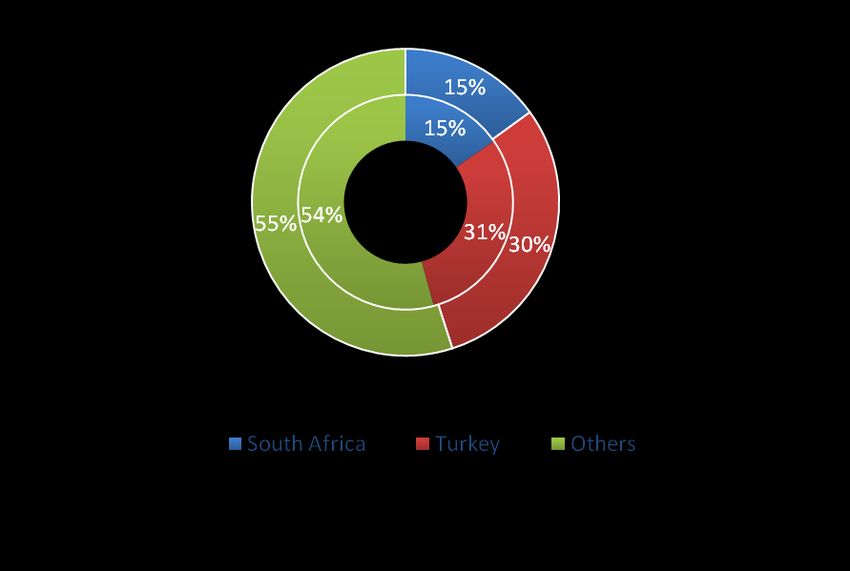
Market Environment
GDP influences tape consumption pattern.
PSA sales is positively correlated to rising income levels.
The world’s developed economies (higher income levels) have the highest levels of
per capita tape consumption.
USA and Taiwan 20 m2/capita
Developed countries exceeds 10 m2/capita
Developing world ranges between 1-5 m2/capita
The poorest areas of Africa and Asia have less than 1 m2/capitaMarket Environment
Pricing Trends
Prices can vary between countries and
Environment regions due to:
Compliance Local Inflation rates
Production
Energy Local demand.
Equipment
Availability of raw material
Globally prices:
Range from 1 $/m2 for commodity
Labour Containers
plastic tape used in undemanding
applications to 40 $/m2 for specialised
industrial application
In 2013 average selling price was 1
$/m2 however as this is linked to raw
PSA Cost
Raw Materials Transportation
material costs it is set to increase
Influencing mainly due to oil prices, which (by
factors
historical standards) will remain high
through 2018.PSA Key market verticals
Following segments account for most of the PSA tapes used globally:
Food and
Beverage
Healthcare
Building and
and Hygiene
Construction
Products
Market
Segments
Electrical
Automotive and
ElectronicsMarket Environment
Food and Beverage
2013 2018 2023
1.600
1.400
1.200
1.000
Billion $
800
600
400
200
0
North America Western Europe Asia/Pacific Central & South Eastern Europe Africa/Mideast
AmericaMarket Environment
Building and Construction 2013 2018 2023
8000
7000
6000
Billion $
5000
4000
3000
2000
1000
0
North America Western Europe Asia/Pacific Central & South Eastern Europe Africa/MideastMarket Environment
Automotive
2013 2018 2023
80000
70000
Vehicle production (‘000 units)
60000
50000
40000
30000
20000
10000
0
North America Western Europe Asia/Pacific Central & South Eastern Europe Africa/Mideast
AmericaMarket Environment
Healthcare and Hygiene Products
2013 2018 2023
7000
6000
5000
4000
Billion $
3000
2000
1000
0
North America Western Europe Asia/Pacific Central & South Eastern Europe Africa/MideastRaw Materials
The use of backing and adhesive materials is expected to lag in the PSA market.
The trend is moving towards lightweight material or to down gauging (using thinner
backings and adhesive coatings) for financial and environmental reasons.
The adhesive is the largest part of the costs associated with PSA, also the most critical
component, as it determines how well it sticks.
Major players in the PSA industry are investing in solvent recovery systems to slow the
transition to aqueous formulations.
Increased use of hot melt adhesives due to the environmental advantages such as:
Low energy requirements.
Lower production costs as opposed to solvent borne types.
The conversion from solvent to hot melt can reduce investment and coating cost
considerably.Tape Backing Materials
Overall Demand Overview
50.15 bil m²
Polypropylene
Paper
Polyvinyl Chloride 39.3 bil m²
OthersTape Backing Materials
Overall Demand Overview
2018
Polypropylene
2013
Paper
Polyvinyl Chloride
OthersTape Backing Materials
Polypropylene Demand Overview
31.79 bil m²
Polypropylene
Paper
24.77 bil m²
Polyvinyl Chloride
OthersTape Backing Materials
Polypropylene Demand Overview 37%
12%
14%
Polypropylene 26% 27% 36%
Paper
Polyvinyl Chloride
Others
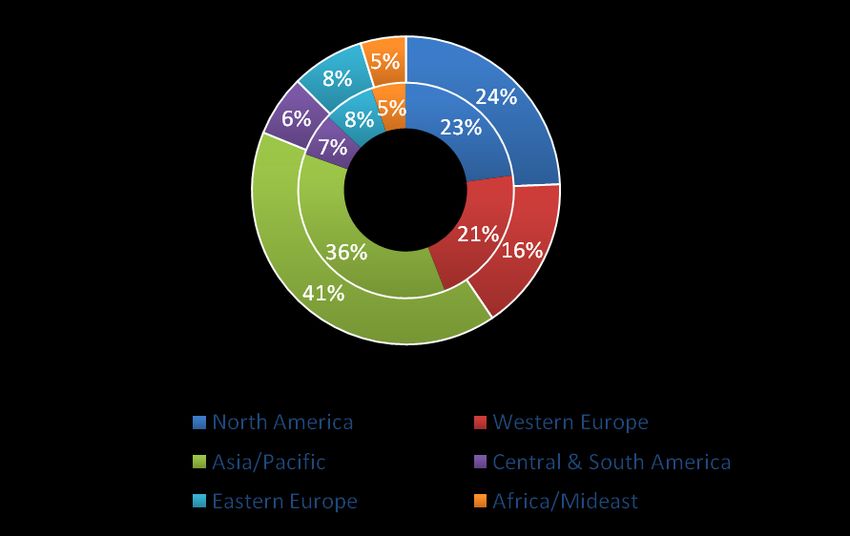
PP is expected to grow 5.1% YoY through 2018 – 31.8 bil m2.
PP accounted for 63% of total PSA in 2013, and accelerated gains for
corrugated box will drive this growth through 2018.Tape Backing Materials 2018
Polypropylene Demand Overview 5% 4% 17%
5%
5%4% 20%
5%
12%
Asia/Pacific 2013 13% Western Europe
by 4%
by 1%
53%
Polypropylene 57%
Paper
Polyvinyl Chloride North America Western Europe
Others Asia/Pacific Central & South America
Eastern Europe Africa/Mideast
PP is expected to grow 5.1% YoY through 2018 – 31.8 bil m2.
PP accounted for 63% of total PSA in 2013, and accelerated gains for
corrugated box will drive this growth through 2018.Tape Backing Materials
Paper Demand Overview
6.89 bil m²
Polypropylene
Paper
5.42 bil m²
Polyvinyl Chloride
OthersTape Backing Materials
Paper Demand Overview 31%
28.5%
14%
Polypropylene 27% 22% 30%
Paper
Polyvinyl Chloride
Others
Paper backed PSA tapes are projected to grow 4.9% YoY to 6.9 bil m2.
Masking tapes will drive this growth despite not being utilised in growing markets
such as electronics and industrial bonding.
Paper tapes are more environmental friendly due to the recyclable and repulpable
nature. This will help drive the sales.Tape Backing Materials 2018
Paper Demand Overview
2013
Polypropylene
Paper
Polyvinyl Chloride
Others
Paper backed PSA tapes are projected to grow 4.9% YoY to 6.9 bil m2.
Masking tapes will drive this growth despite not being utilised in growing markets
such as electronics and industrial bonding.
Paper tapes are more environmental friendly due to the recyclable and repulpable
nature. This will help drive the sales.Tape Backing Materials
Polyvinyl Chloride Demand Overview
Polypropylene
Paper 2.4 bil m²
Polyvinyl Chloride
Others
2.13 bil m²Tape Backing Materials
Polyvinyl Chloride Demand Overview
26%
20%
Polypropylene
13%
Paper
10% 11% 4.5%
Polyvinyl Chloride
Others
Growth at 2.5% YoY to 2.4 bil m2 will be below the global PSA growth rate.
PVC gains will be mostly restricted to China, in the rest of the world demand will be
weak or will decline.
Environment (VOC) concerns will drive this decline.Tape Backing Materials 2018
Polyvinyl Chloride Demand Overview
2013
Polypropylene
Paper
Polyvinyl Chloride
Others
Growth at 2.5% YoY to 2.4 bil m2 will be below the global PSA growth rate.
PVC gains will be mostly restricted to China, in the rest of the world demand will be
weak or will decline.
Environment (VOC) concerns will drive this decline.Tape Backing Materials
Others Demand Overview
Polypropylene
Paper
9.1 bil m²
Polyvinyl Chloride
Others
6.97 bil m²Tape Backing Materials
Others Demand Overview
36%
Polypropylene 22%
Paper 21%
Polyvinyl Chloride
29% 32% 38%
Others
Grow 5.4% YoY to 9.1 bil m2 by 2018.
Medical grade cloth, Foam, Fiberglass, Fabrics, Glass cloth, Reinforced
epoxy, Polyester, PEN, Polyimide, and PTFE all are expected to grow above
average.2018
Tape Backing Materials
Others Demand Overview
Polypropylene 2013
Paper
Polyvinyl Chloride
Others
Grow 5.4% YoY to 9.1 bil m2 by 2018.
Medical grade cloth, Foam, Fiberglass, Fabrics, Glass cloth, Reinforced
epoxy, Polyester, PEN, Polyimide, and PTFE all are expected to grow above
average.North America
Overall projected sales will increase by 3.2% YoY to 2018
9.9 bil m2 in 2018
North America PSA market share
US has 84%
Canada has 8%
Mexico has 9%
2013
Mexico will outpace this growth by a small margin through
2018.
Market Trends
Carton sealing tapes accounted for 60% (lower than
the global average of 67%) of NA tape sales.
Polypropylene accounted for 58% of total 2013 sales.
Smaller but faster growing niche applications will see
faster than average gains such as: cloths, foams, and
non-wovens.Western Europe Regional tape production will rise a modest 1.2% annually 2018 to 6.3 bil m2 in 2018. Germany has the largest regional market share with 23% of the total . France, Italy, United Kingdom, and Spain each account for at least 10% of the market. Italy will remain the largest regional producer. 2013 Market Trends Western Europe will have the market edge with speciality tapes. Solvent based adhesives will continue to be replaced by environment friendly waterborne and hot melt types.
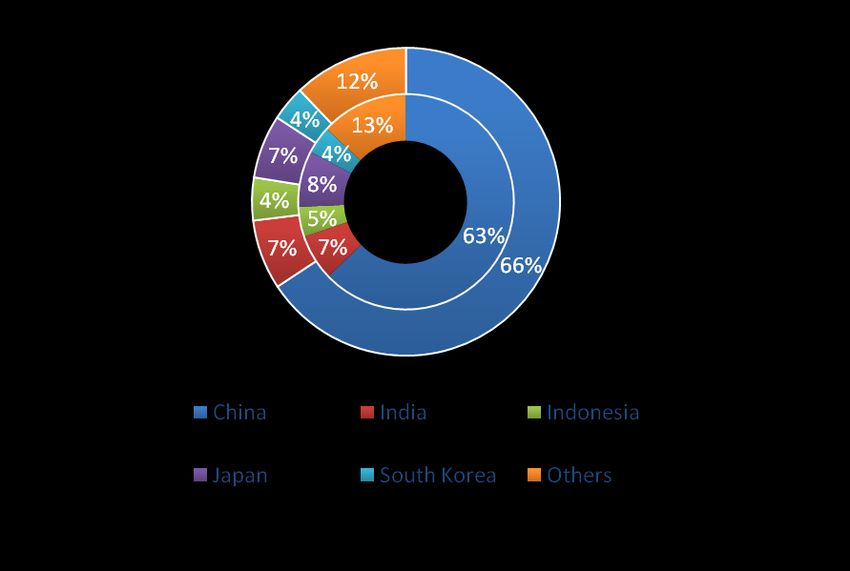
Asia/Pacific Asia/Pacific represents the largest regional market 2018 globally. Sales of PSA was 19.1 bil m2 in 2013, projected to increase by 6.4% to 26.1 bil m2 in 2018. China accounting 65% of this total. Growth will be due to continued expansion in China, India, and Indonesia. Production is expected to rise 6.4% per year through to 2018 2013 to achieve 30.5 bil m2. Market Trends A large amount of the tape production features PP. Medical tapes despite being less intensively used than in advanced economies (due to the population size and healthcare infrastructure) make this a significant growth market Carton Sealing tapes made up 73% of regional tape sales (slightly higher than N. America and W. Europe). Increased packaged goods consumption and production is linked to climbing income per capita. Japanese motor vehicle production accounted for half the regional production in 2003 but will drop to 15% by 2018, partly due to automakers shifting production to Thailand, Malaysia, and other Asian locations.
Central and South America
2018
Total sales: 2.1 bil m2 (5% of global market) in 2013, to grow by
4.7% to 2.6 bil m2 in 2018.
Brazil accounted for 45% of the total.
Excluding Brazil sales was 1.1 bil m2, this is expected to increase
by 4.4% YoY to 1.4 bil m2 in 2018. 2013 46% 47%
53% 54%
Other significant markets include Argentina, Venezuela, and
Colombia.
Regional tape shipments to increase by 4.6% YoY to 1.65 bil m2 Brazil
by 2018. Others by 1%
There is considerable interregional trade of tapes. For instance by 1%
most of Brazil’s tape exports go to Argentina, Chile, Colombia,
Ecuador, Peru, Uruguay, and Venezuela.
Brazil’s expansion in manufacturing and construction activities Brazil Others
will boost the regional demand, for speciality, electronics,
electrical, and double sided tapes.Eastern Europe
2018
PSA demand is projected to increase 4.8% to 2.6 bil m2 in
2018.
Market Trends
Market growth is linked to the expanding middle class
rising personal income driving demand for consumer
goods leading to an increase in manufacturing activity. 2013
The European packaging markets range moderately from
advanced EU member states – Czech Republic, Hungary,
and Poland - to very limited in less developed countries like
Albania and some of the Balkan states.
Carton sealing accounted for 62 % of the tape used in
Eastern Europe in 2013 .
EU membership has made East European countries more
attractive to Western European. Countries such as Czech
Republic and Poland are expected to boost growth due to
these factors.Africa Mideast This region encompasses 80 countries and territorial dependencies located on or near the continent of Africa and the Arabian Peninsula, or in 2018 Southwest Asia from Iran westwards to the Mediterranean Sea. The region’s population increased 2.3% annually from 2003 – 2013 surpassing 1.4 billion and remaining the second most populous region after the Asia/ Pacific. The largest manufacturers in this region are found in South Africa and Turkey both have sizable manufacturing bases in comparison to others in the region. 2013 Market Trends Real GDP is set to rise 4.1% through 2018 the second fasted pace of any region. Turkey Sales for PSA totalled 1.6 bil m2 in 2013, accounting 4% of global market. Others by 1% Sales for PSA are expected to increase 6.0% YoY to 2.1 bil m 2 in 2018. by 1% The best opportunities for growth in this region are with the more developed countries such as Israel, Saudi Arabia, South Africa and Turkey. Carton sealing tapes remain the largest tape segment accounting for 62% of total sales in 2018. Demand for Masking tapes in Turkey in particular will increase due to the building and construction expenditures. PSA demand in Iran and Turkey will be bolstered by the motor vehicle industry.
Thank you
You can also read