The Digital Video Revolution- OTT Evolution - IAB
←
→
Page content transcription
If your browser does not render page correctly, please read the page content below

The Digital Video Revolution—
OTT Evolution
Vijay Solanki, Chief Executive Officer, IAB Australia
Allen Klosowski, Vice President, Advanced Solutions Group,
SpotX
Ivan Fuyala, Senior Vice President Commercial Partnerships,
VEVO
Eric John, Deputy Director, Video, IAB

IAB Digital Video Center of Excellence
Defining OTT
IAB OTT Definitions
 Over the Top Device
 A device that can connect to a TV (or functionality within the TV itself) to facilitate
 the delivery of Internet-based video content (i.e., streaming boxes, media
 streaming devices, Smart TV’s/Connected TV’s and gaming consoles).

 Over the Top Video
 Over the Top Video is video content transported from a video provider to a
 connected device over the Internet outside the closed networks of telecom and
 cable providers.

 Connected TV
 A television set that is connected to the Internet via OTT devices, Blu-ray players
 and gaming consoles or has built-in Internet capabilities (i.e., a Smart Television)
 and is able to access a variety of long-form and short-form web-based content.
p3
CONNECTED TV
TRENDS
DECLINE OF PAY TV USAGE BY
  DEMOGRAPHIC                                                         Change in Hours Spent Watching Traditional TV Per
                                                                      Month By Age Group

                                                                              15

   Change in Time Spent Watching Traditional TV by Age Group
   (Live + VOD + DVR + Based on Q4s, US Only)

 5%

 0%                                                                                   0
 -5%

-10%

-15%
                                                                       -13
                                                                                           -16
-20%                                                                                                                 -19

-25%

-30%                                                                                             -33
                                                                                                              -35
-35%

-40%                                                                                                    -43
       2010        2011           2012          2013   2014    2015
                                                                      US POP 65+ 50-64 35-49 25-34     18-24 12-17 2-11
US PAY TV SUBSCRIBERS (2010 – 2017)
PAY TV SUBSCRIBER DECLINE YoY

                                      1.5%
                                2%

                                1%
                                                                         -.2%
                                0%

                                -1%                                                                                     -.9%

                                -3%                                                                                    -2.7%

                                -4%
                                      Q1 Q2 Q3 Q4 Q1 Q2 Q3 Q4 Q1 Q2 Q3 Q4 Q1 Q2 Q3 Q4 Q1 Q2 Q3 Q4 Q1 Q2 Q3 Q4

                                       2010    2011     2012      2013      2014     2015       2016       2017
       INCLUDING vMVPDS
                                                                                                       Source: FierceCable, 2017
    EXCLUDING vMVPDs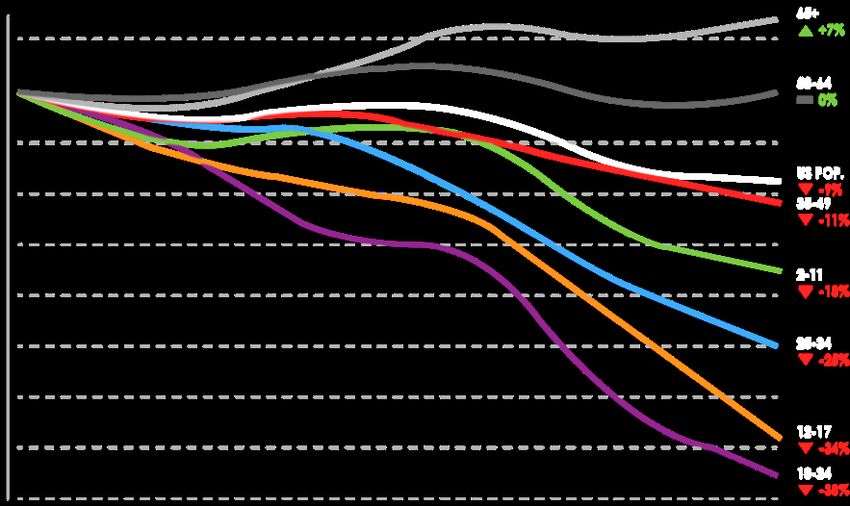
OTT OPPORTUNITY IN NORTH AMERICA

                        $24 Billion
                         OTT spend in
                        North America
                        by 2021, a 58%
                        increase from
                             2015

                         Source: eMarketer, Digital TV Research
EU RESEARCH - ANALYTICAL FRAMEWORK
                       Audience viewing
                       How will awareness
                           & viewing
                       preferences of ad-
                       supported services
                            change?
       Market enablers                    Advertiserdemand
                                        Advertiser   demand
        How will CTV    Prospects for          Will demand for
        penetration     connected TV            programmatic
         increase?       advertising           buying drive CTV
                                              advertising growth?

                       Broadcaster barriers
                           Will policy &
                        regulation impede
                              growth?
                        Can broadcasters
                          collect & utilize
                         audience data?                             Source: MTM commissioned by SpotX, 2017
FOCUS OF RESEARCH

                          TVs connected to the open internet

                                                                      Pay-TV STBs           Pay-TV STBs with
                        Streaming media
      Smart TVs                                 Game consoles      connected to open         only managed
                             devices
                                                                        internet                services

• Smart TVs with an   • Connected set-top     • Gaming consoles   • Pay-TV STBs that     • Pay-TV STBs that only
  active broadband      boxes and dongles       with media          provide access to      provide access to
  connection            (e.g. Amazon Fire TV,   streaming           3rd-party OTT apps     operator-controlled
                        Apple TV, Roku,         functionality       and video players      services (e.g. catch-
                        Chromecast)                                                        up and TVOD)
OTT GROWTH IN WESTERN EUROPE
Over-the-top TV & video revenues in Europe are slated to more than double
between 2016 and 2021 in the UK and Big 5
€ 300.00

€ 250.00

€ 200.00

€ 150.00

€ 100.00

 € 50.00

    €-
           UK           France            Germany   Spain                Italy

                                   2016    2020

                                                             Source: MTM commissioned by SpotX, 2017
UK - MARKET OVERVIEW
ENABLEMENT
Audience
91% of UK households have broadband viewing
AUDIENCE
2/3 of UK households have a connected TV in 2016 Market Advertiser
Projected to be 75% by 2020 enablers demand
Half of Channel 4’s “All 4’s” viewing is now via a
Connected TV Broadcaster
barriers
DEMAND
Top 3 priority for broadcasters
Channel 4, ITV & Sky already use DAI technologies
Key – Prospects for CTV advertising:
BARRIERS
A common currency for measurement Good Fair Poor
BARB Dovetail coming March 2018UK - MARKET FORECAST
€ €220 m
CAGR:
19%
€
Currently the most
mature market of the €
Big 5, the UK will have €110 m
the lowest growth rate
between 2016 and 2020 €
€FRANCE - MARKET OVERVIEW
ENABLEMENT
44% of households accessing TV via IPTV Audience
viewing
Broadband penetration & speed believed to be sufficient
AUDIENCE
Market Advertiser
57% connected TV penetration enablers demand
Expected to grow to 75% by 2020 driven by smart TV sales
& new French language content
Broadcaster
barriers
DEMAND
Total video measurement in place via Médiamétrie
Planned industry initiatives and agreements to enable
sharing of data
Key – Prospects for CTV advertising:
BARRIERS
Good Fair Poor
Anticipated changes in regulation, permitting
addressable advertising in linear broadcastsFRANCE – MARKET FORECAST
€240 m
France will have CAGR:
63%
the 2nd fastest
growth rate among
Big 5 behind Italy
€35 m
2016 2020GERMANY - MARKET OVERVIEW
ENABLEMENT
Audience
79% broadband penetration through urban & rural viewing
areas
AUDIENCE Market Advertiser
39% connected TV penetration in 2016 enablers demand
Expected to grow to 55% by 2020 driven by smart TVs
+ Amazon Fire TV Broadcaster
barriers
DEMAND
Further investment by the main broadcasters, RTL
and ProSiebenSat.1, will create new opportunities
BARRIERS Key – Prospects for CTV advertising:
Regulations are old and unclear; Good Fair Poor
Regional advertising in linear is currently prohibitedGERMANY - MARKET FORECAST
€
€
Germany will have
the 2nd lowest € €125 m
growth rate, tied CAGR:
with Spain at 24% €
24%
CAGR €50 m
€SPAIN - MARKET OVERVIEW
ENABLEMENT
76% fixed broadband penetration Audience
viewing
AUDIENCE
28% household penetration in 2016
Market Advertiser
Expected to grow to 50% by 2020, driven by smart enablers demand
TVs
Growth is from Netflix and Amazon
Broadcaster
barriers
DEMAND
Expected broadcaster investment will be grown by
advertiser and agency demand + adoption
BARRIERS Key – Prospects for CTV advertising:
Mediaset and Atresmedia, controlled 85% of the TV Good Fair Poor
ad market in 2016
Lack of user log-in dataSPAIN - MARKET FORECAST
€
€
Low market
penetration will €
contribute to relatively CAGR:
€ 105 m
low growth rates € 24%
€ 45 m
€ITALY - MARKET OVERVIEW
ENABLEMENT
59% of households have broadband Audience
viewing
AUDIENCE
15% connected TV penetration
Expected to rise to 30% by 2020 Market Advertiser
enablers demand
Many not yet accustomed to VOD options
DEMAND Broadcaster
New audience measurement poised to support demand barriers
BARRIERS
Require coordination of broadcasters & smart TV
manufacturers
Key – Prospects for CTV advertising:
Mediaset and RAI control 56% of TV and 21% of total TV Good Fair Poor
ad spend in 2016ITALY - MARKET FORECAST
€ 105 m
Largest projected growth CAGR:
rate among the Big 5 80%
€ 10 m
2016 2020OTT GROWTH IN LATIN AMERICA
Millions ($)
Source: Digital TV Research, July 2016ASIA PACIFIC OTT REVENUES TO INCREASE 3X
Millions ($)
Source: Digital TV Research, July 2017 Source: Digital TV Research, July 2017THANK YOU.
IAB GLOBAL
  SUMMIT
  OCTOBER 31, 2017
Video

AD REVENUE
H1 2017 (Jan-Jun)
                                Mobile
 $7.5B Total Ad Market
50.1% of Total Paid Ad Market
($3.77b)
Video
Now 6% of total ad
market
Mobile
Now 18% of total ad
market
                            Source: IAB Australia/PwC Online Ad Expenditure Report; CEASA
Table
t29% Desktop
32%
DIGITAL VIDEO
MONTHLY
UNIVERSE – 18+
Share of
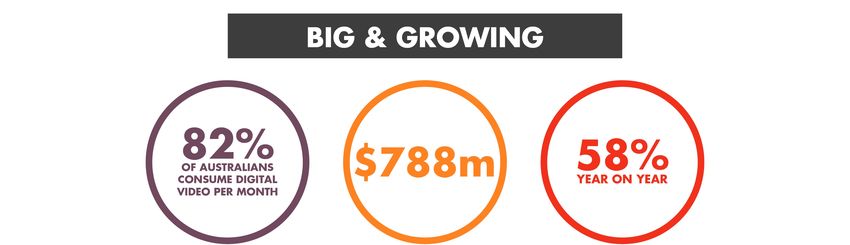
Monthly video
Video Time
audience
81% of Australians aged
18+ (15.4m) are viewing
27TIME
hr PER
31MONTH
mins PER perPERSON
month
on average.
(hr:min:sec)
18-24 34:56:56
25-34 34:34:00
35-44 31:08:02
45-54 24:53:46
39%
Mobile
55-64 24:59:54
Source: Nielsen Digital Content Ratings July 2017
65+ 9:27:25CONNECTED TV
IAB WHITEPAPER
AUGUST 2017THE STATE OF DIGITAL VIDEO
IN AUSTRALIA?
Source: Nielsen/IAB DCR Data, 2017; PwC/IAB OAER, 2017IS CTV SCALABLE?
STREAMS
STREAMS
250
%
growthWHERE IS THE GROWTH COMING FROM?
WHERE IS THE
GROWTH COMING
FROM?WHICH OTT DEVICES ARE
LEADING?WHAT DOES IT MEAN
FOR ADVERTISERS?
2.9 BillionCHALLENGES
MEASUREMENT
& STANDARDS
Trying to measure behaviour across a range of
different OTT devices (such as Apple TV and
Chromecast), gaming consoles and smart TVs that all
work in different and often proprietary ways is
technically difficult and expensive to implement a
market level solution.
CTV content includes a diverse range of stakeholders,
traditional broadcasters, OTT providers, digital video
content (e.g. YouTube) which means that a CTV
measurement solution needs to be a collaborative
process across a wide spectrum of the broadcast and
digital media industry.OTT OVERVIEW Ivan.Fuyala@vevo.com SVP Commercial Partnerships +1 917 226 2156 OCT 2017
38
THE WORLD’S LEADING
MUSIC VIDEO
P L AT F O R M

  300,000        350
    VIDEOS   CONTENT PARTNERS
VEVO ON YOUTUBE:
FRACTION OF CONTENT: MASSIVE AUDIENCE
“Vevo music
videos make
up over 54% of
0.003% 54% monthly
audience”
VEVO VIDEOS ON TOTAL YOUTUBE AUDIENCE
YOUTUBE
(Source: comScore Cross-Platform Video Metrix, US March 2017. . Please note that the Total Digital and Mobile columns only reflect mobile reporting for A18+ at this time.)MILLENIALS ARE OUR CORE AUDIENCE
VEVO DEMOGRAPHICS
65+ 1%
55-64 2%
45-54 7%
35-44 15%
25-34 35%
18-24 32%
13-17 9%
M 56% | F 44%
Source: Vevo internal analytics and YouTube analytics Aug 2017VEVO: EXPONENTIAL GROWTH
VEVO MONTHLY VIEWS
30,000,000,000
25,000,000,000 2.4B
20,000,000,000
15,000,000,000
10,000,000,000
5,000,000,000
0
1/1/10 1/1/11 1/1/12 1/1/13 1/1/14 1/1/15 1/1/16 1/1/17
Desktop Mobile TVOTT: 5X INCREASE IN SHARE OF VIEWS
VEVO: PROPORTION OF VIEWS FROM OTT
12%
10%
10%
8%
6%
4%
2%
0%
2011 2012 2013 2014 2015 2016 2017
Source: Vevo internal analyticsFUTURE: SMALL SCREENS AND BIG SCREENS
2010 2017
10%
34%
55%
99%
Desktop Mobile TV Desktop Mobile TVOTT PERCENTAGE VARIES BY
MARKET
11% 7% 13% 11%
34% 31% 23%
39%
55% 62% 48%
66%
MEXICO ITALY CANADA US
MOBILE DESKTOP OTT
Source: Vevo internal analytics September 2017HIGHER MONTHLY
TIME SPENT PER
TV USERS SESSION REFLECTS
WATCH CONNECTED TV’S
“LEAN BACK”
MORE
VEVO PER
ENVIRONMENT
81
VISIT MINUTES PER
SESSION
Source: Vevo Internal Analytics, CA Q2 2017 viewing metrics
Source: Vevo Analytics, US September 2015, Platform engagement excludes YouTube streams 4647
OTT VIEWS PEAK ON FRI & SAT NIGHT
2017 - VEVO DAILY VIEWERSHIP % OF TOTAL
25%
20%
15%
10%
5%
0%
Monday Tuesday Wednesday Thursday Friday Saturday Sunday
Source: Vevo
Source: Vevo Internal
Internal Analytics,
Analytics, US
CA2017
‘15-’17 daily
daily viewing
viewing metrics. 2017 viewership through 10.1.17.
metrics.APPLE AND ROKU WITH AMAZON UP
3% 4% 3%
11%
12%
24%
46%
73% 50% 37%
84% 48%
MEXICO ITALY CANADA US
APPLE TV ROKU AMAZON OTHER
Source: Vevo internal analytics September 2017PRODUCT CHALLENGES:
1. Fragmentation - All have different operating systems
2. ‘First Voice’ becoming an increasingly important part of discovery
3. OTT providers want to control discover at the root level
4. Some are asking for ad inventory/ revenue
ROKU APPLE TV GAME CONSOLES NATIVE TVOTT MEASUREMENT CHALLENGES:
1. Viewability – Very limited due to SDK & no VPAID
PURCHASE
FUNNEL
2. Demo – Nielsen DAR available through Roku network
3. Brandlift – Very nascent (mainly IP based)
4. Purchase – Limited to those who have 1st party data or
IP based matching solution with sample issuesTARGETING CHALLENGES: 1. Matching is restricted to whatever the publisher can match or IP 2. Apple and Roku do have IDs that data companies can start to use 3. For those on YT - None of the 3rd party data in DFP extends to OTT 4. Experian/Axciom linking household level data for linear TV & OTT 5. To date “device graphs” have struggled to extend to CTV at scale
OTT OPPORTUNITIES FOR PUBLISHERS

• Opportunity for digital 1st publishers to own SOV in living room
• Those with registration data can participate in addressable TV
  ecosystem (matching CRM)
• Opportunity for AVOD publishers to drive CPM due to scarcity
• As 3rd party data sets start to accurately extend into this
  ecosystem, publishers may be able to target more accurately
FA ST G R O W I N G    CHALLENGES:        O P P O RT U N I TY
   P L AT F O R M      Pr o d u c t
                       Ta r g e t i n g
                       Measurement

                      QUESTIONS
You can also read