Macroeconomic Conditions and Outlook for 2021 - Carolina Soto* Member of the Board April 2021 - Banco de ...
←
→
Page content transcription
If your browser does not render page correctly, please read the page content below
Macroeconomic Conditions and
    Outlook for 2021
      Carolina Soto*
      Member of the Board
      April 2021
                                                                                                                      1
*Opinions presented herein do not represent the position of the Board of Directors of the Central Bank of Colombia.
CONTEXT
Content CONDITIONS THAT SUPPORT THE POLICY RESPONSE
ECONOMIC FORECASTS
POLICY CHALLENGES• The Colombian economy is facing an unprecedented shock because of the pandemic. There is uncertainty
about its evolution, while further outbreaks and the ensuing public and private responses might hinder
economic recovery.
Mobility Trends
20
10
0
0
-10
-20
-20
-40
-30
-60 -40
-50
-80
-60
-100 -70
Feb-20 Mar-20 Apr-20 May-20 Jun-20 Jul-20 Aug-20 Sep-20 Oct-20 Nov-20 Dec-20 Jan-21 Feb-21 Mar-21 Dec-20 Dec-20 Dec-20 Jan-21 Jan-21 Feb-21 Mar-21 Mar-21
Retail Colombia Workplaces Colombia Retail Brazil
Workplaces Brazil Retail Peru Workplaces Peru
Source: Google Mobility Trends 3• External liquidity is abundant, and sovereign risk premia are still at historically low levels. There are
risks stemming from the recent steepening of the yield curve in the U.S.
• Portfolio flows to emerging markets remain positive but have decreased.
Historical distribution of the 5-year CDS Portfolio flows to Emerging Markets
(daily data since 2010) (USD billion)
600 120
100
80
500
60
40
400 20
Basis points
__Max since 2010
0
300 -20
-40
200 -60
__75th percentile -80
__25th percentile -100
100
__Min since 2010 -120
Jul-19
Jul-20
Aug-19
Jan-20
Sep-20
Feb-21
Sep-19
Feb-20
Aug-20
Jan-21
Oct-19
Oct-20
Mar-19
Mar-20
Mar-21
Jun-19
Jun-20
Apr-20
Apr-19
May-19
Dec-19
May-20
Dec-20
Nov-19
Nov-20
0
Colombia Chile Brazil Peru Mexico
Emerging Asia Latin America Emerging Europe
Latestdato
data Africa & Middle East Total
Rango Intercuartiles
Interquartile range Último Mediana
Median
(mid-March)
Sources: Bloomberg, IIF; calculations by Banco de la República. 4• Commodity prices have increased. The oil price has risen above previous
expectations
Oil prices
100
80
60
40
Dollars per barrel
20
0
Jan-17 Jun-17 Nov-17 Apr-18 Sep-18 Feb-19 Jul-19 Dec-19 May-20 Oct-20 Mar-21
-20
-40
-60
WTI Brent
Source: Energy Information Administration
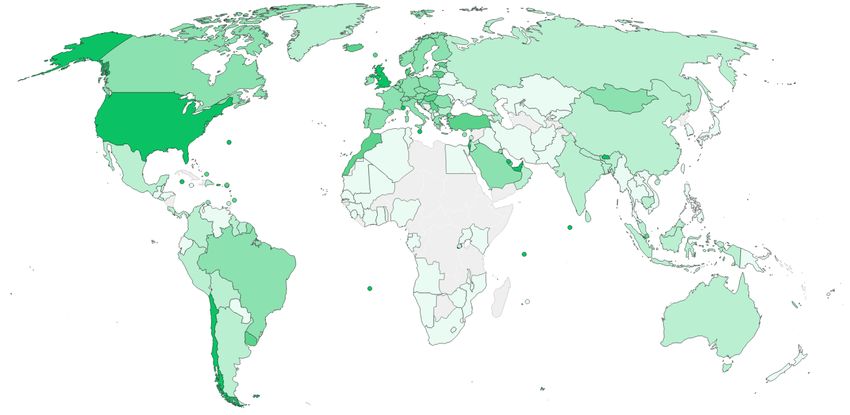
5• The vaccination process will support growth in 2021. The recovery path is likely to be
heterogeneous across countries.
Vaccination process
(% of population covered*)
6
Source: Bloomberg, updated March 30th. *Population covered” divides the doses administered for each vaccine type by the number of doses required for full vaccination• Progress in the vaccination programs and the impulse of fiscal and monetary
policies in advanced economies have improved the outlook for global growth
IMF Economic Growth Projections
(% change)
Difference from January 2020 WEO
2021 Projection update Projections
World Output 6,0 0,5
Advanced Economies 5,1 0,8
United States 6,4 1,3
Euro Area 4,4 0,2
Japan 3,3 0,2
China 8,1 0
Source: IMF – World Economic Outlook. April 2021
7• Analysts estimate that the region will grow 4.5% in 2021. Forecasts have
improved after positive news regarding global demand and the vaccines.
Growth Forecasts for 2021
(Analysts’ estimates)
12
10 9,5
8
5,8
6 5,4
5,0
4,3 4,1
4 3,5 3,5
2
0
Peru Argentina Mexico Ecuador Colombia Chile Brazil Paraguay
August 2020 October 2020 December 2020 January 2021 March 2021
Source: Latin American Consensus Forecast. Forecasts for the region do not include Venezuela.
8CONTEXT
Content CONDITIONS THAT SUPPORT THE POLICY RESPONSE
ECONOMIC FORECASTS
POLICY CHALLENGES• The monetary policy framework and other characteristics
of the Colombian economy allowed for a quick response
against the shocks and provide space to react in the
future:
1. The Colombian economy has a fully-fledged inflation targeting regime
with exchange-rate flexibility, and the Central Bank has high credibility.
2. Adequate levels of external buffers.
3. Adequate financial supervision and regulation.
4. There is a Medium-Term Fiscal Framework that seeks to achieve a
sustainable path for public debt.
10• Currency mismatches are low, allowing the exchange rate to become the first line of defense against
external shocks without creating financial stability concerns. Unhedged FX denominated debt of the
corporate sector has not changed substantially and nowadays represents only 5.3% of GDP
Debt of the Private Corporate Sector as % of GDP, by FX Hedge*
60
1,88
1,28 5,3%
50 2,22
4,74
40 4,18
5,17
% of GDP
30
20
34,14
10
0
2010 2011 2012 2013 2014 2015 2016 2017 2018 2019 jun-20
External leasing in foreign currency External suppliers in foreign currency
Other Debt of firms with FDI - unhedged
Non exporters' debt with hedge Exporters' debt
Local currency debt
Source: Banco de la República – Financial Stability Report 2020-II. *Fx debt from suppliers and leasing is not available by ID, and it is not posible to identify if this debt has an FX hedge. 11• The high credibility of the Central Bank maintains inflation expectations close to the target
despite the size of the shocks.
Inflation and inflation expectations
10%
9%
8%
7%
6%
5%
4%
3% 3,12%
2,87%
2%
One-year ahead inflation expectations Two-year ahead inflation expectations Headline inflation 1,51%
1%
0%
Mar-16 Mar-17 Mar-18 Mar-19 Mar-20 Mar-21
Source: Banco de la República (monthly expectations survey) and DANE.
12• External liquidity levels are adequate and were reinforced mostly through the direct purchase of
USD 3.5 billion from the National Government and the augmentation of the Flexible Credit Line
with the IMF to USD 17.2 billion.
Foreign Reserves and Flexible Credit Line (precautionary)*
(% of the IMF’s ARA metric)
220%
200%
180%
160%
140%
Adequate level of
120% reserves suggested by
the IMF
100%
80%
60%
Flexible Credit Line
International reserves
40%
20%
0%
Source: Banco de la República and IMF. *The reduction observed in December is explained by the disbursement of USD 5.4 billion from the FCL to the government.The Central Bank has used its toolbox to support the economy by:
• Providing liquidity to avoid disruptions in the payment systems and
contribute to the credit supply by financial institutions.
• Helping stabilize key financial markets that have suffered liquidity
problems.
• Maintaining external buffers to facilitate external payments of the
economy.
• Supporting the economy through lower interest rates.
14Central Bank Response
Objectives To protect the To preserve the supply To stabilize key To provide an
payments system of credit financial markets economic stimulus
Actions
Temporary liquidity
(repo operations):
Increase in the allotment X X X
counterparties, collaterals and
maturities
Outright purchases of public and
private securities X X X
Reduction of banks’ reserve
X X X
requirements
Auction of FX Non-delivery
Forwards X
Auction of FX Swaps X X X
Reduction of interest rates
X X
15CONTEXT
Content CONDITIONS THAT SUPPORT THE POLICY RESPONSE
ECONOMIC FORECASTS
POLICY CHALLENGES• The Central Bank’s staff estimates a growth rate between 2.0% and 6.0% for 2021. The latest point estimate
for growth in 2021 is 5.2%
• The shock has both supply and demand effects. The impacts on the latter have prevailed, which can be
seen in the large negative output gap.
• Gradual convergence of economic activity toward pre-pandemic levels is expected. Output is estimated to
reach pre-pandemic levels in 2022.
%
GDP Annual Growth Rate 2 Output gap*
8
6,0 0 0
6 6,0
4
2,0 -2
2 2,0 -2,5
0
-2
%
-4
-4
-5,0
-6 -5,0
-6,8 -6
-8 -7,0 -6,5
-10
-12 -8
2015 2016 2017 2018 2019 2020 2021 2022 2015 2016 2017 2018 2019 2020 2021 2022
17
Source: Banco de la Republica – Monetary Policy Report Jan 2021. *Difference between the observed GDP and potential GDP obtained from the 4GM model.• The labor market has partially recovered, but it keeps showing significant slack.
• Forecasts from the Central Bank’s staff suggest that the unemployment rate will continue falling
at a moderate pace throughout 2021.
Unemployment Rate Forecast for the National Unemployment Rate
%
30
25
20
16,6%
15
%
14,5%
10
5
0
ago.-16
ago.-17
ago.-18
ago.-19
ago.-20
feb.-16
nov.-16
feb.-17
nov.-17
feb.-18
nov.-18
feb.-19
nov.-19
feb.-20
nov.-20
feb.-21
may.-16
may.-17
may.-18
may.-19
may.-20
National 13 Metropolitan areas
18
Note: seasonally adjusted series.
Source: DANE; calculations by Banco de la República.• Because of the demand shock and price relief measures, in 2020 inflation was below the Central
Bank’s target. Inflation should converge to the 3.0% target in the next two years
Headline Inflation
7 (Annual change)
6
5
4
3,0 3,5
%
3
2 1,6 2,0
1 1,5
0
2015 2016 2017 2018 2019 2020 2021 2022
19
Source: Banco de la República – Jan 2021 Monetary Policy Report.• Given the sizeable excess capacity and projected core inflation below target, the central bank has set an
expansionary monetary policy stance.
• Due to the unprecedented nature of the shock and the variable external context, the macroeconomic
forecast and monetary policy response are very uncertain.
Monetary Policy Rate
10%
9%
8% 7,75%
7%
6%
5% 4,25%
4%
3%
1,75%
2%
1%
0%
20
Source: Banco de la República• In 2020, the external deficit contracted, in line with a lower domestic demand.
• Domestic demand is expected to recover in 2021…
• ... Hence, although in 2021 global recovery will support a higher external demand and better
terms of trade, the current account deficit is expected to increase slightly.
Current Account
(% of GDP)
0
-1
-2
-3 -3,1
-3,3 -3,3 -3,3
%
-4 -3,9
-4,2 -4,3
-5
-5,2
-6
-6,3
-7
2012 2013 2014 2015 2016 2017 2018 2019 2020
21
Source: Banco de la RepúblicaCONTEXT
Content CONDITIONS THAT SUPPORT THE POLICY RESPONSE
ECONOMIC FORECASTS
POLICY CHALLENGES• The Central Bank of Colombia has adopted a gradual approach in its monetary easing,
providing a sustainable level of stimulus to support the recovery. There is high uncertainty
regarding:
– The relative size and evolution of aggregate supply and demand effects caused by the pandemic.
– External financial conditions. Expected inflation and the effects of fiscal policy in the U.S. may alter financial conditions.
Foreign Participation in the local Currency Bond
Slope of the U.S. Treasuries Curve
Markets
1,8
(Foreign holdings as a percentage of outstanding )
1,6 60%
1,4
50%
1,2
Percentage points
40%
1,0
0,8 30%
0,6 20%
0,4
10%
0,2
0%
0,0
Mar-15 Mar-16 Mar-17 Mar-18 Mar-19 Mar-20 Mar-21
30 year - 5 year spread 10 year - 5 year spread Brasil Chile Colombia Perú
Source: Arslanalp and Tsuda (2014) and BIS.
23• The pandemic caused a significant increase in the level of public debt. The government has announced a
fiscal adjustment equivalent to 1,5 % of GDP.
• According to the Financial Plan, this adjustment, together with better tax collection, should bring public
debt below 60% of GDP by 2030.
Gross Debt of the National Government
(% of GDP)
70
64,8 65,4 65 64,9 64,3 63,4
65
62,3
61,6
61,1 60,4 59,7
60 59,2
55
50,3
50
49,3
45
40
2018 2019 2020 2021 2022 2023 2024 2025 2026 2027 2028 2029 2030 2031
Source: Ministry of Finance – 2021 Financial Plan
24• The gradual reduction of public debt ratios is important for the operation of countercyclical
monetary policy.
Inflation Expectations** Public Debt (% of GDP) Real Ex-ante Interest Rate
Monetary Policy One-year Two-year
Country* Inflation Rate Two-year Ahead 2019 2020 One-year Ahead
Rate Ahead Ahead
Chile 0.5 2.8 3.0 3.0 27.91 32.81 -2.5 -2.5
Peru 0.25 2.68 2.3 2.5 27.12 39.48 -2.05 -2.25
Mexico 4.0 3.76 3.51 3.50 53.75 65.54 0.49 0.5
Colombia 1.75 1.51 2.87 3.12 50.30 64.80 -1.12 -1.37
Indonesia 3.5 1.38 2.3 3.0 30.49 38.48 1.2 0.5
Hungary 0.6 3.1 3.2 3.2 66.34 77.42 -2.6 -2.6
South Africa 3.5 2.9 4.2 4.4 62.15 78.82 -0.7 -0.9
Brazil 2.75 5.2 4.81 3.51 89.47 101.4 -1.96 -0.76
Turkey 19 15.6 10.5 9.05 32.99 41.67 8.5 9.95
Source: central Banks, IMF and Fitch Ratings. 25
*Countries are ordered according to their credit rating. Green are all A-rated countries (A+, A and A-), Pink are all BBB countries, purple are all BB and red are B-rated´.
** Inflation expectations are based on surveys. Inflation expectations: México. Brasil. Chile. Perú. Turquía. Sudáfrica, Hungría, Colombia). Inflation expectations for Indonesia are for year-end 2021 and year-end 2022,
they are taken from FocusEconomics' consensus forecast.• In line with the economic slowdown, deterioration of the loan portfolio is expected.
• Banking institutions have increased their provisions in order to manage this risk.
Non-performing loans - Annual Growth Rate Provisions over non-performing loans
80% 2,5
60%
2
40%
1,5
20%
0%
1
-20%
0,5
-40%
-60% 0
Sep-18
Sep-20
Sep-16
Sep-17
Sep-19
Sep-17
Sep-18
Sep-19
Sep-16
Sep-20
Mar-16
Mar-17
Mar-18
Mar-19
Mar-20
Jun-16
Jun-18
Jun-20
Jun-17
Jun-19
Dec-15
Dec-16
Dec-17
Dec-18
Dec-19
Dec-20
Mar-16
Jun-16
Mar-17
Jun-17
Mar-18
Jun-18
Mar-19
Jun-19
Mar-20
Jun-20
Dec-15
Dec-16
Dec-17
Dec-18
Dec-19
Dec-20
Total Commercial Consumption Mortgages
Source: Office of the Financial Superintendent. Calculations by Banco de la República.
26• Despite of this, solvency and liquidity levels of financial intermediaries remain above regulatory
limits.
Liquidity Risk Indicator (LRI) Solvency Ratio of Credit Establishments
500 20
450 18
17,21
400 16
350 14
300 12
10 Regulatory minimum
250
221,63
200 8
150 6
Regulatory minimum
100 4
2 Solvency ratio= Tier 1 capital / Risk weighted assets
50
IRL = liquid assets / net liquidity requirements over 30 days
0 0
jun-16
jun-19
jun-17
jun-18
jun-20
mar-17
mar-20
mar-16
mar-18
mar-19
dic-17
dic-20
dic-15
dic-16
dic-18
dic-19
sep-18
sep-16
sep-17
sep-19
sep-20
jun-17
jun-19
jun-16
jun-18
jun-20
sep-16
sep-18
sep-20
sep-17
sep-19
mar-16
mar-17
mar-18
mar-19
mar-20
dic-15
dic-16
dic-17
dic-18
dic-19
dic-20
27
Source: Office of the Financial Superintendent. Calculations by Banco de la República.• And, despite the size of the macroeconomic shock, financial intermediation has continued
smoothly.
• The growth of the loan portfolio has decelerated but remains positive in nominal and real
terms.
Commercial Loan Portfolio Consumption Loan Portfolio
18% 180 18%
COP trillion
COP trillion
290
16% 160 16%
270 14% 140 14%
12% 120 12%
250
10% 100 10%
230 8% 80 8%
6% 60 6%
210
4% 40 4%
190
2% 20 2%
170 0% 0 0%
sep.-18
sep.-19
sep.-20
sep.-17
nov.-17
nov.-18
nov.-19
nov.-20
ene.-17
ene.-18
ene.-19
ene.-20
ene.-21
jul.-20
jul.-17
jul.-18
jul.-19
mar.-17
mar.-18
mar.-19
mar.-20
may.-17
may.-18
may.-19
may.-20
may-17
may-18
may-19
may-20
nov-19
nov-20
sep-17
nov-17
sep-18
nov-18
sep-19
sep-20
ene-17
ene-18
ene-19
ene-20
ene-21
jul-17
jul-18
jul-19
jul-20
mar-17
mar-18
mar-19
mar-20
Balance Annual Growth rate Balance Annual Growth rate
Source: Office of the Financial Superintendent. Calculations by Banco de la República.
28You can also read


