China-US Trade Conflict: Causes and Impact - Ha Jiming June 11, 2018
←
→
Page content transcription
If your browser does not render page correctly, please read the page content below
2018 CF40-PIIE Joint Report

China-US Trade Conflict: Causes and Impact

                Ha Jiming
                June 11, 2018

                                                         1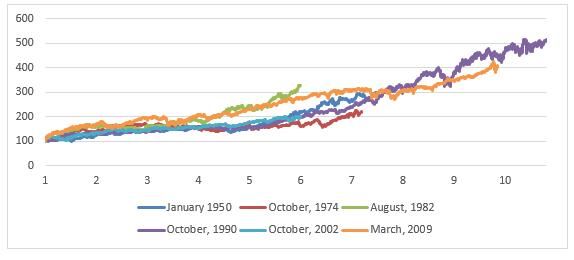
I. Background of China-US trade conflict
       1. Comparison of real GDP growth between China                            2. Contribution of China and the US to world
       and the US in different periods                                           economy in different periods

  %                     China(since 1953)     The US                         %                      The US   China
  10                                                   9.3
                                  9.1                                        40
   9                                                                                                                       35.6
                                                                             35
   8
                                                                                         29.1
                                                                             30
   7        6.3
   6                                                                         25

   5                                                                         20
                  3.9
   4
                                        3.2                                  15
   3                                                                                            9
                                                             2.0             10                                      7.4
   2
                                                                               5
   1
   0                                                                           0
           1950-1977             1978-1999             2000-2017                           1990s                     2008-2016

1. Since 1950s, the US economic growth has been slowing down, while China’s economic growth has been continuously increasing.
According to World Bank, China’s economy could surpass the US in terms of total volume becoming the largest economy in the world
in 2031, if the average economic growth of the US remained at 2% and China at 6% since 2018.

Source:Research on China-US trade conflict——”China-US Trade Conflicts: Factual Background and Analysis”,Wind,World Bank

                                                                                                                                   2
I. Background of China-US trade conflict(continued)
2. The US released the ‘Status of Non-Market Economy’ report on China questioning China’s economic system.
The government controls fundamental economic factors like land and other resources either directly or indirectly, and
state-owned enterprises have control over many economic resources through administrative monopoly.
Pricing mechanism is still limited in many sectors.
Effectiveness of protection on private property rights is still insufficient.
The government is taking various industrial policies as measures to realize diversified goals such as technology
upgrade.
3. China promoted the “Made in China 2025” program.
4. The US called China its “strategic rival” in its National Security Strategy report in 2017.
5. Heightening contradiction among different social classes in the US
The Gini Coefficient of the US has risen from around 0.4 in 1970s to the current around 0.48, indicating a
widening gap between the rich and the poor. The falling of the Rust Belt has triggered anxiety among local
residents, while American mainstream media attributed the reason for the falling of Rust Belt to globalization
and foreign competition, which has speeded up America’s foreign policy shift.
6. The moderate politicians (Cohn,Tillerson) resigned, while Hawkish politicians (Navarro, Lighthizer,
Kudlow,Pompeo,Bolton) were appreciated.
7. Creating trade conflicts with China could benefit the Republican in mid-term election.
Source: Research on China-US trade conflict——”China-US Trade Conflicts: Factual Background and Analysis” ,public files
3II. Main Causes of China-US Trade Imbalance
1. Percentage of China’s current account surplus in 2. Shares of US trade deficit in goods by
GDP declined until 2017 country
Others
9%
12% percentage of current account in GDP: season India
percentage of current account in GDP: year Malaysia3%
10% 3%
Italy
8% 4%
Ireland
6% 5% China
46%
4% Vietnam
5%
2%
Germany
0%
8%
-2%
2000 2002 2004 2006 2008 2010 2012 2014 2016
Japan
8% Mexico
9%
China’s current account has remained roughly balanced, with its balance occupying 9.9% of
GDP at peak in 2007, and declining to 1.4% in 2017.
The US trade deficit with China is still high, and 46% of total US deficit was with China in
2017, while 44.3% of total deficit was with the rest seven countries.
Source: Wind
4II. Main Causes of China-US Trade Imbalance
- Following the collapse of the Bretton Woods system, the US trade deficit began to rise
1. US trade deficit-to-GDP ratio and gold prices
trade deficit-to-GDP ratio prices of gold(right) US Dollar/Ounce
2% 1800
1% 1600
1400
0%
1200
-1%
1000
-2%
800
-3%
600
The USD decoupled
-4% from the gold in 1971. 400
-5% 200
-6% 0
1960
1962
1964
1966
1968
1970
1972
1974
1976
1978
1980
1982
1984
1986
1988
1990
1992
1994
1996
1998
2000
2002
2004
2006
2008
2010
2012
2014
2016
US trade in goods has registered a continuous deficit since 1975Under the Bretton Woods system, the dollar was convertible
into gold; in this context, US deficit in foreign trade led to monetary contraction and then lower demand. In turn, this
suppressed imports and promoted exports. As a result, a self-correcting mechanism was formed and the trade deficit shrank.
However, since the US dollar was decoupled from gold in 1971, the US has been able to pursue its monetary policy freely, and
the above-mentioned self-correcting mechanism has disappeared.
Dollars earned in trade surplus countries are then channeled back to the US and support American purchases of foreign goods.
5II. Major causes of the China–US trade imbalance
—Upgrade of “world factory” export
1.China’s deficit with other countries until 2017 2. China’s share in US trade deficit in goods
%
The US EU Japan
80
East Asia South Korea South Africa
Brazil Australia 70
3000 60
2500
100 million US dollar
50
2000 40
1500
30
1000
500 20
0 10
-500 0
-1000 2000 2005 2008 2009 2010 2011 2015
-1500
traditional measures value added measures
2000
2001
2002
2003
2004
2005
2006
2007
2008
2009
2010
2011
2012
2013
2014
2015
2016
2017
traditional/ value-added
While China has surplus with Europe Union and the US, it has deficit with other countries, which can show the pattern of global industrial
chain. China imports intermediate products and export final products, and the data over estimated China’s surplus with EU and the US.
Considering the high percentage of processing trade in China’s total trade, China’s trade surplus amounts to one third, which is still very
high. China-US trade deficit measured by traditional/ value-added method has risen up from around 40% in 2000 to today’s 70%,
indicating an upgrade of China’s export.
Currently, US trade deficit with China is still high, but the added-value in China’s export is increasing gradually, which shows
improvement of China’s industrial chain and industrialization, and great achievement that has been made during the process of
transformation and upgrading of China’s industrial structure.
Source:: OECD,Goldman Sachs,Wind
6II. Major causes of the China–US trade imbalance
—difference in savings rates
1. Average national savings rates and trade 2. Share of China’s working population and
balance to GDP ratios (2007–2016) China’s savings rates
% % %
% National savings rate trade deficit-to-GDP ratio(right) 75 55
60 25 74 CF40 prediction in
red 50
73
50 20 IMF prediction in
72 green
45
40 71
15
30 70 40
10 69
20 35
68
5
10 67
30
0 0 66
65 25
-10 -5
2000
2001
2002
2003
2004
2005
2006
2007
2008
2009
2010
2011
2012
2013
2014
2015
2016
2017
2018
2019
2020
2021
2022
share of China's working population saving rate(right)
Savings rate is an important factor to a country’s trade balance.
International comparisons suggest that a country’s savings rate is highly correlated with its foreign
trade balance. Countries with high savings rates usually have a trade surplus.
Savings rate is also high correlated with labor population. China’s labor population reached peak in
2010, then decreased, and the savings rate also declined following that.
Source:World Bank,IMF,Wind
7III. Impact on the Chinese economy
1. US imports from China, by product
Industrial impact: The US announcement of 25% tariff on products worth US$50 billion on
March 22 would largely affect industries linked to the “Made in China 2025” strategy in mid-
and-long run. An additional tariffs on products worth US $100 billion could have impact on
consumer goods and labor-intensive industries.
Source:UN Comtrade
8III. Impact on the Chinese economy (continued)
We can assess the impact on China’s economy through hypothetic scenarios:
In a normal scenario, it would cost a 0.1 percentage point of China’s GDP
growth in the short term. The US imposes 25% and 10% tariffs on imports of China’s
steel and aluminum, respectively, and executes the 301 investigation against China,
which is to impose 25% tariffs on Chinese products worth US $ 50 billion.
In the worst scenario, This is likely to cost a 0.8 percentage point of China’s
GDP growth rate. mutual sanctions between China and the US could result in a
US$100 billion reduction in China’s trade surplus with the US.
In the superior scenario, expanding imports and opening the service will boost
China’s consumption and effectively reduce China’s trade surplus with the US.
Source:Public files
9III. Impact on the Chinese economy (continued)
—expanding imports to meet consumption demand
1. Percentage of household 2. Percentage of imports of consumer goods
3. Outbound tourist expenditure of
consumption in GDP of major in GDP and household consumption
China and other countries
countries
80% Chinese tourists Other countries
69% China The US Malaysia
70% 63% 63%
59% 10% 9.5% 35%
60% 56% 54% 53%
48% 9% 29%
30%
50% 8%
39% 25%
40% 7% 25%
30% 6% 5.3% 19% 18%
4.4% 20%
5% 15% 16%
20%
4% 3.1% 3.2% 15%
10% 3%
0% 1.3% 10%
2%
1% 5%
0%
Import of consumer Import of consumer 0%
goods/GDP goods/consumption Shopping Accomodation Dining
Chinese household consumption accounted for 39% of GDP in 2016, much lower than in other major
economies.
China’s imports of consumption goods was 3.2% of household consumption or 1.3% of GDP, far
lower than countries like the US and Malaysia, due to high tariff rates and distribution costs.
Chinese consumers crave for foreign goods, as evidenced by strong shopping capacities of Chinese
tourists.
Source:Wind,2017 Outbound Chinese Tourism And Consumption Trends
10III. Impact on the Chinese economy (continued)
—High-tech imports and FDI
A regression analysis of factors behind China’s GDP growth:
11IV. Impact on the US economy
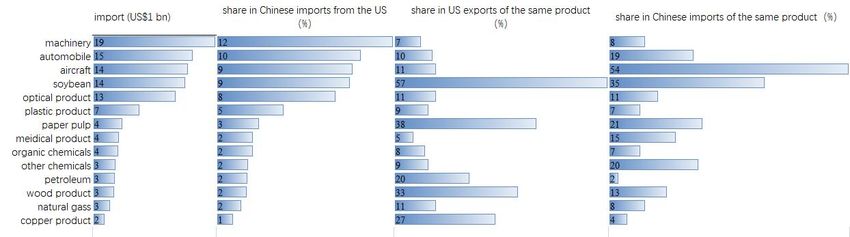
1. China’s imports from the US, by product
Among China’s imports from the US, machinery, aircraft, automobile, and soybean are the largest items.
China might increase agricultural and energy imports from the US.
China’s approach of “self-promotion of imports” contrasts 1980s Japan’s “self-restraint of exports”.
Source:UN Comtrade
12IV. Impact on the US economy —increase inflation rate
1. The US inflation rate and expected data
%
2.2 Annual PCE expected
by Federal Reserve
2.0
2.0 2.0
1.9
1.8
1.6
1.5 Source:Wind
1.4
1.2
1.0
2017-4 2017-5 2017-6 2017-7 2017-8 2017-9 2017-10 2017-11 2017-12 2018-1 2018 2019 2020
Increase inflation rate
Robust economic and employment growths have already pushed up inflation and core PCE has been going
up since the later half of 2017. The Fed has expected the core PCEs for 2018 and 2019 would reach 1.9 and
2.0 respectively. Meanwhile, improvement of employment on the US job market has begun to push up
wages, and the tariff can further increase inflation.
13IV. Impact on the US capital market and economic growth
1. The current bull market is the second 2. Comparison of household asset structure in China and the US
longest after WWII China The US
Composition of household assets (%, sum=100%)
Non-financial assets 6 6
base price:100
Real estate 54 24
Financial assets 41 71
Composition of household financial assets (%, sum=100%))
Cash and savings 75.7 14.4
Stock shares 15.5 21.7
Wealth management
Starting time of
products of banks and 6.5 10.2
funds
bull market :
Insurances - 28.9
Others 2.3 24.8
• Impact on stock market and household fortune
If a trade war were ignited, high inflation rate would force the Fed to increase interest rate, which would frustrate the stock price and housing price. The
US stock and commercial real estate market have increased by 4 times and 87% respectively since 2009, the bull market period is the second longest
one since the Second World War (slightly lower than the IT boom period in 2000), and the stock valuation is higher than other 90% periods in American
history. Impact of increase in interest rate on enterprises investment cost and solvency, and the impact of price increase and asset price fluctuation on
household consumption can constraint economic growth and even put the US economy back into recession after 9 years’ growth.
The MSCI US index shows that about 70 US listed companies—with a combined market value taking up 9.2%—of the index, generate more than 10% of
their total revenue from the Chinese market. In contrast, the MSCI China Index shows that around 30 companies generate more than 10% of their
revenue from the US market, with a total market value of only 2% of the index.
A survey of household financial assets in China and the US shows that the share of equity assets to total household assets in the US is much higher than
in China.
Source:Wind,US Federal Reserve, ‘China Household Finance Survey 2017’,Morgan Stanley
14Summary
• The China-US trade dispute is a long-term issue, and perhaps
an epitome and harbinger of a broader changing bilateral
relationship.
• However, there is still huge potential for trade and investment
cooperation, considering the strong complementarity of the
two economies.
• The two countries have responsibility to maintain the stability
of global trade system, and should solve trade conflict through
multilateral mechanism. No one wins a trade war.
15You can also read


