VARTA AG 1H 2019 Earnings Presentation August 6, 2019
←
→
Page content transcription
If your browser does not render page correctly, please read the page content below
VARTA AG
1H 2019 Earnings Presentation

August 6, 2019
                                Companies of VARTA AG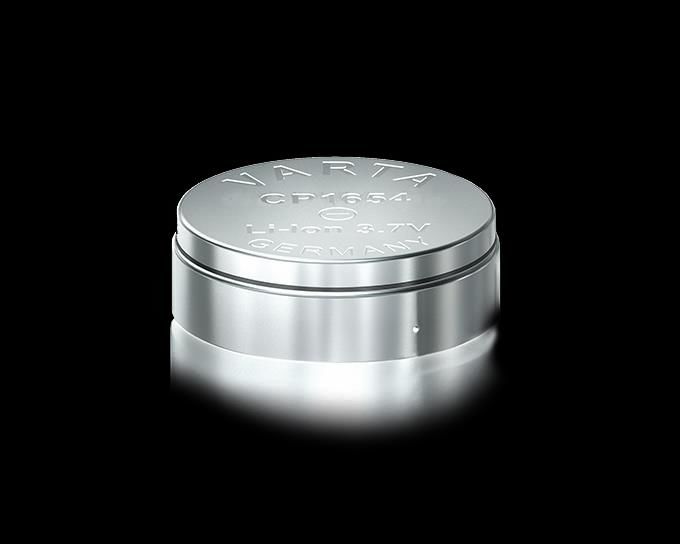
Disclaimer
  Forward-Looking Statements
  This document has been prepared solely by VARTA AG (“VARTA”) and it and the presentation to which it relates contains confidential
  information relating to VARTA AG and is being given to you on a confidential basis. The information is for information purposes only and may
  not be redistributed, reproduced, published, or passed on to any other person or used in whole or in part for any other purpose.
  Certain information in this presentation is based on management estimates. Such estimates have been made in good faith and represent the
  current beliefs of applicable members of management. Estimates may not be correct or complete. Accordingly, no representation or warranty
  (express or implied) is given that such estimates are correct or complete.
  Certain statements contained herein may be statements of future expectations and other forward-looking statements that are based on
  VARTA’s current views and assumptions and involve known and unknown risks and uncertainties that may cause actual results, performance
  or events to differ materially from those expressed or implied in such statements. No one undertakes to publicly update or revise any such
  forward-looking statement. Neither VARTA and its advisers, personally liable partners, employees or affiliates nor any other person shall
  assume or accept any responsibility, obligation or liability whatsoever (in negligence or otherwise) for any loss howsoever arising from any
  use of this presentation or the statements contained herein as to third person statements, any statements of future expectations and other
  forward-looking statements, or the fairness, accuracy, completeness or correctness of statements contained herein. In giving this
  presentation, VARTA does not undertake any obligation to provide the recipient with access to any additional information or to update this
  presentation or any information or to correct any inaccuracies in any such information.

  Non-IFRS Financial Measures
  This presentation contains certain financial measures (including forward-looking measures) that are not calculated in accordance with IFRS
  and are therefore considered as “Non-IFRS financial measures”. The management of VARTA believes that the Non-IFRS financial measures
  used by VARTA, when considered in conjunction with (but not in lieu of) other measures that are computed in accordance with IFRS,
  enhance an understanding of VARTA's results of operations, financial position or cash flows. These Non-IFRS financial measures should not
  be considered in isolation as a measure of VARTA's profitability or liquidity, and should be considered in addition to, rather than as a
  substitute for, net income and the other income or cash flow data prepared in accordance with IFRS.
  In particular, there are material limitations associated with our use of Non-IFRS financial measures, including the limitations inherent in our
  determination of each of the relevant adjustments. The Non-IFRS financial measures used by VARTA may differ from, and not be
  comparable to, similarly-titled measures used by other companies.
  Certain numerical data, financial information and market data (including percentages) in this presentation have been rounded according to
  established commercial standards. As a result, the aggregate amounts (sum totals or interim totals or differences or if numbers are put in
  relation) in this presentation may not correspond in all cases to the amounts contained in the underlying (unrounded) figures appearing in the
  consolidated financial statements. Furthermore, in tables and charts, these rounded figures may not add up exactly to the totals contained in
  the respective tables and charts.

Companies of VARTA AG                                                                                 Our Brands                                    2
Executive Summary
Further accelerating the high pace of revenue and earnings growth –
delivered very strong 1H results, further improving the profitability:
Revenue +16%... Adj. EBITDA +55%... Adj. EBITDA margin at 24.6% (+6,2PP)
Microbatteries with exceptionally strong 2Q and 1H results:
Entertainment is booming and is growing significantly faster than the market –
Healthcare is growing faster than the market
Power & Energy continues to trend in line with expectations:
Revenue increased sequentially, with 2H stronger than 1H –
Adj. EBITDA margin at 6.1%, in line with the mid-term margin target of 6-8% of revenue
Further expansion of the production capacities for lithium-ion batteries to >100m
cells p.a. by 2021 – financed by a capital increase from authorized capital
VARTA AG acquires VARTA Consumer Batteries business from Energizer
Raising again the revenue and Adj. EBITDA guidance for FY19:
Revenue: ~€320 to 330m (previously: €310 to 315m), up ~18-21% YoY*
Adjusted EBITDA: ~€72-76m (previously: 64-67m) , up ~43-51% YoY*
* 2019 guidance assumes constant FX and organic growth
Companies of VARTA AG Our Brands 3Business Highlights
We continue to execute our profitable growth strategy
Market for lithium-ion batteries continues to grow very rapidly (CAGR: >30%)
Rapidly Growing significantly faster than the market – as the technology & innovation
growing leader, we are benefiting the most from the structural shift to coin-shaped cells
entertainment On track to achieve the #1 market position, with a market share of ~50% by 2020
end-market Further expanding the production capacity to >100m cells p.a. by end of 2020
Strong sales visibility – design-in projects with all premium headset manufacturers
Growing faster than the market in hearing aid batteries
Attractive Market need for smaller rechargeable hearing aid devices in combination with
exposure to longer hearing time strengthens VARTA’s leading-ledge technology position
the healthcare Gaining market share in primary hearing aid batteries – won the largest mass retail
end-market account for hearing aid batteries thanks to our innovative Evolution series
Accretive Complementary acquisition, with business characteristics comparable to the
Consumer healthcare business
acquisition Gaining access to the attractive, but underpenetrated mass retail channel
with strong Consolidating the VARTA trademark rights under the roof of VARTA AG
FCF Superior free cash flow generation due to modest capital requirements
generation Highly accretive acquisition, with attractive cash returns of >20%
Companies of VARTA AG Our Brands 4Financial Highlights 1H 2019
Delivered very strong 2Q and 1H results –
further accelerating the high pace of revenue and earnings growth:
2Q: Revenue +21%... Adj. EBITDA +74%... Adj. EBITDA margin at 25.4% (+7,7PP)
1H: Revenue +16%... Adj. EBITDA +55%... Adj. EBITDA margin at 24.6% (+6,2PP)
Microbatteries with exceptionally strong 2Q and 1H results:
2Q: Revenue +25%... Adj. EBITDA +71%... Adj. EBITDA margin at 29.5% (+7,9PP)
1H: Revenue +19%... Adj. EBITDA +53%... Adj. EBITDA margin at 28.3% (+6,3PP)
Power & Energy continues to trend in line with expectations –
Revenue +4% (Q2: +7%) – Adj. EBITDA at 6.1%, in line with the mid-term target
CAPEX were at 20.0 Mio. EUR, continuing to massively expand the production
capacity in lithium-ion-batteries – executing the investment program flawlessly
Successfully concluded a capital increase with gross proceeds of ~€104m to
finance the expansion of production capacities for lithium-ion batteries to >100m
cells p.a. by 2021
Companies of VARTA AG Our Brands 5Financial Performance 1H 2019
Revenue Adjusted EBITDA Net Income
(€ m) (€ m), margin in % of revenue (€ m)
+16%
151.5
130.8*
+55%
37.2 +49%
19.5
24.1*
13.1*
18.4% 24.6%
Margin Margin
1H 2018 1H 2019 1H 2018 1H 2019 1H 2018 1H 2019
* Changes to the previous year's figures due to conversion to IFRS 15
Companies of VARTA AG Our Brands
Brands 6Financial Performance 1H 2019 (continued)
Net Working Capital (NWC) CAPEX Free Cash Flow
(€ m), in % of LTM revenue (€ m) (€ m)
-32%
42.0
-1.9
21.9
28.5 20.0
+11,7
-4,7
15.4% 9.8%
Revenue Revenue -16,4
Dec 2018 June 2019 1H 2018 1H 2019 1H 2018 1H 2019
Companies of VARTA AG Our Brands
Brands 7Microbatteries – 1H 2019 Highlights
(€ m) 1H 2018 1H 2019 YoY Change
Revenue 106.1* 126.2 +18.9%
Adjusted EBITDA 23.3* 35.7 +53.2%
Adjusted EBITDA Margin 22.0% 28.3% +6.3PP
Highlights:
Microbatteries recorded very strong Q2 and H1 results –
the strongest revenue and adj. EBITDA in a quarter ever
The Entertainment business is growing significantly faster than
the market, which is growing more than 30% per year, with
VARTA benefiting the most from the shift to coin-shaped cells
Healthcare is growing faster than the market, gaining market
share in primary batteries and benefiting from the trend to
rechargeable hearing aids
Rechargeable lithium-ion coin cell
Adj. EBITDA margin at 28.3%, an improvement of 6.3 PP – for premium true wireless
key drivers: operating leverage, economies of scale and a headsets
favorable margin mix effect from Entertainment
*Changes to the previous year's figures due to conversion to IFRS 15
Companies of VARTA AG Our Brands
Brands 8Power & Energy – 1H 2019 Highlights
(€ m) 1H 2018 1H 2019 YoY Change
Revenue 24.1* 25.0 +3.6%
Adjusted EBITDA 1.4* 1.5 +12,4%
Adjusted EBITDA Margin 5.6% 6.1% +0.5PP
Highlights:
Power & Energy continues to trend in line with expectations
Q2 revenue increased by 13% sequentially vs. Q1, and was up
6,5% Y/Y in 2Q – 2H expected to be stronger than 1H
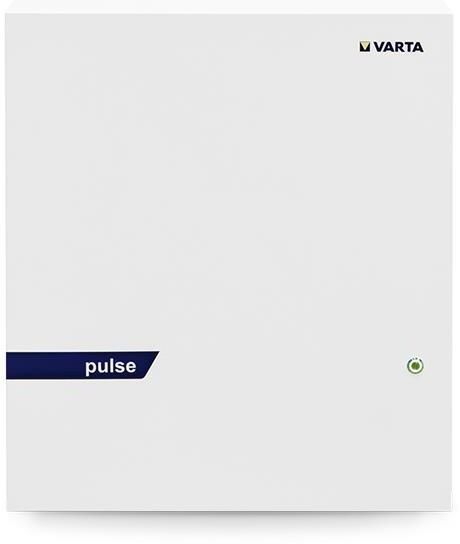
Energy storage solutions keeping up the solid growth
momentum, particularly in residential storage
Project-driven battery pack business with a softer 1H –
revenue in 2H stronger than in 1H due to the ramp-up of new
customer projects, with backlog already in place to deliver it
Wall mounted energy storage
Delivered a positive Adj. EBITDA margin of 6.1%, in line with system for private households
the mid-term margin target of 6-8% of revenue
*Changes to the previous year's figures due to conversion to IFRS 15
Companies of VARTA AG Our Brands
Brands 9Raising again the revenue and Adj. EBITDA
guidance* for FY19
• Revenue: ~ €320 to 330m (previously: ~€310-315m), up ~18-21% YoY*
• Adjusted EBITDA: ~€72-76m (previously: ~€64-67m), up ~43-51% YoY*
VARTA AG
Group • CAPEX: ~€75-90m (previously: ~65-75m) – continuing to expand the
production capacity in lithium-ion batteries (CoinPower) to 80m cells p.a.
by 2020 and to more than 100m cells p.a. by end of 2020
• Revenue: Clear double-digit growth – significantly outpacing the market
growth
Segment
Microbatteries • Adjusted EBITDA: Very strong Adj. EBITDA growth, with a significantly
faster growth rate than the revenue
• Revenue: Double-digit growth – in-line with the market growth
Segment • Adjusted EBITDA: Significant positive Adjusted EBITDA, in-line with the
Power & Energy mid-term margin target of 6-8% of revenue
* 2019 guidance assumes constant FX and organic growth
Companies of VARTA AG Our Brands 10Summary
Further accelerating the high pace of revenue and earnings growth –
delivered very strong 1H results, further improving the profitability:
Microbatteries with exceptionally strong 1H results
Entertainment is booming and is growing significantly faster than the market –
Healthcare is growing faster than the market
Power & Energy continues to trend in line with expectations
Further expansion of production capacities for lithium-ion batteries to
more than 100 m cells p.a. by end of 2020
Raising again the revenue and Adj. EBITDA guidance for FY19:
Revenue: ~€320 to 330m (previously: €310 to 315m), up ~18-21% YoY*
Adjusted EBITDA: ~€72-76m (previously: 64-67m) , up ~43-51% YoY*
* 2019 guidance assumes constant FX and organic growth
Companies of VARTA AG Our Brands 11Contact Investor Relations Financial Calendar Bernhard Wolf 29.10.2019 Interim statement Q3 2019 Head of Investor Relations Daimlerstraße 1 73479 Ellwangen Phone: +49 79 61 921 969 E-Mail: bernhard.wolf@varta-ag.com Companies of VARTA AG Our Brands 12
VARTA AG – SELECTED GROUP KEY
FIGURES

                        (in EUR million)                                          H1 2019       H1 2018
                        Sales Revenue                                               151.5        130.8*
                        EBITDA                                                        35.9         23.1*
                        Adjustments:
                        Cost of share-based payment                                    1.4           1.0
                        Adjusted EBITDA                                               37.2         24.1*
                        Adjusted EBITDA Margin (%)                                  24.6%        18.4%
                        Consolidated result                                           19.5         13.1*
                        Investments (Capex)                                           20.0         21.9
                        Free Cash Flow                                                 -4.8        -16.4
                        Equity ratio (%)                                            66.3%       64.6%**
                        Balance sheet total                                          576.3       401.7**
                        Staff (as of June 30)                                        2,394        2,244

                        * Changes to the previous year's figures due to conversion to IFRS 15
                        ** as per 31.12.2018

Companies of VARTA AG                                                                                 Our Brands   13
Consolidated income statement for the
period 01/01/-06/30/2019
(in EUR thousand) 2019 2018
Sales revenue 151,517 130,791*
Decrease/Increase in finished and
3,506 3,035
unfinished goods
Own work capitalized 8,330 1,504
Other operating income 3,685 3,347
Cost of materials -57,928 -50,998*
Personnel expenses -52,520 -45,404
Other operating expenses -20,740 -19,165
EBITDA 35,850 23,110*
Depreciation and amortization -8,059 -5,077
Operating earnings (EBIT) 27,791 18,033*
Financial income 128 56
Financial expenses -390 -207
Other financial income 40 511
Other financial expenses -459 -405
Financial result -681 -45
Profit and loss shares in companies
recognized in the balance sheet under -6 31
the equity method
Earnings before taxes 27,104 18,019*
Income tax expenses -7,633 -4,939*
Consolidated result 19,471 13,080
Appropriation of profit:
Shareholders of VARTA AG 19,149 12,780*
Non-controlling interests 322 300
* Changes to 2018 figures due to conversion to IFRS 15
Companies of VARTA AG Our Brands 14Consolidated statement of financial
position as of June 30, 2019 (1/2)
(in EUR thousand) June 30, 2019 Dec. 31, 2018
ASSETS
Property, plant and equipment 171,756 112,803
Intangible assets 20,980 21,174
Long-term investments and other participations recognized in
the balance sheet under the equity method 342 348
Other financial assets 597 359
Deferred tax assets 3,410 1,477
Other assets 17,661 15,670
Non-current assets 214,746 151,831
Inventories 67,090 56,699
Contract assets 1,054 2,370
Trade receivables 32,858 26,345
Tax refund claims 89 549
Other assets 17,111 14,161
Cash and cash equivalents 243,352 149,741
Current assets 361,554 249,865
Total assets 576,300 401,696
Companies of VARTA AG Our Brands 15Consolidated statement of financial
position as of June 30, 2019 (2/2)
(in EUR thousand) June 30, 2019 Dec. 31, 2018
EQUITY AND LIABILITIES
Subscribed capital 40,422 38,200
Capital reserve 250,932 149,374
Revenue reserves 66,443 41,627
Profit/loss for the year 19,149 25,260
Other reserves 3,343 3,535
Equity of the VARTA AG Group 380,289 257,996
Non-controlling interests 1,750 1,426
Equity 382,039 259,422
Lease liabilities (IFRS 16) 18,710 0
Other financial liabilities 6,200 6,200
Provisions for employee benefits 27,243 23,639
Advance payments received 19,610 30,247
Other liabilities 110 93
Other provisions 551 243
Non-current liabilities 72,424 60,422
Tax liabilities 8,091 7,261
Lease liabilities (IFRS 16) 3,719 0
Other financial liabilities 2,797 2,720
Provisions for employee benefits 1,105 1,048
Contract liabilities 8,612 8,435
Trade payables and advance payments received 63,941 35,021
Other liabilities 13,726 11,018
Other provisions 5,590 4,304
Deferred liabilities 14,256 12,045
Current liabilities 121,837 81,852
Liabilities 194,261 142,274
Equity and total liabilities 576,300 401,696
Companies of VARTA AG Our Brands 16Cash flow statement for the
period 01/01/-06/30/2019
(in EUR thousand) 2019/06 2018/06
Cash and cash equivalents as at January 1 149,741 138,536
Cash flow from ongoing business activities 22,652 6,918*
Cash flow from investment activities -27,399 -23,298*
Cash flow from financing activities 98,275 125
Net change in cash and cash equivalents 93,528 -16,255
Effects of exchange rate fluctuations 83 156
Cash and cash equivalents as at June 30 243,352 122,437
• The disclosure of cash outflows from capitalisation of internal labour was adjusted in the previous yearʼs comparative column in
accordance with IAS 8.41 and has been shown in cash flow from investing activities since fiscal year 2019.
Companies of VARTA AG Our Brands 17VARTA AG
1H 2019 Earnings Presentation
August 6, 2019
Companies of VARTA AGYou can also read