Capital Stage AG - Corporate Presentation, March 2017

Page created by Micheal Waters
 
CONTINUE READING
Capital Stage AG - Corporate Presentation, March 2017
Capital Stage AG – Corporate Presentation, March 2017
Capital Stage AG - Corporate Presentation, March 2017
Capital Stage in a nutshell …

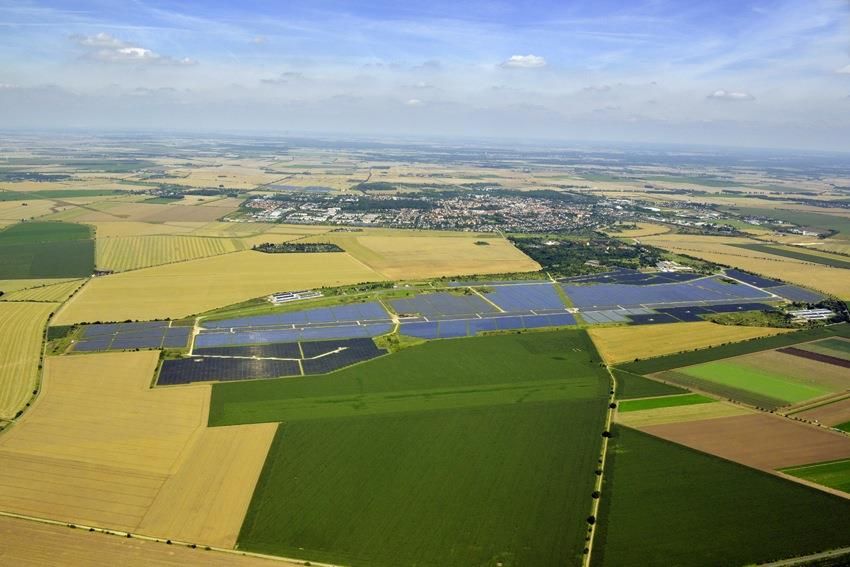
      Germany’s #1 Renewables IPP
     ▪ Operating 204 solar/ wind parks with a total capacity of >1.2 GW
     ▪ Focus on turnkey projects or secondary market projects
     ▪ Active role in market consolidation

      Highly stable & predictable cash flows coupled with attractive returns
     ▪ Guaranteed feed-in-tariffs (FIT) / (PPAs) ensure genuinely stable revenues and attractive returns
     ▪ Attractive risk-return profile by avoiding early project development and commodity price risk
     ▪ Recurring management fees from Asset Management

      High quality installed base
     ▪ Existing parks equipped with quality components from first tier manufacturers ensuring a high quality portfolio
     ▪ 100% subsidiary for the technical management ensures high system availability

      Favourable financing environment
     ▪ Non-recourse loans on project-level
     ▪ Very attractive financing conditions

      Well-filled acquisition pipeline and recurring deal flow
     ▪ Well-filled acquisition pipeline, high visibility and strong reputation on the seller’s market
     ▪ Further expansion of the Asset Management segment for institutional investors

                                                                                                                         2
Capital Stage AG - Corporate Presentation, March 2017
Capital Stage – Key Financials
Significant and steady growth across all dimensions

Revenues (€m)                                       EBITDA (€m)                                        EBIT (€m)

                                                                                                                              +42%
                       +36%                                               +44%

                                        141,8                                               106,1                                    55,4   61,6
                              112,8                                               86,8
                72,1                                               55,4                                               34,6
     57,0                                               35,8                                               21,7

    2013       2014           2015      2016*          2013       2014           2015      2016*           2013       2014           2015   2016*

Balance Sheet Total (€m)                            Equity (€m)                                        Dividend (€)

                                       2.051**                                             553,3**
                       +43%                                                +32%                                               +31%

                                                                                                                                             0,18
                                                                                                                                     0,15
                              1.319                                                                                    0,10
                986                                                243,5          261,6                     0,08
     593                                                207,4

    2013       2014           2015    30.06.2016        2013       2014           2015    30.06.2016       2012       2013           2014   2015

Note: *Preliminary operating figures (Capital Stage full FY2016 and CHORUS 4th quarter 2016); **as of June 30, 2016, the figures have been amended
for the acquisition and consolidation of CHORUS Clean Energy AG (94.4% stake). The figures are to be seen as pro forma.

                                                                                                                                                     3
Capital Stage AG - Corporate Presentation, March 2017
Capital Stage – Guidance 2017
Guidance for the full FY2017

• Full consolidation of CHORUS as of Q4/2016

• Operational KPIs (not including one-time expenses associated with the takeover transaction)

 • Based solely on the existing portfolio as of Dec, 2016

 • Guidance 2017 based on the existing portfolio as of Dec, 2016, further acquisitions may add to revenues and
  earnings

           in €m                      FY2016 (e)                 prelimin. FY2016                 FY2017 (e)*                    yoy in % (e)

 Revenues                                 > 140                         141.8                         > 200                          > +40

 Operating EBITDA                         > 104                         106.1                         > 150                          > +45

 Operating EBIT                           > 60                           61.6                          > 90                          > +50

 Operating Cashflow                       > 98                          103.8                         > 140                          > +40
(e) = expected

Note: Operational KPIs have been adjusted for one-time effects related to the takeover of CHORUS by Capital Stage. These sum up to ~4.6m€
(EBITDA/EBIT) and ~8.5m€ in operating cashflow; Operational figures are solely based on profitability and do not reflect IFRS-related measurement
effects; *Guidance Capital Stage 2016 only incorporates the 4th quarter of CHORUS

                                                                                                                                                    4
Key Investment Highlights
Why invest in Capital Stage?

Market                                           Business Model
• Renewable Energies are a global mega trend     • Buy-and-hold of solar-/wind parks
  with strong growth opportunities
                                                 • Highly attractive risk-return profile due to
• Favorable financing conditions                   support schemes for renewable energy
• Investors seeking highly predictable returns   • Mitigate project development and commodity
                                                   price risk

Market Position                                  Track Record
• #1 renewable IPP in Germany                    • Since 2009 acquired >200 parks
• Among the leading IPPs in Europe               • Installed capacity >1.2 GW
• Balance sheet of 2.5b€ and market cap of       • Balanced portfolio by geography and by
  ~800m€                                           technology
• Dividend CAGR 38% (2011 - 2015)

                                                                                                  5
Market

  Market: Global perspective
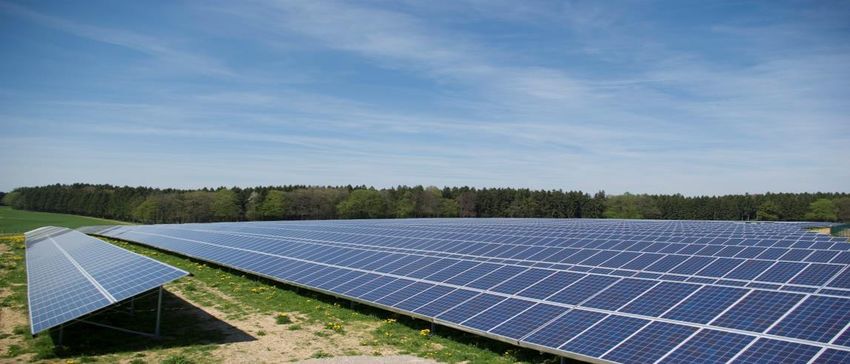
  Renewable Energy is a global mega trend
                                                                                                            Solar PV example
                                                                  Europe

   PV installations
   (GW)
                                                                           89   97
                                                                      82
                                                                 71
                                                           53

                          America                          2011 2012 2013 2014 2015
                                                                                                APAC
                                         31                                                                 96
                                  21
                            14                                                                         36
               6      9                                                                    22    22
                                                                                       8
              2011 2012 2013 2014 2015                                                2011 2012 2013 2014 2015

  Further growth of worldwide PV installations is expected
  Source: Solar Power Europe Global Market Outlook, 2016

                                                                                                                         6
Market

  Market: Generating capacity based on renewable sources
  Strong CAGR in worldwide installed PV/wind generating capacity (in GW)

  2006              80

  2007                   103

  2008                     135

  2009                           173                                                  ▪   Continuous
                                                                                          increase in
  2010                                                                                    worldwide PV/wind
                                                           +26.04%                        generating
  2011                                          293                                       capacities
  2012                                                     373
                                                                                      ▪   Global mega trend
  2013                                                              443

  2014                                                                    527

  2015                                                                          641

             Wind         PV
  Source: IRENA, International Renewable Energy Association, 2016

                                                                                                              7
Business Model

  Business Model: Acquisition strategy
  Conservative acquisition strategy based on solid country analysis
                                                                        selected PV markets

   Investment criteria                                  Risk             Target IRR

   • Low country-specific
     risk
                                                                      5-6%
   • Reliable compensation
     schemes (FITs / PPAs)

   • Professional market
     environment                                                       6-7%

   • Attractive financing
     conditions

   • High quality                                                             8-9%
     components

   • Exclusive access to
     projects
                                                                                >9%

                                                                                              8
Business Model

  Business Model: Asset Management for institutional investors
  The Asset Management portfolio already comprises > 270 MW

      Focus      • Institutional investors such as insurance companies, pension funds, banks, foundations, etc.

    Offering     • Full service portfolio (deal origination, selecting and managing the acquisition, operating the park)

      Basis      • Investment funds on the basis of a special Luxembourg SICAV-funds

   Financials    • Management fees add > 5m€ of recurring income to revenues

  AM: Managed capacity by geography                                AM: Portfolio by geography and technology
                                                                             UK                       PVSolar
        in MW      Solar          Wind          Combined            Sweden
                                                                Finland       7%                         9%
   Germany           7             134             141                     4%
                                                                 Italy
   France           12              73              85                 3% 5%

   UK                -              18              18
                                                                                        52%
   Italy             7               -               7
                                                                      31%
   Finland           -              13              13       France
   Sweden            -              10              10                                   Germany                91%
                                                                                                                            9
                                                                                                                 WindWind
   Total            26             248             274

                                                                                                                            9
Track Record

  Track Record: Portfolio
  The total installed capacity amounts to > 1.2 GW (as of March 2017)

  Portfolio overview                                  Number of parks
  (MW)
                   Solar         Wind                 160 Solar 44 Wind                1
               Capital Asset Capital Asset    Total
               Stage Mgt. Stage Mgt.
                                                                                  1
   Germany       251        7   183     134    575

   France        202       12    36      73    323
                                                               14 2
   Italy         154        7     6       -    167                        48 26

   UK             88        -     -      18    106

                                                                26 10              3
   Austria         -        -    30       -     30

   Finland         -        -     -      13     13
                                                                            72 1
   Sweden          -        -     -      10     10

   Total         695       26   255     248   1,224

                                                                                           10
Track Record

  Track Record: Balanced Portfolio
  The portfolio spans across key markets in Europe

   Installed capacity by geography            Installed capacity by technology

                                                                                   Installed base
                              FI
                           AT SE
                 UK
                                                                                     1.2 GW
                           3%                       Wind
                      9%     1%
                              1%

        IT
               14%                                  41%                          Average PV park
                                   47%   DE

                                                                          59%        4.5 MW

                     26%

                FR                                                       Solar
                                                                                 Average wind park

                                                                                    11.3 MW

                                                                                                    11
Track Record

   Track Record: Development of installed base
  Creating a leading independent producer of renewable energy with a combined capacity of
  1.2 GW including asset management activities of >270 MW
 MW development of assets

1.200                                                                                                                   1.2 GW

1.000
        Installed capacity in MW

 800                                                                         MW CAGR incl.
                                                                                CHORUS
                                                                          (Q3 2009 – 2016 YTD)
                                                                                 > 170%
 600

 400

 200

   0
                                   2010       2011                 2012               2013               2014             2015   2016   2017

                                          MW Solar Capital Stage   MW Wind Capital Stage     MW Solar CHORUS    MW Wind CHORUS
  Note: For CHORUS based on annual values. Increase in MW has been distributed evenly over the quarters.

                                                                                                                                               12
Market Position

   Market Position: Improved capital market profile
  Capital Stage with higher visibility, improved index rating, and broadened research coverage

    Moving up in the SDAX by free float market cap                                               Creating a more liquid stock
                                                                                                 Trading volume LTM (€m)2

         €m
                       21              22               23                  24          25     225        36                37                38              39            40
        600

        575                                                                                    200
        550
                                                                                               175
        525

        500                                                                                    150

                                                                                                                            VTG

                                                                                                                                              Capital Stage

                                                                                                                                                                            Neuson
                                                                                                        Hamburger

                                                                                                                                                              Gerry Weber

                                                                                                                                                                            Wacker
                                                                                                        Hafen und
                                        Grammer

                                                         Capital Stage

                                                                                        SIXT
                      Hornbach

                                                                         Heidelberger

                                                                                                         Logistik
                                                                          maschinen
                       Holding

                                                                           Druck-

                                        Combined combinations                                                                      Combined companies
                                    Rank in SDAX by free float market cap                                                         Rank in SDAX by trading volume

    • Increased free float market cap and liquidity
    • Improved index ranking in the SDAX
    • Wider research coverage due to increased market capitalization and liquidity

  Source: Deutsche Boerse STOXX Index Ranking (as of 28 February 2017).).                                                                                                            13
Market Position

   Market Position: Improved capital market profile
  One of the largest European listed independent players in the renewables space

    Benchmarking by market capitalization (€m)

                                         Largest listed
                                      renewables player in                   = European listed renewable companies         = European listed developers         = Listed YieldCos
                                     Germany and one of the
                                     largest ones in Europe
              1.024          1.008

                                            790

                                                           670
                                                                         581
                                                                                    497
                                                                                               471
                                                                                                          419        398
                                                                                                                                 350
                                                                                                                                            317           313

                                                                                                                                                                  104

  Source: Company information, Deutsche Boerse, FactSet (as of 09 March 2017).                                                                                                 14
Market Position: Entrepreneurial shareholders

Strong shareholder base

                                  18.3%

                                                                    Albert Büll Beteiligungsgesellschaft & AMCO Service GmbH (Fam. Büll)
                                           6.8%
                                                                    Dr. Liedtke Vermögensverwaltungsgesellschaft GmbH
                                                                    Fam. Kreke (u.a. Lobelia Beteiligungsgesellschaft)
                                            3.4%
                                                                    PELABA Group (Peter Heidecker)
                                          5.5%                      Freefloat
    66.0%

                                                                                                             Market Cap: ~EUR 800m
Note: Primarily based on 21 WpHG reported information; March 2017
                                                                                                             # shares: 126,523,660

                                                                                                                                           15
Market Position

   Market Position: Strong base for future growth

             Basis for future growth
            Organic growth, continue investments in PV and wind parks

            Expansion of Asset Management Business for institutional investors, new business segment

            Entering new markets, e.g. USA, Canada

            Internalising business, technical and commercial management of parks

            Active portfolio Management, utilise market opportunities

            Develop growth
           New technologies, e.g. battery storage

            Financing Strategy
           Combined enterprise with broadened access to new investors and financing instruments, e.g., mezzanine financing

                                                                                                                              16
Executive Board

            Holger Götze, COO
            • Since mid October 2016 COO at Capital Stage AG
            • 2014 until mid October 2016 CEO of CHORUS Clean Energy AG
            • Previously held senior management positions at a German subsidiary of an international bank, a
              leading German leasing company and LHI
            • Since 2012 member of the management of the CHORUS Group

            Dr. Christoph Husmann, CFO
            • Since October 2014 CFO at Capital Stage AG
            • Business Administration at the Westfälische Wilhelms-University of Münster (Dipl.-Kfm.) and the Central
              University of Iowa in Pella / Iowa
            • PhD at the Ruhr-University in Bochum
            • VEBA AG, Controlling
            • STINNES AG and HOCHTIEF AG, Head of Corporate Controlling
            • Member (CFO) and later Chairman of the Management Board of HOCHTIEF Projekt Entwicklung GmbH

                                                                                                                        17
Supervisory Board

     Dr. Manfred Krüper, chairman                                       Dr. Jörn Kreke
     • Until November 2006, member of the board of directors at E.ON    • Since mid 2001, chairman of the supervisory board at
       AG                                                                 Douglas Holding AG
     • Supervisory board mandates (among others): Coal & Minerals       • Previously 35 years as CEO at Douglas Holding AG
Supervisory Board
       GmbH, EQT Partners investment consultancy GmbH; EEW              • Supervisory board mandates, among others: Kalorimeta
                                                                          AG & Co. KG; Urbana Energietechnik AG & Co. KG
       Energy from Waste GmbH

     Alexander Stuhlmann, vice-chairman                                Dr. Cornelius Liedtke
     • Until December 2006, CEO at HSH Nordbank                        • Entrepreneur and co-owner of the B&L Group
     • Until April 2008, CEO at WestLB AG                              • Supervisory board mandates (among others): GL
     • Supervisory board mandates (among others): HCI Capital AG,        Aktiengesellschaft, Dichtungstechnik G. Bruss GmbH
       alstria office REIT-AG, Euro-Aviation Versicherungs-AG            & Co. KG

     Albert Büll                                                         Christine Scheel
     • Entrepreneur and co-owner of the B&L Group                        • Since October 2016 member of the supervisory board
     • Supervisory board mandates (among others): Kalorimeta AG &          at Capital Stage AG
       Co. KG, URBANA Energietechnik AG & Co. KG,                        • Until October 2016 member of the supervisory board at
       Dichtungstechnik G. BRUSS GmbH & Co. KG                             CHORUS Clean Energy AG
                                                                         • Former member of the German parliament

      Peter Heidecker                                                    Prof. Fritz Vahrenholt
      • Since October 2016 member of the supervisory board               • Until January 2014, chairman of the supervisory board
        at Capital Stage AG                                                at RWE Innogy GmbH (previously CEO)
      • Until October 2016 chairman of the supervisory board             • Supervisory board mandates (among others): Aurubis
        at CHORUS Clean Energy AG                                          AG, RADAG and Putz & Partner
      • Founder of the CHORUS GmbH in 1998                                 Unternehmensberatung AG

                                                                                                                            18
Capital Stage share: Dividend
Growing dividend reflects the development of the cashflows in the PV/ wind parks

Dividend (€/ share)

                                               +38%

                                                                                   0,18
                                                                   0,15
                                                0,10
                             0,08
           0,05

           2011             2012               2013               2014             2015

➢ YoY increase in nominal dividend
➢ Offered as a script dividend which leaves full flexibility to investors

                                                                                          19
Capital Stage: Coverage overview

  Institution                             Recommendation                        Date                  Target price

                                                buy                       5 December 2016                € 7.60

                                                buy                         9 March 2017                 € 9.00

                                                buy                         1 March 2017                 €8.00

                                                buy                         9 March 2017                 €8.50

                                             outperform                  21 December 2016                €8.80

                                                buy                       19 January 2017                €7.15

                                             - 3 new coverages by other institutes in preparation -

Source: Bloomberg, Company information.

                                                                                                                     20
Contact

IR Contact
Capital Stage AG
Till Gießmann
Head of IR & PR
Große Elbstraße 59
22767 Hamburg, Germany

fon: +49 (0)40 378 5620
fax: +49 (0)40 378 562 129
Email: IR@capitalstage.com
www.capitalstage.com

The information provided in this document has been derived from sources that we believe
to be reliable. However, we cannot guarantee the accuracy or completeness of this
information and we do not assume any responsibility for it. Capital Stage AG assumes no
liability for any errors or omissions or for any resulting financial losses. Investments in
capital markets, in particular in stock markets and futures markets, are fundamentally
associated with risks and a complete loss of the invested capital cannot be ruled out.
Recommendations provided herein do not represent an offer to buy or sell and are not
intended to replace comprehensive and thorough advice before making a decision to buy
or sell. Copies of the content of this presentation, in particular prints and copies or
publications in electronic media, will only be authorised by written consent from Capital
Stage AG.

  2017/V1                                                                                     21
You can also read