Whole Blood Capacity 14/09/20

Page created by Richard Patel
 
CONTINUE READING
Whole Blood Capacity 14/09/20
Whole Blood Capacity
14/09/20
Whole Blood Capacity 14/09/20
Executive Summary: We have a plan in place to largely restore
collections, though some further action may be required

• Following lock-down, NHSBT has experienced declining blood stocks, primarily driven by NHSBT capacity constraints (vs. donor-side willingness)
  – Social distancing: Over 60% of venues were impacted by social distancing, creating substantial capacity constraints. Even after moving to larger sessions and optimising layouts, social
    distancing constrains our capacity to collect by ~10% in mobile sessions and ~20-30% in fixed centres
  – CVP capacity lending: Social distancing issue was exacerbated by the conversion of WB / CD slots into CVP during the ramp-up period (equivalent to ~24,000 WB slots), which could have been
    used to increase WB stock instead (equivalent to 3-4 extra days of stock)
  – Staffing limitations: During the peak, (1) high staff absence due to sickness / shielding, (2) introduction of COVID triage process staffed by donor carers, and (3) staff movement to CVP lowered
    bookable appointments and increased NHSBT-led cancellations; though many of these issues have been resolved, WB staff ‘gaps’ remain ~6-7 ppts higher than pre-COVID
  – Limited impact – Donor base: National fill rates remained largely stable at ~94% during the peak, suggesting donor-side issues (e.g. reluctance to go to city centres, donors over 70+ being told
    not to donate) were not critical constraint; however, as capacity has been added at short notice in donor centres, recent fill rates have been falling (particularly in donor centres)

• Despite meaningful efforts to increase collections, we are currently in High Amber banding: collections have not been fully restored to pre-COVID levels (still
  ~10% lower), while demand has recovered to a greater extent (~5%-10% lower vs. pre-COVID), suggesting a potential risk for future stock levels

• Our risk levels depend largely on our expectations for blood demand – though it may restore to 100% by end of September, it may also remain slightly lower,
  or perhaps even fall further in the event of a 2nd wave, suggesting both WB and CVP are unlikely to see very strong demand at the same time
  – Low demand scenario – If blood demand stabilises at last 4-week average (~25.4K) we can expect to build stock to stabilize and potentially evert to green by October
  – High-demand scenario – However, if blood demand is entirely restored in September (~26.8K), we can expect stocks to decline and fall into red in October and beyond

• In September, we are stabilising stock levels primarily by borrowing unutilised CVP capacity – but also have an ongoing action plan to boost the resilience of
  our WB capacity on a standalone basis, with identified initiatives expected to restore collections to at least ~95% of pre-COVID levels by December

• To further build resilience and restore collections to 100%, we are scoping out additional initiatives (e.g. new centres, expanding programmes of mobile
  teams); since recruiting / training may be rate limiting factor for some of these initiatives, we are developing a forward-looking integrated capacity and WTE
  database for all blood components to inform trade-offs as required

                                                                                                                                                                                                         2
Whole Blood Capacity 14/09/20
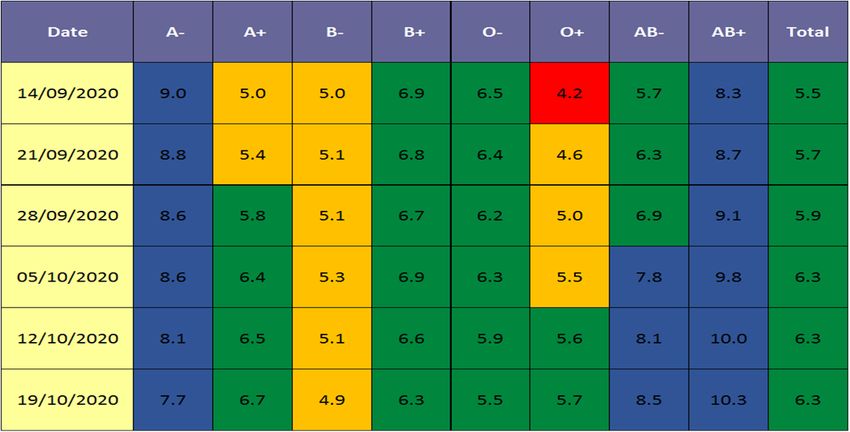
Following lockdown, blood demand has recovered to a greater
   extent than blood supply – with stock levels currently Amber
                                                              Time period where demand > supply

                                                                                                                                    • Current demand ~5% lower
                                                                                                                                      vs. same period in 2019*
                                                                                                                                    • Current supply ~10% lower
                                                                                                                                      vs. same period in 2019*
                                                                                                                                    • August supply was ~6%
                                                                                                                                      below BP, due to initiative
                                                                                                                                      delays (e.g. add’l 50 FTEs)

                                2018                                                                       2019              2020

  Avg. weekly
  demand*
  Avg. weekly
  supply*

  Avg. DOS

Note: *Current average defined as average supply over July and August 2020, excluding any weeks that contain bank holidays
Source: Stock levels and DOS from Planning Team, Daily demand and collection data from Planning Team
                                                                                                                                                              3
Whole Blood Capacity 14/09/20
Reduction in appointment capacity mainly drove reduction in
       blood supply, while donor availability has not been constraint

                                                                                                                                                                                   Booked appointments after
                                                                                                                                                                                   NHSBT cancellations in July-
                                                                                                                                                                                   August still remain ~13% lower
                                                                                                                                                                                   vs. same period in 2019*

                                 2018                                                                      2019                                                              2020

Avg. weekly booked appointments not
cancelled by NHSBT*
Avg. weekly fill
rate*1
                                                                                                                                         Relatively stable overall fill rates in
                                                                                                                                         March / April suggests drop in
                                                                                                                                         collections was not donor-driven
    Note: *Average excludes any weeks that contain bank holidays; 1Fill rate = total booked appointments / total bookable appointments
    Source: Daily demand and collection data from Planning Team
                                                                                                                                                                                                                    4
Whole Blood Capacity 14/09/20
Our collection levels mainly fell due to social distancing and
staffing issues, which continue constraining our supply

  Collections are still constrained by social distancing and staffing issues                                                                Assumptions/commentary
                                                                                                     Directional | High-level estimates
                                                                                                                                            A• Social distancing: Our current capacity remains
                                                                                                                                               ~12% limited by social distancing restrictions
                                                                                                                                               – 20% current constraint in DCs (excl. add’l CVP slots, staff
                                                A                                                                                                overtime, and other mitigating actions), exacerbated by
                                                                                                                                                 needing to accommodate CVP collections in same site
                                                                            B                    C
                                                                                                                                               – 10% current constraint in mobile sessions, following
                                                                                                                                                 efforts to move to larger venues and optimise layouts

                                                                                                                                            B• Staffing constraints: Our staff absence rate still
                                                                                                                                               leading to 6%-7% constraint vs. pre-COVID
                                                                                                                                               – COVID triage process initially conducted by donor carers
                                                                                                                                                 limited staff available for collection, now largely resolved
                                                                                                                                               – Staff sickness / shielding: During the peak, ~12% staff
                                                                                                                                                 were absent given COVID, though currently only 2%
                                                                                                                                               – Staff movement to CVP: ~90 WTE shifted from WB to
                                                                                                                                                 CVP (not including OT), some of which still within CVP,
                                                                                                                                                 thereby driving ~5% ppts incremental WB ‘staff absence’

                                                                                                                                            C• Mitigation actions: The existing impact of
                                                                                                                                               social distancing and staffing constraints has
                                                                                                                                               been partly mitigated by extending opening times
                                                                                                                                               with staff overtime
                                                                                                       Though some informal borrowing
                                                                                                       of CVP capacity likely occurred
                                                                                                       in this period, the largest impact
                                                                                                       of CVP capacity trading
                                                                                                       occurred after w/c 17/08

 Note: *Average excludes any week that contains a bank holiday – and only goes up to w/c 17/08
 Source: Daily demand and collection data from Planning Team                                                                                                                                                    5
Whole Blood Capacity 14/09/20
In addition, to support ramp up of c~23% CVP capacity, c24,000
WB appointment were lost (3-4 DOS equivalent)
                                                                                                                                                                                                                  In addition to offering capacity
                                                                                                                                                                                                                  slots, WB also supported CVP
 Number of actual bookable plasma slots                                                                         New plasma slots in new plasma-only centres                                                       with ramp-up in other ways
 (excl. reserved, incl. samples)                                                                                New plasma slots in existing WB centres                                                           (e.g. staff training)
                                                                                                                Existing CD slots converted to plasma
                                                                                                                Existing WB slots converted to plasma (WEDC)
                                                                                                                                                                                      Total CVP slots              Impact on WB slots
 4,000
                                                                                                                                                                                             35,159

                                                                                                                                                                        3,283
                                                                             3,073                     3,112        3,077        3,130                     3,078
                                                                                          2,956                                               2,919
 3,000
                                                                2,785
                                                   2,687

                                                                                                                                                                                            11,716              • No direct impact; BAU staff
                                      2,132                                                                                                                                                                       support training of new staff

 2,000
                         1,618

            1,309                                                                                                                                                                                               • Some capacity (extra runs,
                                                                                                                                                                                            15,478                overtime) could have been
 1,000                                                                                                                                                                                                            used to increase collections

                                                                                                                                                                                              5,842             • ~17,526 WB lost slots
                                                                                                                                                                                              2,123             • ~6,369 lost WB slots
      0
             WC           WC           WC           WC           WC           WC           WC           WC           WC           WC           WC           WC           WC
            25/05        01/06        08/06        15/06        22/06        29/06        06/07        13/07        20/07        27/07        03/08        10/08        17/08

 Note: Assuming 1 plasma donation slot is equivalent to 3 sample plasma slots, 3 whole blood donation slots, or 0.5 CD slot; Birmingham is assumed to be a new plasma-only centre for the whole period, as majority of plasma slots were on the 4th floor
 for CVP; 50% of WEDC’s plasma sample and donation slots are assumed to be existing WB slots converted to plasma

                                                                                                                                                                                                                                                            6
Whole Blood Capacity 14/09/20
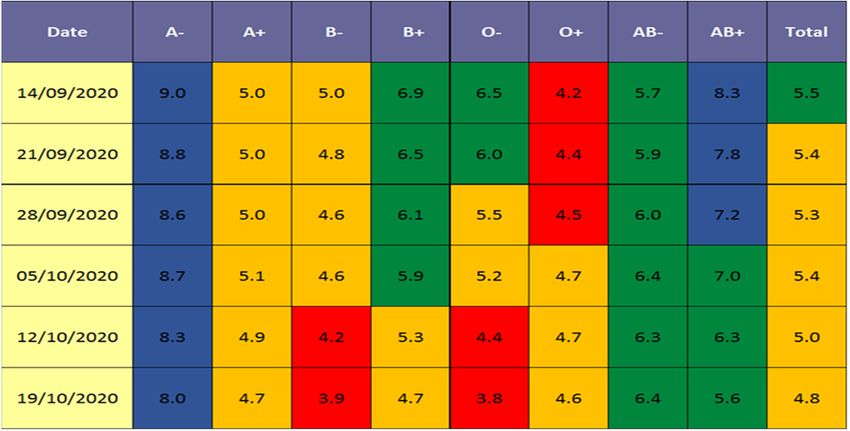
In Sep./Oct., we expect to increase WB collections primarily by
leveraging unutilised CVP capacity and reducing cancellations

 WB Collection Levels                                                                 CVP Fill Rates by Centre

                                        Dependent on WB fill rates1                                                                      # CVP Slots                                                                          # CVP Slots
                                                                                      Centre                    CVP Fill Rate*        converted into WB                    Centre                   CVP Fill Rate*         converted into WB
                                                                                                                                       in September**                                                                       in September**
                                                                                      WEDC                           n.a.***            1,548          37%                 B’ham 4thF                      30%                  0              0%

                                                                                      Bexleyheath                     22%                616           15%                 Bradford                        63%                  0              0%

                                                                                      Twickenham                      24%                616           15%                 Cambridge                       45%                  0              0%

                                                                                      Stratford                       47%                488           12%                 Edgware                        100%                  0              0%

                                                                                      Oxford                          35%                217            5%                 Gloucester                      50%                  0              0%

                                                                                      Lancaster                       35%                201            5%                 Leicester                       44%                  0              0%

                                                                                      Bristol                         31%                167            4%                 Liverpool                       82%                  0              0%

                                                                                      Leeds Bridle Path               15%                160            4%                 Manchester NH                   44%                  0              0%

                                                                                      Southampton                     31%                 92            2%                 Manchester PG                   19%                  0              0%
                                                                                      Liverpool Speke                 40%                 53            1%                 Newcastle                       19%                  0              0%
                                                                                      Luton                           43%                 40            1%                 Nottingham                      72%                  0              0%
                                                                                      Leeds                           19%                 15            0%                 Plymouth                        69%                  0              0%
                                                                                      Poole                           15%                 14            0%                 Sheffield                       93%                  0              0%

                                                                                                                                        4227          100%

 (1) Chart shown assumes NSHBT can reach 92% fill rates on all WB slots converted from CVP by end of September, gradually ramping up (33%,62%,77%,92%) – and consistently maintaining 65% conversion rate
  Note: *Fill rate for the week 14/09/2020 – 20/09/2020; **Total CVP appointments converted to WB appointments from w/c 31/08/2020 to w/c 28/09/2020 (inclusive); ***WEDC has not listed any CVP slots in their grid to the end of September
 Source: NHSBT Planning Data

                                                                                                                                                                                                                                                    7
Whole Blood Capacity 14/09/20
WB slots used to ramp-up CVP would be of similar magnitude to
CVP slots now being borrowed by WB in September and October
                                                                                                                                   … while ~4,200 unfilled CVP slots have been repurposed to WB in
  ~8,000 CVP slots came from borrowed WB/CD slots during ramp-up…                                                                  September with an addition ~3,000 planned for October

 Number of actual bookable plasma slots                                                             From WB to CVP                                                                                                                From CVP to WB
 repurposed from CD / WB during ramp-up period                                                                                              Number of actual bookable plasma slots
 (excl. reserved, incl. samples)                                                                                                            repurposed* into WB slots over September

                                                           Existing CD slots converted to plasma              Total                                                                                                                          Total
                                                                                                             CVP slots                      1,000                                                                                          CVP Slots
                                                                                                                                                                          941
         1,500                                             Existing WB slots converted to plasma (WEDC)

                                                                                                               7,965                                                                     833**            834**                              4,227
                                                                                                                                                         807                                                              812**
                                                                                                                                              800
                                                                                                                                                                                                                                       For October,
                                                                                                                                                                                                                                       add’l CVP slots
         1,000
                 907    876     890                                                                                                           600                                                                                      estimated at
                                       796                                                                                                                                                                                             ~3,000, but will
                                                                                                                                                                                                                                       depend on CVP
                                              636            625    652                                                                                                                                                                fill rates
                                                     553                   544                                                                400
                                                                                  527
           500
                                                                                                388
                                                                                         318
                                                                                                       256                                    200
                                                                                                               5,842

                                                                                                               2,123
             0                                                                                                                                   0
                                                                                                                                                        31/08            07/09           14/09            21/09           28/09
                  5

                        6

                                  6

                                       6

                                              6

                                                     6

                                                               7

                                                                    7

                                                                           7

                                                                                  7

                                                                                         8

                                                                                                8

                                                                                                        8
                 /0

                        /0

                                /0

                                       /0

                                              /0

                                                     /0

                                                             /0

                                                                    /0

                                                                           /0

                                                                                  /0

                                                                                         /0

                                                                                                /0

                                                                                                       /0
              25

                       01

                              08

                                      15

                                             22

                                                    29

                                                           06

                                                                   13

                                                                          20

                                                                                 27

                                                                                        03

                                                                                               10

                                                                                                      17

                                                                                                             Total WB                                                                                                                      Total WB
                                                                                                               slots                                                                                                                         slots

 WB Slot Equiv. 2,316 2,100 2,124 1,770 1,302 1,092 1,446 1,428 1,110 1,062 516                 708    552    17,526
 (CD slots)
                                                                                                                                    WB Slot Equiv.      2,420            2,822           2,500            2,502           2,436             12,680
 WB Slot Equiv. 404     527     545    617    606    567     429    528    522    519    437    455    215     6,369
 (WB alone)

 Note: Assuming roughly 3 WB slots per 1 CVP slot; *Majority of these slots were proactively offered by CVP team, but a smaller proportion being repurposed local at DC level; **In addition to these, 502 CVP slots have been offered to WB, though it is
 still being confirmed how many of those slots can actually be converted from a staffing perspective (potential maximum number of 1,506, though will most certainly be lower given operational constraints)
 Source: NHSBT Planning Data

                                                                                                                                                                                                                                                             8
Whole Blood Capacity 14/09/20
To fully leverage borrowed CVP capacity, we need to ensure to
maintain fill rates, which have declined recently as capacity
has been added at short notice
 Fill rates declining mainly due to short-notice surge capacity                                    Conversion rates have not declined with increase in capacity
                                                            We are currently falling short
   WB average weekly fill rate                              of the plan, mainly due to lower        WB average weekly conversion rate
   (currently booked appointments / bookable slots)         than assumed fill rates 89% vs.         (successful donations / bookable slots)
                                                            plan 92% in Sep., partly driven
   100%                                                     by CVP capacity coming                  100%
                                                            online at short notice
                   95% 95%                                                                             95
      95 94%                 94% 93% 93%                               Today                                                                                               Today
                                            92%                                                        90
                                                  91% 92%   90% 90%
      90                                                              89% 89%                          85
                                                                                 86%
                                                                                                       80
      85                                                                               84%
                                                                                                       75                                                     73%
                                                                                                                  70% 70%                                           70%
      80                                                                                               70 69%                   68% 69% 68% 67%         68%               68%
                                                                                             76%                                                  65%
                                                                                                       65
          0                                                                                             0

 Donor
              90   95   93   90   91   90   88    89   87   73   76   73    73   61    52    33
 Centre
 Mobile       94   95   95   95   94   93   93    92   93   92   95   95    94   96    95    91

                                                                                                                                                                                   9
Whole Blood Capacity 14/09/20
Even if we fully deliver against planned initiatives, our October
stock position is fairly dependent on demand scenarios

Scenario #1: Demand at 100% by September                                       Scenario #2: Demand stabilises at 95%
• Demand: Demand fully restored in September (circa 26.8K)                     • Demand: Demand stabilises at ~95% (circa 25.4K)
• Collections: Action plan delivered on time, in-full (with ~92% fill rates)   • Collections: Action plan delivered on time, in-full (with ~92% fill rates)

      Stocks levels would fall and likely fall into Red                           Stock levels would grow and stock could return to
                    by end of October                                                           green band in October

                                                                                                                                                              10
In early September, demand is up but still remains c3.5% below
our forecast, which assumes full restoration

                                                         Based on demand forecast issued in June 2020

                                                                           Actual
                                                          Week                        % difference
                                                                            RBC
                                                          commencing                  vs. forecast
                                                                           issues
                                          2019 average
                                                          03/08            24,858          -2.7%

                                                          10/08            25,640          -0.5%

                                                          17/08            24,607          -5.2%

                                                          24/08            24,658          -9.2%

                                                          31/08            23,717          -3.5%

                                                          07/09            26,540          -3.6%

                                                                                                        11
Beyond October, we have a plan in place to increase standalone
Whole Blood collection levels into December by 5-7%
                                                                         Preliminary | To be refined   Independent of CVP capacity      Included within integrated training plan

              100% supply restoration (+10% above baseline, ~28,500)

               Our required supply to maintain stock levels depends on our
                  demand expectation, which may vary with a 2nd wave

              95% supply restoration (+5% above baseline, ~27,300)

                                    Impact on collections has been planned for or
                                               are partially delivered                                      Impact on collections being further detailed

 Source: NHSBT Planning Team Estimates

                                                                                                                                                                                   12
Beyond our existing plan, we are considering other potential
options to increase collections back to 100%
Highest priority – to begin action as soon as possible
                                                                                                                                       Rate-limiting factor is
• Establishing new ‘pop up’ sites – likely in early 2021, given recruiting / training serves as critical pinch-point
                                                                                                                                        speed at which we
                                                                                                                                       can recruit / train, but
• Extending opening hours – many sessions DC operate 7 days, but potential to extend some mobile teams from 8
                                                                                                                                       we are developing an
  days a fortnight to 9 days a fortnight or plan sessions for two or three days in a row (less set up and pack down time)              integrated capacity
                                                                                                                                         and WTE plan to
• Increasing size of mobile venues – where issue has not yet been resolved, exploring ideas to find larger venues                        inform trade-offs
  e.g. reaching out to high-streets to take advantage of premises that remain closed                                                      where required

Lower priority – to consider as/when required

• Continue borrowing CVP capacity beyond October – largely depends on CVP fill rates and evolution of 2nd wave

• Requesting military support – either for donations themselves (Korea example) or for nursing resources

Deprioritised – not feasible for the time being

• Review social distancing policy to increase # chairs / session – recent taskforce concluded PPE should be seen
  as ‘last line of defence’ (preference for 2M distance) and very limited benefit to introducing visors / screens
  – Donor Visors: Pinch-point is in waiting / tea area, where not feasible for donors to wear visors given they are consuming fluids
  – Screens – Mobile Sessions: Set-up and pack-down of screens may create further loss in capacity from staff time required
  – Screens – Donor Centres: Given lay-out and space to walk around the screens, this may actually increase total space usage

                                                                                                                                                             13
You can also read