Creating a leading renewables player - Pro forma combined renewables platform

Page created by Tom Reeves
 
CONTINUE READING
Creating a leading renewables player - Pro forma combined renewables platform
Creating a leading
renewables player

Pro forma combined renewables platform
August 2018
Creating a leading renewables player - Pro forma combined renewables platform
Disclaimer

This document contains forward-looking statements. These statements are based on the
current views, expectations, assumptions and information of the management, and are based
on information currently available to the management. Forward-looking statements shall not be
construed as a promise for the materialisation of future results and developments and involve
known and unknown risks and uncertainties. Actual results, performance or events may differ
materially from those described in such statements due to, among other things, changes in the
general economic and competitive environment, risks associated with capital markets, currency
exchange rate fluctuations, changes in international and national laws and regulations, in
particular with respect to tax laws and regulations, affecting the Company, and other factors.
Neither the Company nor any of its affiliates assumes any obligations to update any forward-
looking statements.

All figures are based on pro forma combined innogy and E.ON publicly available renewables
data. The implementation of the transaction is still subject to conditions, including merger
control clearances.

Pro forma combined renewables platform                                        RWE          Page 2
Creating a leading renewables player - Pro forma combined renewables platform
Renewables

Leading renewables player with attractive growth platform

  Installed renewable capacity in Europe1

                                          Pro forma
                                          combined

  > No. 3 renewables player in Europe with well-balanced portfolio and strong position in U.S. onshore
    wind market

  > No. 2 offshore wind operator globally with 2.2 GW2 in operation and 0.8 GW2 in construction and
    advanced development

  > Excellent solar EPC & operations capability and innovative battery solutions provider

  > Strong development pipeline in attractive growth markets and scope for efficiencies
1 Bloomberg   New Energy Finance, March 2018. | 2 Pro rata capacity as at 30 June 2018.
Pro forma combined renewables platform                                                      RWE          Page 3
Creating a leading renewables player - Pro forma combined renewables platform
Renewables

Well diversified renewables generation portfolio

    Renewables capacity split by technology1                                                 Renewables capacity split by country1

                                          Other
                            Hydro          1%                                                                           RoW
                                                                                                                                                            Germany
                                         6%                                                                                    7%
    Offshore                                                                                                                                     19%
    wind

                      25%                                                                     US

                                         8.6 GW                                                            36%                8.6 GW
                                                                                                                                                            24%
                                                             68%
                                                                                                                                                                  UK
                                                                                                                             4% 4% 6%
                                                                 Onshore
                                                                                                                        Italy                      Iberia
                                                                 wind
                                                                                                                                  Benelux

1Pro forma combined renewables capacity as at 30 June 2018. Pro rata view. Excludes RWE’s own renewable capacity. Excluding renewable portfolio of E.DIS and
 20% in Rampion. Does not include 88 MW capacity of Galloper as COD of full capacity is expected for August 2018.
Source: innogy and E.ON.
Pro forma combined renewables platform                                                                                                                RWE              Page 4
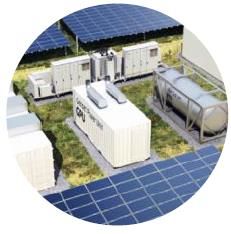
Creating a leading renewables player - Pro forma combined renewables platform
Renewables

Strong platform with attractive growth prospects

    Capacity in operation, under construction and close to FID1
    GW, pro rata
                                                                 1.4                      10.7                > Total combined development
                                                                                                                pipeline of ~17 GW
                                             0.7
                8.6                                                                                           > Projects under construction include
                                                                                                                projects expected to be commissioned
                                                                                                                in 2018 and 2019
                                                         Triton Knoll2    507 MW
                               Galloper         88 MW    Australian PV    462 MW                              > Advanced development includes
                               Arkona          194 MW    Cassadaga        126 MW
                               Stella          201 MW    West of Pecos    100 MW
                                                                                                                projects with FID in 2018 and 2019
                               Morcone          57 MW    Other            250 MW                                and expected commissioning between
                               Other           166 MW                                                           2019 and 2021

              In                           Under              Close to                    Total
           operation                     construction           FID
1Pro forma combined renewables capacity as at 30 June 2018. Pro rata view. Excluding renewable portfolio of E.DIS and 20% of Rampion.
259% stake in Triton Knoll as per innogy announcement of 13 August 2018.
Source: innogy and E.ON.
Pro forma combined renewables platform                                                                                                  RWE      Page 5
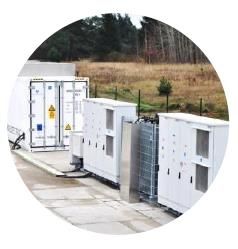
Creating a leading renewables player - Pro forma combined renewables platform
Renewables

Attractive earnings contribution with strong investments
into future growth

    Pro forma combined Renewables EBITDA 2017                        Pro forma combined Renewables capex 2017

    € million, (previous year)                                       € million, (previous year)

                                                                                                         417
                                                                                                          (339)
                                         1,479             694
                          785
                                         (1,467)          (671)
                                                                                               1,642
                          (796)                                                                (1,409)
                      1
                                                                                       1.225
                                                                                   1       (1,070)

1Includes assets out of scope of transaction (E.DIS, 20% Rampion).
Source: innogy and E.ON.
Pro forma combined renewables platform                                                                    RWE     Page 6
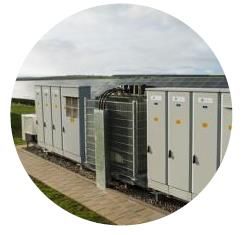
Creating a leading renewables player - Pro forma combined renewables platform
Renewables

  Earnings growth foreseen until early 2020s before
  investing into further pipeline projects

    Estimated development of EBITDA for pro forma combined operational renewables portfolio

   illustrative                              Expiration of higher starting                                    > Illustrative earnings
                                           tariffs under EEG compression             End of ROC scheme          profile of portfolio in
                                             model at Nordsee Ost and               for offshore wind farms
                                                     Amrumbank                         London Array and
                                                                                                                operation and under
                                                                                        Greater Gabbard         construction

                                                                                                              > Assumes no further
                                                                                                                growth capex; excludes
    €1.5 bn               Commissioning                                                                         projects without FID, e.g.
                            of projects                                                                         Triton Knoll
                               under                 End of ROC scheme for
                           construction               offshore wind farms
                                                       Scroby Sands and                                       > ~50% of portfolio with
                                                           Robin Rigg                                           regulated or contracted
                                                                                                                cash flows

                                                                                                              > ~11.5 years avg.
                                                                                                                remaining support tenor
2015         2017                2020              2025                      2030                  2035

  Note: Consolidated view.
  Source: RWE analysis.
  Pro forma combined renewables platform                                                                                RWE               Page 7
Offshore Wind

Offshore wind: No. 2 operator globally with 2.2 GW
in operation
                                                                                                             1    Scroby Sands, UK, 60 MW
                                                                                                             2    Robin Rigg West, UK, 90 MW
                                                                                                             3    Robin Rigg East, UK, 84 MW
                                                                                                             4    Alpha Ventus I, DE, 30 MW
                                                                                                        11
                                                                                                             5    Alpha Ventus II, DE, 30 MW
                                                                                                             6    Rhyl Flats, UK, 90 MW
                                                                                                             7    Rødsand 2, DEN, 207 MW
                                                                                                             8    Greater Gabbard, UK, 504 MW
                                                                              15                   19
                                                                       21 16                   7             9    London Array 1-4, UK, 629 MW
                                 3                                            12
                                2                                            5                               10   Thornton Bank I-III, BE, 325 MW
                                   13                                    4
                                  6               14
                                                       20
                                                                                                             11   Karehamn, SE, 48 MW

                                                          1                                                  12   Nordsee Ost, DE, 295 MW
                                                         18                                                  13   Gwynt y Môr, UK, 576 MW
                                                        8
                                                       9    10                                               14   Humber, UK, 219 MW
                                                                                                             15   Amrumbank West, DE, 302 MW
                                         17
                                                                                                             16   Nordsee One, DE, 332 MW
                                                                                                             17   Rampion, UK, 400 MW
                                                                                                             18   Galloper, UK, 353 MW (UC)
                                                                                                             19   Arkona, DE, 385 MW (UC)
                                                                                                             20   Triton Knoll, UK, 860 MW (in dev.)
                                              UC: Under Construction      in dev: in development             21   Kaskasi, DE, 325 MW (in dev.)
1Pro forma combined renewables capacity as at 30 June 2018. Gross capacity.
Source: innogy and E.ON.
Pro forma combined renewables platform                                                                                          RWE                    Page 8
Offshore Wind

Offshore wind: Overview of operational capacity
                                   Country        Total          Share        Pro-rata        Accounting             COD            Support          Support level           Support
                                              capacity (MW)                  view (MW)        view (MW)                             regime                                    expiry
    Blyth                                UK         4            100.0%             4                 4              2000                    n/a (decommissioned in 2018)
    Scroby Sands                         UK        60            100.0%            60                60              2004          Certificate          1.0 ROC1               2027
    Robin Rigg West                      UK        90            100.0%            90                90              2009          Certificate          1.5 ROC1               2029
    Robin Rigg East                      UK        84            100.0%            84                84              2010          Certificate          2.0 ROC1               2030
    Alpha Ventus 1                       DE        30             26.0%             8                 0              2010              FIT            €154/MWh2                2030
    Alpha Ventus 2                       DE        30             26.0%             8                 0              2009              FIT            €154/MWh2                2029
    Rhyl Flats                           UK        90             50.0%            45                90              2010          Certificate          1.5 ROC1               2029
    Rødsand 2                            DK       207             20.0%            41                 0              2010              CfD           DKK629/MWh                2022
    Greater Gabbard                      UK       504             50.0%          252               252               2012          Certificate          2.0 ROC1               2032
    London Array 1-4                     UK       629             30.0%          189               189               2013          Certificate          2.0 ROC1               2032
    Thornton Bank I-III                  BE       325             27.0%            87                 0           2009-2013        Certificate         €90/MWh3            2029-2036
    Karehamn                             SE        48            100.0%            48                48              2013          Certificate                                 2028
    Nordsee Ost                          DE       295            100.0%          295               295               2015              FIT            €194/MWh4                2023
    Gwynt y Môr                          UK       576             50.0%          288               288               2015          Certificate          2.0 ROC1               2033
    Humber 1 & 2                         UK       219            100.0%          219               219               2015          Certificate          2.0 ROC1               2035
    Amrumbank West                       DE       302            100.0%          302               302               2015              FIT            €194/MWh4                2024
    Nordsee One                          DE       332             13.5%            45                 0              2017              FIT            €194/MWh4                2026
    Rampion                              UK       400             30.0%          120                  0              2018          Certificate          1.8 ROC1               2038
    Total                                       4,225                          2,185             1,921
1 ROC: Renewable Obligation Certificate. | 2 EEG compression model: €154/MWh for 12 years + 1.5 year on average (by turbine) due to depth of water & distance from shore, thereafter
  €35/MWh. | 3 Minimum price of €107/MWh for first 216 MW, €90/MWh for capacity exceeding 216 MW.
4 EEG compression model: €194/MWh for 8 years, €154/MWh for 1 to 2 years on average (by turbine) depending on depth of water & distance from shore, thereafter €39/MWh.

Source: innogy and E.ON.
Pro forma combined renewables platform                                                                                                                    RWE                          Page 9
Onshore Wind

Onshore wind: Experienced operator with 2.8 GW
installed capacity in Europe

Pro forma installed onshore wind capacity                                                      Key operational data 2017
MW, pro rata view, as at 30 June 2018                                                          Accounting view

                                                                 115                                                 Germany                            34              1,013
                                                                                                                     United Kingdom                   552                 771
                                                                                                                     Spain                              --              1,017
                                                                                                 Production          Poland                           341                 600
                                                                                                 volume              Italy                            629                  125
                                    598       289                                                (GWh)
                                                                             375
                                                                                                                     Netherlands                        --                 688
                                                           588                                                       Sweden                           361                    --
                                                                                                                     Total                          2,311               4,214

                                                                                                                       Germany                       20%                 18%
                                                              385                                                      United Kingdom                26%                 26%
                                                                                                                       Spain                           --                26%
                                                                                                                       Poland                        27%                 28%
       3                                                                                         Load factor1          Italy                         22%                 21%
                    443
                                                                                                                       Netherlands                     --                27%
                                                                                                                       Sweden                        33%                      --

1Information on E.ON load factor: Net load factor is the amount of generation produced compared to what is theoretically possible at maximum capacity (wind does not influence this).
Note: Rounding differences may occur. Excluding renewable portfolio of E.DIS.
Source: innogy and E.ON.
Pro forma combined renewables platform                                                                                                                       RWE    27 August, 2018     Page 10
Onshore Wind

Onshore wind: Strong US footprint with 3 GW in operation
and attractive ~8 GW pipeline

                                                                                                       Complementary portfolio across the US

                                                                                                     > E.ON is well established in the US market
                                                                                                       with 3 GW of installed capacity and
                                                                                                       5.9 GW of pipeline in the South and Midwest

                                                                                                     > innogy entered the US market with recent
                                                                                                       acquisition of a 2 GW onshore wind pipeline in
                                                                                                       the Northeast and West

                                                                                                       Key operational data 2017
                                                                                                       Accounting view

                                                                                                         Production volume                                   6,503 GWh

                                                                                                         Load factor1                                         36%

1Information on E.ON load factor: Net load factor is the amount of generation produced compared to what is theoretically possible at maximum capacity (wind does not influence this).
Source: innogy and E.ON.
Pro forma combined renewables platform                                                                                                                       RWE    27 August, 2018     Page 11
Solar/PV & Battery

Global solar/PV & battery projects all set for growth

innogy’s BELECTRIC: Leading specialist for                                              Attractive platform for solar/PV & battery
utility-scale solar power plants                                                        development

> More than 300 large-scale PV plants with more                                         > Two 10 MW batteries co-sited with onshore
  than 2.0 GWp1 developed and constructed                                                 wind projects in operation in Texas, one
  globally (EPC)                                                                          10 MW battery co-sited with solar in Arizona
                                                                                          by E.ON
> One of the largest service providers for
  PV/battery O&M globally                                                               > Planned FID in Q3/Q4 2018 for two solar
                                                                                          power plants in Australia with combined
> O&M services for assets with more than                                                  capacity of more than 460 MW by innogy
  1.3 GWp1 installed capacity
                                                                                        > 100 MW solar park with capacity of 100 MW in
                                                                                          Texas planned by E.ON

                                                                                        > Exclusive rights for solar development projects
                                                                                          with US solar developer Birdseye Renewable
                                                                                          Energy agreed by innogy
         Storage                                       Grid stabilisation
         solutions                                        technology

                               Off-grid and
                              hybrid systems
1GWp: Gigawatt Peak.
Source: innogy August 2018 presentation, Factbook 2018. E.ON press releases Jan and June 2018.
Topic of presentation                                                                                                      RWE   27 August, 2018   Page 12
Appendix

Pro forma combined renewables platform   RWE   Page 13
Renewables

Pro forma combined renewables financials

    Renewables key financials FY 2016 and FY 2017                                               Renewables key financials H1 2017 and H1 2018

    € million                            FY 2016           FY 2017             Change              € million                          H1 2017              H1 2018             Change

                                             671                  694                +23                                                     338                 322              -16
                 1                                                                                             2
                                             796                  785                 -11                                                    374                 384              +10
    Pro forma combined                                                                             Pro forma combined
                                           1,467               1,479                 +12                                                     712                 706               -6
    adj. EBITDA                                                                                    adj. EBITDA

                                             359                  355                   -4                                                   179                 167              -12
                 1                                                                                             2
                                             430                  454                +24                                                     198                 227              +29
    Pro forma combined                                                                             Pro forma combined
                                             789                  809                +20                                                     377                 394              +17
    adj. EBIT                                                                                      adj. EBIT

                                             339                  417                +78                                                     162                 178              +16
                 1                                                                                             2
                                           1,070               1,225               +155                                                      515                 448              -67
    Pro forma combined                                                                             Pro forma combined
                                           1,409               1,642               +233                                                      677                 626              -51
    investments3                                                                                   investments3

1 Includes assets out of scope of transaction (E.DIS, 20% Rampion).
2 Reclassified businesses of Renewables (excluding E.DIS and 20% in Rampion).
3 For innogy, includes capital expenditure on property, plant and equipment and on intangible assets and on financial assets. For E.ON, includes cash-effective investments.

Source: innogy and E.ON.
Pro forma combined renewables platform                                                                                                                        RWE                  Page 14
Offshore Wind

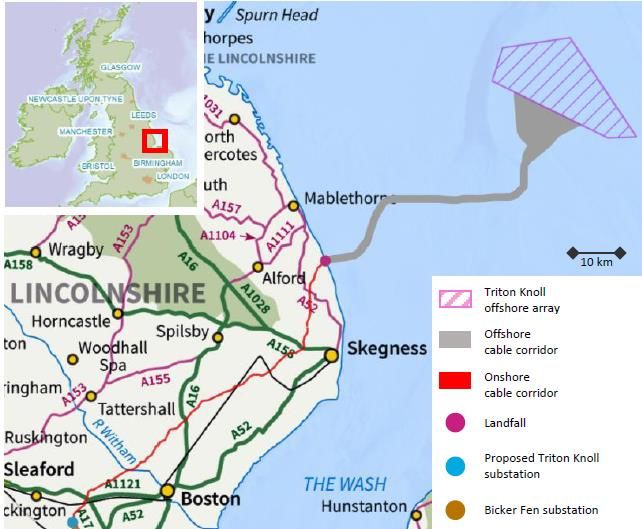
Triton Knoll – project overview

              Project name           Triton Knoll

                 Technology          Offshore Wind

                      Country        UK

                     Location        Area of c. 118 km 2, 32 km off the coast of
                                     Lincolnshire

         Planned capacity            ~860 MW (90 MHI Vestas V164-9.5MW turbines)

                  Investment         ~£2 billion (incl. up to £0.5 billion for
                                     grid connection)

                  Ownership          59% innogy3

        Mean wind speed              9.83 m/s (at 107 m height)

              Water depths           15 to 24 m (avg. 18 m)

          Status/consents            Fully developed, all required consents in place

          FID/construction           FID taken in Q2, subject to financial close in Q3
                                     2018. Onshore works to begin in 2018, offshore
                                     works from 2020
           Commissioning             Start of commissioning scheduled for 2021

          Support scheme             UK CfD1, £74.75/MWh2 for a total period of
                                     15 years
1Contract for Difference scheme. | 2 CfD strike price on 2012 prices. | 3 According to innogy announcement of 13 August 2018.
Source: innogy Factbook 2018.
Pro forma combined renewables platform                                                                                          RWE   Page 15
Offshore Wind

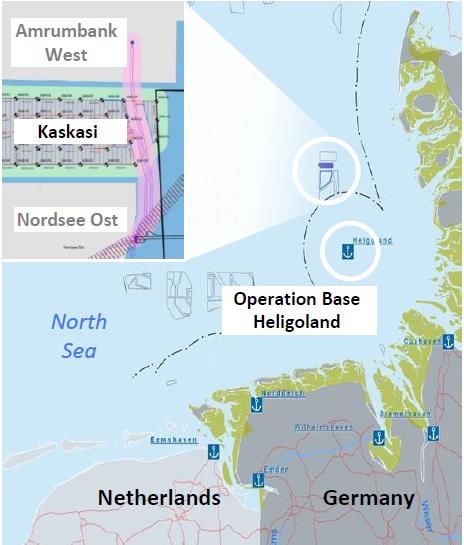
Kaskasi – project overview

              Project name           Kaskasi

                 Technology          Offshore Wind

                      Country        Germany

                                     Area of c. 17.4 km 2, 33 km off the coast of
                     Location
                                     Heligoland

         Planned capacity            ~325 MW (turbine type not defined yet)

                  Ownership          100% innogy1

        Mean wind speed              10.1 m/s (at 103 m LAT)

              Water depths           18 to 25 m (avg. 22 m)

                                     Allocated grid connection; converter station existing;
          Status/consents
                                     BSH2 application fully submitted, updated in Q1 2019
                                     Onshore manufacturing works to begin in 2020,
          FID/construction
                                     offshore works from 2021

           Commissioning             Start of commissioning scheduled for 2022

                                     Guaranteed minimum tariff for 20 years after first
          Support scheme
                                     feed in (successful bid price provides a floor)

                  Next steps         FID/FC planned for Q1 2020
1innogy to review all options regarding the future ownership structure. | 2 BSH: Federal Maritime and Hydrographic Agency of Germany.
Source: innogy Factbook 2018.
Pro forma combined renewables platform                                                                                                  RWE   Page 16
Solar/PV & Battery

Australian solar PV – project overview

                  Project name           Limondale Sun Farm / Hillston Sun Farm1

                     Technology          Solar

                          Country        Australia

                         Location        New South Wales

             Planned capacity            347 MWp2 / 115 MWp2

          Construction Capex             ~ €400 m (incl. project rights)

          Average load factor            23%

               Status/consents           Late stage

                     Planned             Q3 2018
              FID/construction
     Planned Commissioning               End of 2019

              Support scheme             Merchant

                     Project IRR         Above hurdle rate of >5% post tax3

1   Closing of transaction and FIRB (Foreign Investment Review Board) approval outstanding. | 2 MWp: Megawatt Peak. | 3 Hurdle rates are subject to frequent review and differ depending
    on project structure/risks. | Source: innogy Factbook 2018.
Pro forma combined renewables platform                                                                                                                        RWE                     Page 17
Your contacts @RWE Investor Relations

             Important Links                                                                           Financial Calendar

                  Annual and Interim Reports                                                              14 August 2018
                  http://www.rwe.com/ir/reports                                                           Interim report on the first half of 2018
                  Investor and Analyst Conferences                                                        14 November 2018
                  http://www.rwe.com/ir/investor-and-analyst-conferences                                  Interim statement on the first three quarters of 2018
                  IR presentations & further factbooks                                                    14 March 2019
                  http://www.rwe.com/ir/presentations                                                     Annual report 2018
                  IR videos                                                                               3 May 2019
                  http://www.rwe.com/ir/videos                                                            Annual General Meeting
                  Consensus of analysts’ estimates                                                        15 May 2019
                  http://www.rwe.com/ir/consensus-estimates                                               Interim statement on the first quarter of 2019

             Contacts for Institutional Investors & Financial Analysts                                 Contact for Private Shareholders

                                Gunhild Grieve                             Lenka Zikmundova                           Sabine Gathmann
                                Head of Investor Relations                 Tel.: +49 201 5179-3116                    Tel.: +49 201 5179-3115
                                Tel. +49 201 5179-3110                     lenka.zikmundova@rwe.com                   sabine.gathmann@rwe.com
                                gunhild.grieve@rwe.com

                                Martin Vahlbrock                           Jérôme Hördemann
                                Tel.: +49 201 5179-3117                    Tel.: +49 201 5179-3119
                                martin.vahlbrock@rwe.com                   jerome.hoerdemann@rwe.com

                                Dr. Burkhard Pahnke                        Susanne Lange
                                Tel.: +49 201 5179-3118                    Tel.: +49 201 5179-3120
                                burkhard.pahnke@rwe.com                    susanne.lange@rwe.com

Pro forma combined renewables platform                                                                                         RWE                         Page 18
RWE
You can also read