Quarterly System Status Briefing Winter Status - Brian Molefe Chief Executive 17 June 2015
←
→
Page content transcription
If your browser does not render page correctly, please read the page content below
Quarterly System Status Briefing

Winter Status

Brian Molefe
Chief Executive

17 June 2015
Content

              Introduction

          Half-year performance

             Winter Outlook

            Build Programme

               Conclusion

                                  2
Contents

  Introduction
  Half-Year Performance
  Winter Outlook
  Build programme
  Conclusion
Overview

 •   Eskom has continued to supply up to an average of 96% of electricity in the
     country during the first half of 2015 and will continue to do so in Winter

 •   We endeavour to do maintenance with no or minimal load shedding this winter

 •   Notwithstanding, we have an aging and volatile plant :
            - the cold weather increases demand, which pushes our plant to run at
              100% capacity for extended periods, further exacerbating unplanned
              outages
            - maintenance will put an already strained system under further pressure

 •   Up to 5 500 MW of planned maintenance will be performed, three times more than
     previous winters

 •   Every effort is being made to reduce plant breakdowns (unplanned maintenance)
     to allow for planned maintenance

 •   Medupi unit 6 is on track towards commercialisation and supplies up to 800 MW to
     the grid, while still in test (synchronisation) mode

 •   There is no prospect of a blackout in South Africa
                                                                                        4
Contents

  Introduction
  Half-Year Performance
  Winter Outlook
  Build programme
  Conclusion

Eskom is committed to supplying the country and
minimising the risk of load shedding

• During the first-half of the year, an average of 96% of electricity was supplied
  in the country when load shedding in Stage 2, despite a higher demand during this
  period, compared to last year

• Generating performance was slightly better than expected

• Open cycle gas turbines were used extensively, with the highest usage in May

• Independent Power Producers continue to play an important role, contributing
  about 1 827MW to the grid at a time when the power system is constrained

• Renewable energy contributed about 1 300 MW during the day, of which 800 MW
  was from solar and 500 MW from wind.

• Benefits from the Build Programme contribute to the grid: 100 MW from Sere, and
  up to 800 MW from Medupi during peak periods

                                                                                      6
Despite load shedding on average in Stage 2, Eskom
supplied 96% of electricity during the first half
100% Key insights
90%
• In the recent
80%
months, Eskom
Not had to implement
70%
Supplied regular load
60% shedding due to
Demand
the unavailability
50% of some of the
generation units
40%
• Eskom supplied
30%
on average 96%
20%
of the demand
during the period
10%
0%
Jul-14
Jun-14
Jan-15
Feb-15
Mar-15
Aug-14
Sep-14
Nov-14
Dec-14
May-14
Oct-14
Apr-14
Apr-15We had forecast a high probability of load shedding
on most days
Jan-15 Feb-15
Sun Mon Tue Wed Thu Fri Sat Sun Mon Tue Wed Thu Fri Sat
1 2 3 1 2 3 *4 *5 6 7
4 5 6 7 8 9 10 8 9 10 * 11 12 13 14
11 12 13 14 15 16 17 * 15 16 17 18 19 20 21
18 19 20 21 22 23 24 22 23 24 25 26 27 28
25 * 26 * 27 28 29 30 31
Mar-15 Apr-15
Sun Mon Tue Wed Thu Fri Sat Sun Mon Tue Wed Thu Fri Sat
1 2 3 4 5 6 7 1 2 3 4
8 9 10 11 12 13 14 5 6 7 8 9 10 11
15 16 17 18 19 20 21 12 13 * 14 * 15 * 16 17 18
22 23 24 25 26 27 28 19 20 21 22 * 23 24 25
29 30 31 26 27 28 29 30
Adequate generation capacity available to meet
May-15
demand and reserves
Sun Mon Tue Wed Thu Fri Sat
1 2 Constrained generation capacity with sufficient
3 4 5 *6 *7 8 *9 supply to meet demand and reserves. Medium
10 * 11 12 13 * 14 15 16
probability of load shedding
17 18 19 20 21 22 23 Insufficient generation capacity unable to meet
24 25 26 27 28 29 30 demand and reserves. High probability of load
8
sheddingActual system status: We performed better than
expected for January - April 2015
No load shedding Stage 1 Stage 2 Stage 3 * stage change
Jan-15 Feb-15
Sun Mon Tue Wed Thu Fri Sat Sun Mon Tue Wed Thu Fri Sat
1 2 3 1 2 3 *4 *5 6 7
4 5 6 7 8 9 10 8 9 10 * 11 12 13 14
11 12 13 14 15 16 17 * 15 16 17 18 19 20 21
18 19 20 21 22 23 24 22 23 24 25 26 27 28
25 * 26 * 27 28 29 30 31
Mar-15 Apr-15
Sun Mon Tue Wed Thu Fri Sat Sun Mon Tue Wed Thu Fri Sat
1 2 3 4 5 6 7 1 2 3 4
8 9 10 11 12 13 14 5 6 7 8 9 10 11
15 16 17 18 19 20 21 12 13 * 14 * 15 * 16 17 18
22 23 24 25 26 27 28 19 20 21 22 * 23 24 25
29 30 31 26 27 28 29 30
May-15 Key insights
Sun Mon Tue Wed Thu Fri Sat • With the exception of May, the lights were
1 2
kept on, most days
3 4 5 *6 *7 8 *9 • Even during load shedding, 96% of the
10 * 11 12 13 * 14 15 16 country had electricity
17 18 19 20 21 22 23 • During the month of May, on average, load
24 25 26 27 28 29 30
shedding was implemented for only 6 hours
9 in a 24-hour dayContents Introduction Half-Year Performance Winter Outlook Build programme Conclusion
Winter outlook:
While the system will be tight, Eskom will only
implement load shedding as a last resort

• Winter 2015 is likely to be colder than last year, with a higher expected
  demand in electricity during the peak periods.

• We anticipate to supply 100% of electricity most days and 96% during peak
  periods from 6am to 10am and 5pm to 10pm.

• Even during the cold front that hit from Wednesday, 3 June, Eskom
  implemented only 5 hours of load shedding on Sunday, 7 June. This after 10
  consecutive days of no load shedding.

• The recent load shedding from Monday, 8 June 2015 to Friday, 12 June 2015
  was the result of an increase in demand and an increase in unplanned
  breakdowns

• Localised power outages in urban areas and illegal connections generally
  increase during winter due to increased levels of customer demand and hence
  cause greater stress on the system.

                                                                                11
Winter outlook: continued
While the system will be tight, Eskom will only
implement load shedding as a last resort
• We will continue with maintenance during winter, three times more than
previous winters.
• We will continue to use all available resources: Independent Power Producers
(including renewable energy), Open Cycle Gas Turbines and Demand Market
Participation.
• To date wind energy contributes between 300 MW to 500 MW during the day
and solar energy about 800 MW.
• Industrial customers continue to contribute an average of 10% savings
• Coal stock levels are healthy at all but three stations. The average stock level
days as at 8 June is 50.4 days against an average target of 51.2 days
12In Winter, more electricity is used during the morning
and evening peak periods
Insights
Summer and winter load profiles
• In Winter, the demand/load
profile increases and peaks
during the morning and
evening, as more electricity is
Increase in used during these periods
demand • In Summer, the risk of load
from 5pm to 10 pm
shedding is longer and for
Increase in
most of the day
demand
from 6am to 10am • In Winter, the risk of load
shedding is for shorter
periods and only during the
peaks
• The generating plant
generally performs better in
winter, as the cooler
temperatures have less
impact on the equipment
• As the greatest demand is
during the peak, 4% of South
Africans could be impacted
by load shedding from 06:00-
10:00 & 17:00-22:00 (as per
load shedding schedules)
13How do we do maintenance without load
shedding? Eskom intends to do maintenance with
limited load shedding
50
2014 peak demand
was 35 677 MW
45 43.5 GW installed (includes Cahora Bassa and excludes Medupi)
7 GW maintenance window that must
40
include planned, unplanned & load losses
+ 1 500 MW
36.5 GW operating
35 reserves
35GW
34 GW
30 32.5GW
36GW instantaneous
33GW instantaneous
25
Maximum demand
Maximum demand
20
Gw
15
10
5
0
Capacity Summer Demand Winter Demand
Capacity from independent power producers, including renewables, reflect as a reduction in
demand when the capacity is available 14Eskom’s maintenance philosophy consists of
planned and unplanned maintenance
Planned • Philosophy maintenance
maintenance • Safety maintenance
• Statutory maintenance
Maintenance
• Risk maintenance
Unplanned • Breakdowns (Total and
maintenance partial load losses)
Maintenance = Philosophy + safety + statutory + risk + breakdowns
In the short term, Eskom will prioritise RISK MAINTENANCE in order to reduce
the amount of unplanned maintenance
• 15 of a total of 18 maintenance outages (83%) are on power plants that are classified
as Risk 1/Risk 2/Risk 3
• 13 of a total of 18 maintenance outages (80%) is also philosophy maintenance
On average Eskom has a maintenance budget of 7 000 MW in winter,
which is dependent on demand requirements
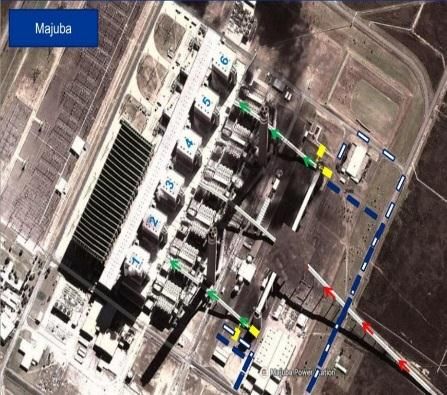
11Progress at Majuba Power Station, as all six
units can operate at full load
• An immediate and gap solution is in place, enabling the station to run all six units
(3 843 MW) at full load.
- This provides coal supplies to all six units via mobile equipment and temporary coal
stock piles.
• A contract was awarded on 2 March 2015 for the interim solution which replaces
the mobile equipment with conveyor belts running from the permanent stockpiles to
ensure greater efficiency in the coal handling process.
• Construction is in progress and will be completed by end September 2015.
• A new permanent coal handling plant is expected to be in place at the end of 2016.
- Design consultants have been appointed and construction is expected to begin early
January 2016, once a construction contractor has been appointed.
• The investigation has been concluded and will be presented
to the Board and Shareholder
16Duvha unit 3 boiler contract soon to be in
place
• The over-pressurisation incident at Unit 3 of Duvha power station in
March 2014 took 575MW unit out of service for repair.
• The incident investigation has been completed and the primary cause
was noted as a build-up of unburnt fuel within the boiler, which ignited
in an uncontrolled manner
• A process is under way to address all the recommendations from the
report, and key learnings have been shared with other power stations.
• Negotiations have started with a boiler supplier and once technical,
financial and commercial issues have been agreed, repair work
should begin in July 2015.
17Load shedding stages have been amended to
create less impact for electricity consumers
• In order to reduce the impact on customers and the complexity of managing
Stage 3 load shedding, Stage 3 has been adjusted down by 1 000MW.
Stage Old schedules New schedules
Stage 1 1 000 MW 1 000 MW
Stage 2 2 000 MW 2 000 MW
Stage 3 4 000 MW 3 000 MWContents Introduction Half-Year Performance Winter Outlook Build programme Conclusion
Build programme shows progress and contributes
MWs to the grid
Medupi Power Station Project (6 x 800MW)
▪ Up to 800 MW contributing to national grid even while unit 6 is still in
test phase /synchronisation mode)
▪ 1st Unit (unit 6) on track for commercialization - August 2015
▪ Synchronization of second unit expected in 2017.
Kusile Power Station Project (6 x 800MW)
The project is making good progress
Synchronization of 1st Unit (Unit 1) expected at the end of the first half
of 2017
Ingula Pumped Storage Scheme Project (4 x 333MW)
Synchronization of 1st unit (Unit 3) has been revised to the first half of
2016
Project Sere (100MW)
▪ Successfully commercialized on time and within budget
▪ 100 MW feeding to the national grid, when the wind blows.
20Eskom needs to ensure capital is available to ensure
delivery of one Medupi and two Ingula units for FY16 xx MW added to
the network
Post MYPD3
• Commissioned in • First sync Mar • Unit 4 to be • Unit 1 to be • Kusile 1 will be
early Feb 2015 2015 commissioned Apr commissioned commercially
• Additional 100MW • Full stable power 2016 Aug 2016 operating Aug
added to the by Jun 2015 2017 2015/16
network 1 466 MW
Medupi x1 unit
100 800 333 333 800
Ingula x2 units
Feb 2015 Aug 2015 Mar 2016 Jul 2016 Aug 2017
Sere Wind Farm Medupi Unit 6 Ingula Unit 4 Ingula Unit 1 Kusile 1 Total MW
5 532
Mar 2015 Jan 2016 May 2016 Sep 2017 2019/2020
Majuba Ingula Ingula Medupi 5 Duvha 3
Recovery Unit 3 Unit 2 Recovery
1200 333 333 800 500
• 600MW from unit • Unit 3 to be • Unit 2 to be • Medupi 5 • Duvha 3 will be
3 gap solution in commissioned commissioned commercial fully recovered in
Feb & 600MW Jan 2016 May 2016 operation date is 2019/2020
from Unit 4 in Mar Sep 2017 • This project falls
2015 out of MYPD3
window
Source: GCD, Team analysis 21Eskom keeps the country informed
• Eskom communicates via the national, regional and local media including social media
regarding its intention to load shed and during the process.
• Load shedding information and schedules are available on Eskom’s website for Eskom
customers
• National and regional spokespersons continue to spread the message and share
additional information to provide information and clarity
• Stakeholders and direct customers are informed predominantly via social media and text
messages and are able to communicate via Eskom’s customer contact centres
• The Power Alert on SABC and DSTV channels continues to provide real-time information
on the power system status and encourages customers to switch off.
- An average of 350MW reduction in demand is observed during this flighting
• Eskom issues Power Alert system bulletins and holds a Quarterly system status media
briefing to provide regular updates
• Face-to-face stakeholder engagements provide an opportunity for further dialogue on the
status
Electricity users are encouraged to follow Eskom on twitter and Facebook and to
download the free Eskom App ‘Myeskom’ from Android and Apple stores.We all can help to reduce demand and ‘Beat the
Peak’ this winter
Saving electricity reduces pressure on the grid, cuts your
electricity bill and reduces South Africa’s carbon emissions
1. Use alternatives to electrical space heating
• Dress for the weather, to postpone switching on space
heaters
• Install ceiling insulation - an insulated room requires 51%
less energy to heat up
• Invest in a thermostatically controlled heater - a fan heater
is ideal for quick heat situations, while an oil heater can be
considered to keep a room warm for longer periods
• Consider gas heaters and hot water bottles to keep warm
2. Switch off all geysers and pool pumps (all day until
9pm), and invest in a timer
3. Switch off all non-essential lighting and appliances
4. Respond to Power Alert messages by switching off all
appliances that are not being used
23Contents Introduction Half-Year Performance Winter Outlook Build programme Conclusion
Conclusion: While the system is tight Eskom
endeavours to keep load shedding to a minimum
• Eskom has continued to supply up to an average of 96% of electricity in the
  country during the first half of 2015 and will continue to do so in Winter

• Unlike in Summer when the load shedding risk is for longer periods throughout
  the day, in Winter, the load shedding risk is for shorter periods and over the
  peak periods of 06:00 to 10:00 and 17:00 to 22:00, as more electricity is used
  during this time.

• As the demand peaks in Winter, we anticipate that 100% electricity supply
  during the day, and a minimum of 96% during the morning and evening peak
  periods

• We will continue with maintenance with the intent to do no or minimal load
  shedding
• We appreciate the support of all our customers and encourage that we maintain
  10% electricity savings.
• We are committed to provide early warning, however at times the system status
  changes rapidly. Please follow us on twitter @Eskom_SA and
  @Eskom_MediaDesk for updates.
                                     25
Thank you
You can also read