EVIDENCE FOR MICROSEEPAGE IN CO2-EOR MONITORING AND VERIFICATION - Ronald W. Klusman Emeritus Professor Colorado School of Mines Golden, Colorado ...
←
→
Page content transcription
If your browser does not render page correctly, please read the page content below
EVIDENCE FOR MICROSEEPAGE IN
CO2-EOR MONITORING AND VERIFICATION

           Ronald W. Klusman
           Emeritus Professor
        Colorado School of Mines
            Golden, Colorado
        rwklusman@earthlink.net

     2019 AAPG Hedberg Conference:
       Hydrocarbon Microseepage
              June, 2019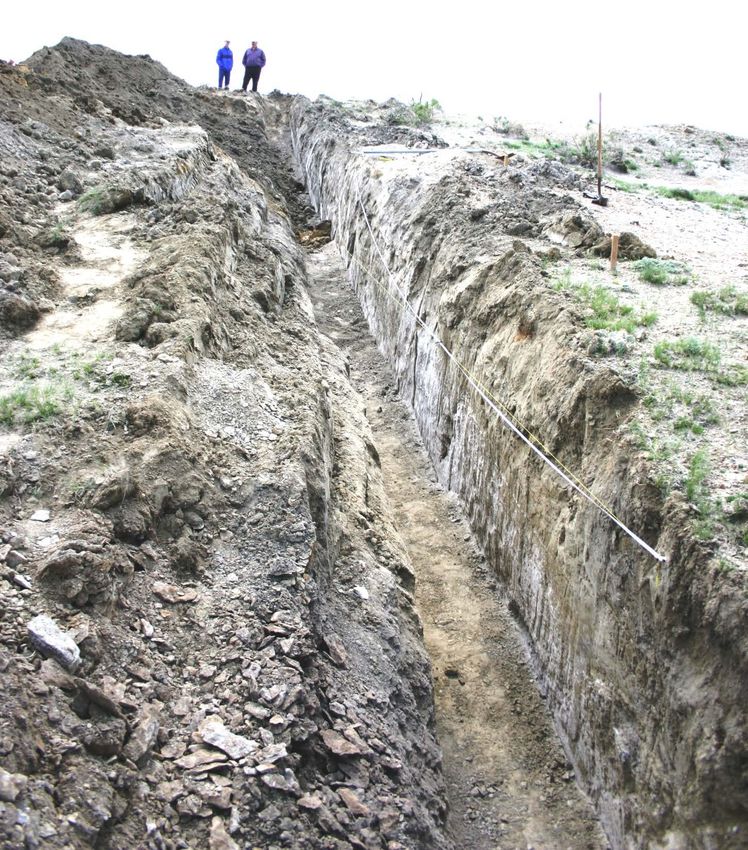
SK
                      Weyburn
                      1600’
                           X

                        Teapot Dome,
                        BSk, 5000-5300’
              WY
                       X
Rangely,          X
BSk, 5300-6300’        X   Test Site,
                           H, 8070’
                  CO

                                TX

                                        X South Liberty,
                                          Cfa, 20’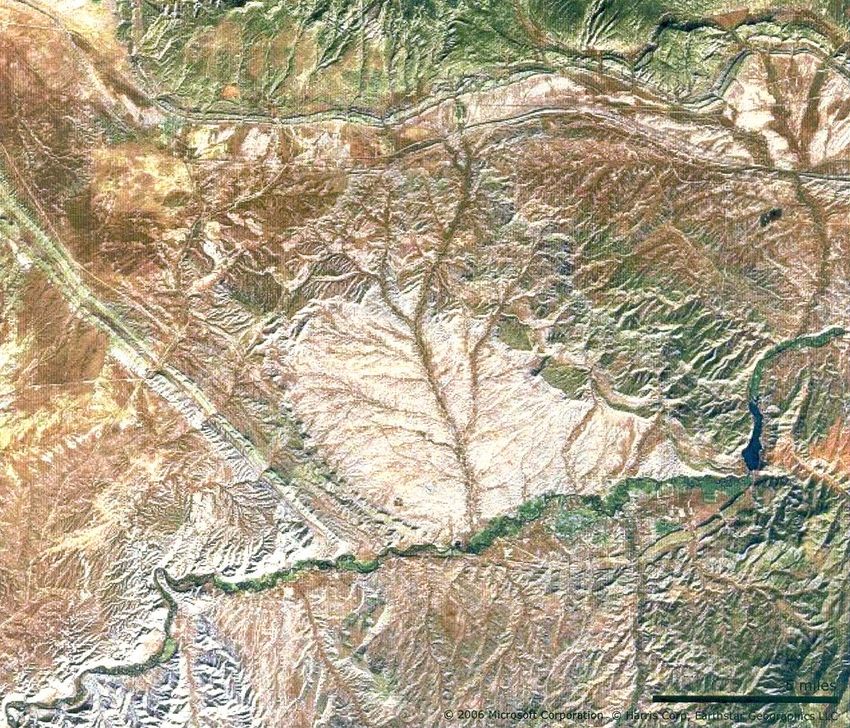
Very Difficult      Open-path
            10 m Sample                             spectrometer
 Dilution

                   intake and                       and sonic
                   tubing to                        anemometer
                   instrument                                Soil Gas
             Difficult                                        Probe Sample
                                                   Chamber            Tube
            Open-path IR                           Difficult
            0
                          Instrument                     1m
                           shack                 Moderately Easy
Dilution

                                Seepage
            10 m                Plume                Rather Easy

                                                                   Sand Fill
PROBLEMS IN MONITORING AND
   VERIFICATION RESEARCH
• Large, open systems,
• Dynamic, where “equilibrium” is only
  occasionally approximated,
• Systematic variation on at least two
  time scales and possibly two spatial
  scales,
• Searching for a small, deep-sourced
  signal in the presence of substantial
  near-surface noise,
• An understanding of the noise is
  essential.
IMPORTANCE OF CO2 AND CH4

• CO2 soluble in, and reactive with water,
• CH4 is not soluble, nor reactive, being
  relatively stable in the subsurface
  environment,
• CH4 likely ubiquitous in early sequestration
  options,
• CH4 is a more mobile molecule when
  overpressured,
• CH4 has a greater GWP if it reaches the
  atmosphere,
• CH4 is explosive.
SUMMER VS WINTER MEASUREMENTS

 • Searching for a subtle signal in the presence
   of substantial surface noise,
 • Microbial oxidation of soil organic matter to
   CO2, and root respiration producing CO2 is
   lower in winter,
 • Methanotrophic oxidation rate of CH4 and
   light hydrocarbons in unsaturated zone is
   lower in winter,
 • Therefore, the best chance of detecting a
   deep-sourced signal for either CO2 or CH4 is in
   the winter or dry season.
Chamber

Collar
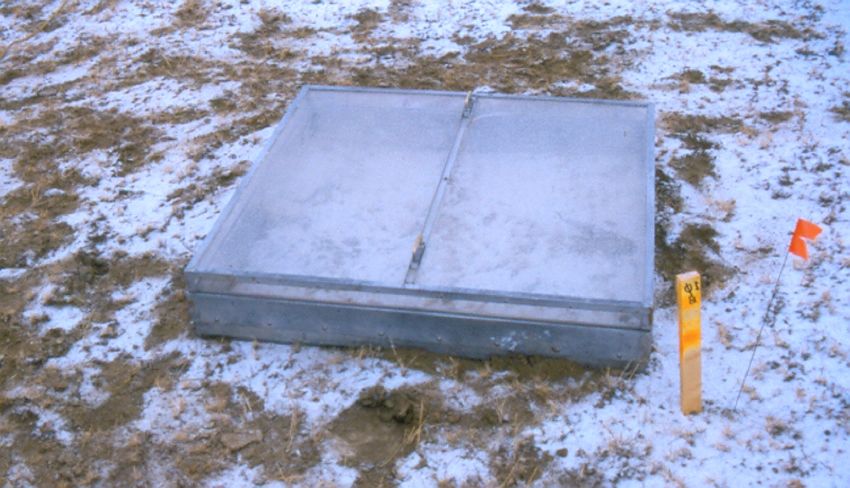
Licor 7000 inside insulating box

                         Three chambers at
                         10-m intervals- a,b,c

                       Laptop computer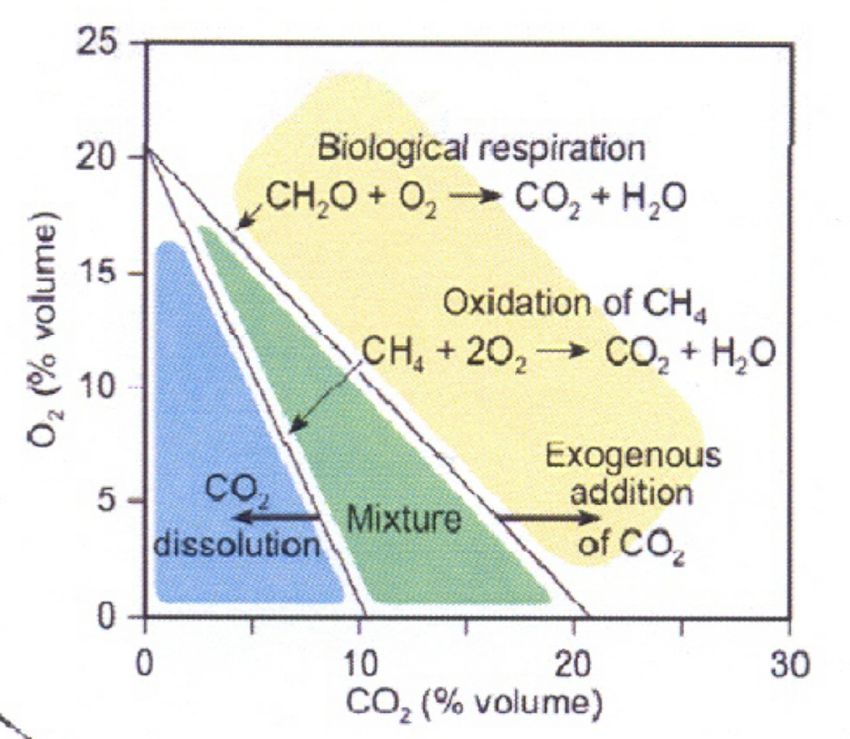
Brass cap with septum
 Soil Gas
Sampling
at 30-, 60-,                            3/8” OD; 1/8” ID
100 cm

                  Soil gas probe
               with annular hammer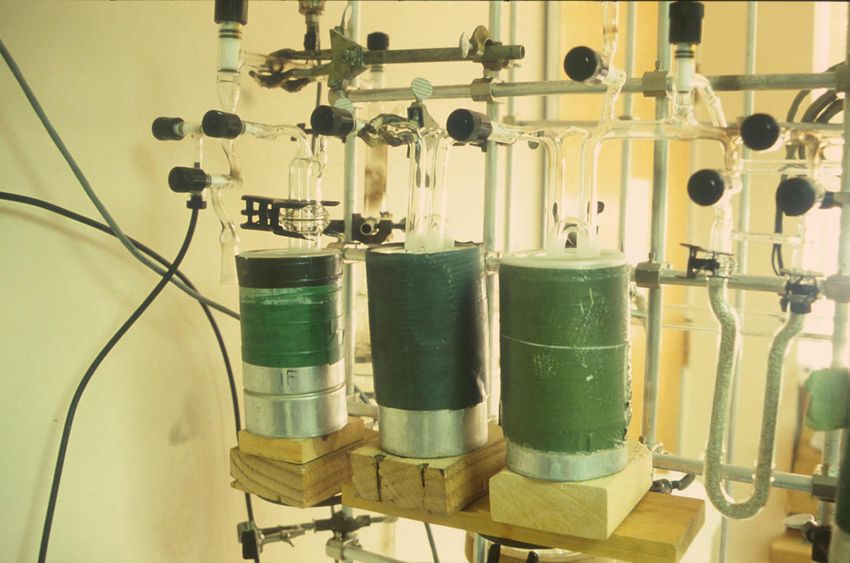
SELECTION OF “INTERESTING”
      LOCATIONS FOR 10-M HOLES

• Magnitude and direction of both CO2 and
  CH4 fluxes,
• Magnitude and gradient of both CO2 and
  CH4 in soil gas profiles,
• Isotopic shift in 60-, and 100 cm soil gas
  CO2 from atmospheric CO2,
• Soil gas contributes more to the selection
  process than gas flux measurement,
• Selected locations with microseepage
  evident, and microseepage absent for
  comparison and contrast.
Bentonite for hydration Fill sand for sampling and sealing interval interval (10-20 mesh)
Tubing and thermocouple wires from
         five depth intervals
Thermocouple Leads Sampling Tubes
Ground Surface
4-in (10-cm)
4-in (10-cm)
PVC pipe
Uncased
1m with cap
Drill Hole
2m
3m
Thermocouple Schematic of
Gas Sampling Tube
10-m Holes
5m (Sampling tubes
at 3, 2, 1 meters
not shown; not
Backfilled Thermocouple
to scale)
Cuttings
2 Gas Sampling Tubes with
Spacer to Separate Tubes
30 cm bentonite
30 cm 10-20 10m
mesh sand Research holes previously used at
Rangely and Teapot Dome had five
sampling intervals; “Monitoring”
holes may only be completed at 1-,
3-, 10-meters.Surface
Oxic
Unsaturated Zone (Aerobic)
Depth
Sub-oxic
(Microaerophilic)
Anoxic (Anaerobic)
Water TableControl
Area
16 Loc.
Mellen
Hill
Fault
10 Loc.
Kenney
Rangely Reservoir
Oil Field
41 Loc.
Raven
Ridge
Rangely
town
White River
0 6 miles10
On-field
Mean = 25.1 mg m-2day-1
Rangely – CH4 8
Median = 0.870
Frequency (n)
Flux; Winter 6
SD = 135.0
2001/2002 4
66
865
2
Note negative 0
flux due to
-10 0 10 20 30 40
10
methanotrophy Control Area
Mean = 1.34 mg m-2day-1
8
Median = 0.753
Frequency (n)
SD = 1.99
6
4
2
0
-10 0 10 20 30 40
Flux (mg m-2 day-1)RANGELY –
0
Summer, 2002
Anomalous Hole 01
2
Depth (m)
4
Carbon Dioxide 6
8
Summer, 2001
Winter 2001/02
10
0 10000 20000 30000
40000
40000
Carbon Dioxide (ppmv)
0
Deep
2 Source
Depth (m)
4
Summer,
δ13C of CO2 relative 6 2001
to the atmosphere
Winter,
8
Summer, 2002
2001/02
10
-15 -10 -5 0 5
δ13C of CO2 relative to the atmosphere (‰)0
RANGELY –
Non- anomalous 2
Depth (m)
Hole 28 4
Winter,
2001/02
6
Summer,
2001
Carbon Dioxide 8
10
0 500 1000 1500 2000 2500
2500
Carbon Dioxide (ppmv)
0
2
Winter, 2001/02
No deep
δ13C of CO2 relative
Depth (m)
4 source
to the atmosphere
6
Summer, 2001
8
10
-12 -10 -8 -6 -4 -2 0 2 4
δ C of
13 CO2 relative to the atmosphere (‰)0 ●
1 ●
Isotopic shift in δ¹³C of CH4 2 ●
in anomalous 10-m Hole 03 3
Diffusion + ●
Depth (m)
at Rangely 4 Methanotrophy
5 ●
6
7 Diffusion
Summer, 2002 8
9 ●
10
-50 -45 -40 -35 -30 -25 -20 -15 -10
0 ●
1 ●
Diffusion +
2 ●
● Methanotrophy
Depth (m)
3
4
Winter, 2001/02 5 ●
6
Diffusion
7
8
9 ●
10
-50 -45 -40 -35 -30 -25 -20 -15 -10
δ C
13 of CH4 (‰)0 ■
■
Isotopic shift in δ¹³C of CH4
1
2 ■
in non-anomalous 10-m 3
Hole 34 at Rangely Diffusion
Depth (m)
4
5 ■
6
7
Summer, 2002 Methanotrophy
not evident
8
9 ■
10
-50 -45 -40 -35 -30 -25 -20 -15 -10
0
1
2
Depth (m)
3
4
5
Diffusion
Winter, 2001/02 6
Methanotrophy
7
not evident
8
9
10
-50 -45 -40 -35 -30 -25 -20 -15 -10
δ13C of CH4 (‰)3505,3923 ---2.64,---2.00
2285 ---2.58
2384 ---2.28
2098 ---2.14
2727 ---2.30
+++19.9
3464
4047
---2.84
---2.29
2012
---2.91
2340
-+-1.37,---2.27
4141,4577
CO2 in 100 cm soil gas Isotopic shift of CO2 and CH4 in
(winter 2001/02) 100 cm soil gas (winter 2001/02)N
02 0 1 mi
19 0 1 km
Tensional faults S2 Faults
and fractures form 17
Surface Fault Traces
and fill with 18
by Mark Milliken
calcite veins as a
function of Fault Traces Projected
hydrocarbon to Surface from 3-D
leakage Seismic and Calcite
Teapot Veinlets by Tim
Winter, McCutcheon
2004
CO2 Flux S1 Faults
Percentile
Section 10 >75th
>50-75th
25-50thTEAPOT DOME – 10-m CUTTINGS
δ13C OF CARBONATE CARBON
O2,
H2
O
L17
L 19
L18
CaCO3(
s)
CH4
± 1s
Precipitation of CaCO3 at perched
water table using atmospheric CO2TEAPOT DOME – LIGHT HYDROCARBONS IN
ANOMALOUS 10-m HOLE 17; JANUARY, 2005
-2
Atmosphere
0
2
CH4
Depth (m)
4
6
8 C3H6 C2H6
10
C2H4 C3H8
n-C4H10
12
0.01 0.1 1 10 100 1000 10000
Hydrocarbon (ppmv)TEAPOT DOME – LIGHT HYDROCARBONS IN
ANOMALOUS 10-m HOLE 17; JANUARY, 2005
Aerobic (Oxic)
Microaerophilic (Sub-oxic)
20 m
Anaerobic (Anoxic)TEAPOT DOME – LIGHT HYDROCARBONS IN
NON-ANOM.10-m HOLE 02; JANUARY, 2005
-2
Atmosphere
0
C2H4 CH4
2
Depth (m)
4 Aerobic (Oxic)
6 C2H6
C3H6
C3H8
8 n-C4H10
10
12
0.0 0.5 1.0 1.5 2.0 2.5 3.0 3.5 4.0
Hydrocarbon (ppmv)RELATING BIOGEOCHEMICAL PROCESSES
TO METHANE CONCENTRATION AND δ13CCH4
Residual from Methanotrophic
Oxidation of Atmospheric CH4
Atmospheric
Increasing intensity of Concentration
methanotrophic oxidation
Residual from methanotrophic
oxidation of reservoir gas
Sampling +
Analytical Error
Dilution of reservoir gas
Compositional fractionation Methano- Residual
genesis CH4 with
during transport of reservoir gas no frac.
1,000,000 100,000 100 10 1 ppmv
ln(1/CH4) (ppmv-1)TEAPOT DOME – 10-m HOLES; Jan. 2005
Atmospheric
Concentration
10-m Hole
Location Depth
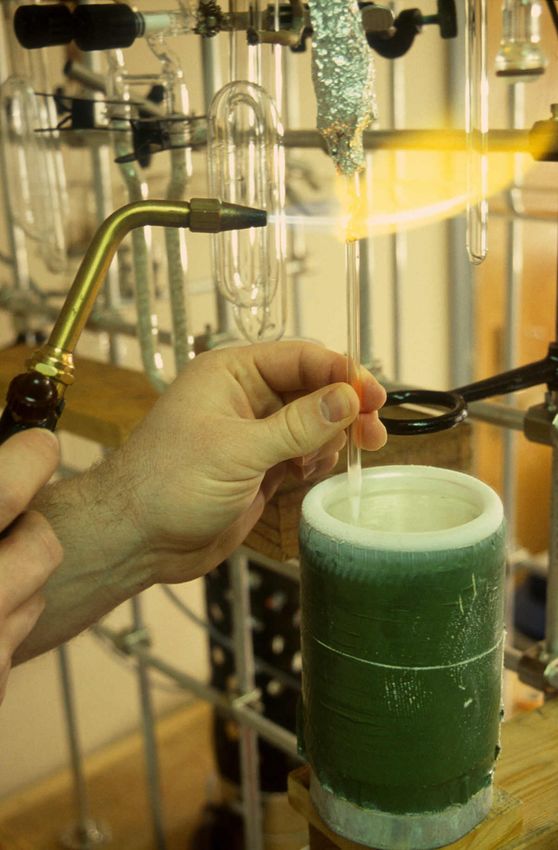
Mixing Line10 liter laboratory-
evacuated container CO2-free air to purge
for collection of soil line during connection
gas to be purified for between soil gas interval
carbon-14 determination and evacuated container
on carbon dioxide
Valve, vacuum
gauge, valve
Tubing from selected depth
intervals of 10-m holeStepwise flow in vacuum line
Liquid
Dry ice +
nitrogen Liquid
ethanol
nitrogen
Measured volume
of soil gas sample
from container
Mass flow
controllerBreak-seal tube
Liquid
nitrogen
Frozen CO2 for AMS
determination of
carbon-14 contentRANGELY – C-14 IN CO2 FROM 10-m HOLES (VERIFICATION)
TEAPOT DOME – CARBON-14 IN CO2 FROM 10-
m HOLES; JANUARY, 2005 (VERIFICATION)
         -2
                                                               Atmosphere
              0
                     Hole 18
              2
  Depth (m)

              4                                           Hole 19
                                          Hole 06
              6

              8   Hole 17                                           Humic substances
                                                         Hole 02    plus weathering
                                                                    of Steele Shale
        10

        12
                           40K 20K       10K        5K                1K      0
        14
              -0.2        0.0        0.2      0.4     0.6     0.8           1.0
                                      Fraction of Modern Carbon

                                      Radiocarbon Age (Years)
ESTIMATION OF CH4 MICROSEEPAGE
INTO THE ATMOSPHERE AT RANGELY –
(a start on ACCOUNTING)
• The gross CH4 microseepage into the
atmosphere over 78 km2 is 700±1200
tonnes year-1 using the winter rate*
• The net CH4 microseepage into the
atmosphere is 400 metric tonnes year-1
±?, subtracting the control area from
the on-field data.
• *non-parametric estimated rate is positive with α =
0.015.COMPARISON OF MODELED AND
MEASURED METHANE FLUX
The modeled CH4 flux from the Rangely reservoir
was 59 mg m-2 day-1.
Summer: 3.59/59 = 0.06, suggesting that ≈ 94%
was oxidized in the unsaturated zone; Rangely
field only; 4.86/59 = 0.08 or ≈ 92% was oxidized.
Winter: 17.8/59 =0.30, suggesting that ≈ 70%
was oxidized in the unsaturated zone; Rangely
field only; 25.1/59 = 0.43 or ≈ 57% was oxidized.
Dividing 0.43/0.08 = 5.4; The signal/noise improved
by a factor of 5 in the winter.COMPARISON OF PETROLEUM SYSTEMS
BY SEEPAGE CLASSIFICATION
Rangely Teapot Dome
-2 -1
Summer Winter Summer Winter
CH4 Flux (mg m -2 d -1) 3.59 17.8 - 0.137
100 cm CH4 (ppmv) 21.7 759. - 2.78
Methanotrophy High High - High
Isotopic Evidence Strong Strong - Strong
Seepage System Active Active - Passive
CH4 Flux (tonnes a-1) 400-700 2.1± 1.2
Aliso Canyon blowout– 100,000 tons in 4 months44-1 TPX 10
Proposed                                                                 Un-named
                                                 x                                                Gradient in CH4
Injection                                                                drainage                 > 1.00 ppmv/meter
   Well                                      x                                                    >0.30 ppmv/meter
                                                         x
                                x                                                                 x indeterminate
                                                     x           x
Proposed
■ Un-named ■ Detectable C2H6 in
Injection drainage 100 cm soil gas
Well
■ ■ ■TRENCH 87-10W
Bentonite-rich “soil”
Konyaite bloom
forms overnight
Na2Mg(SO4)2·5H2O
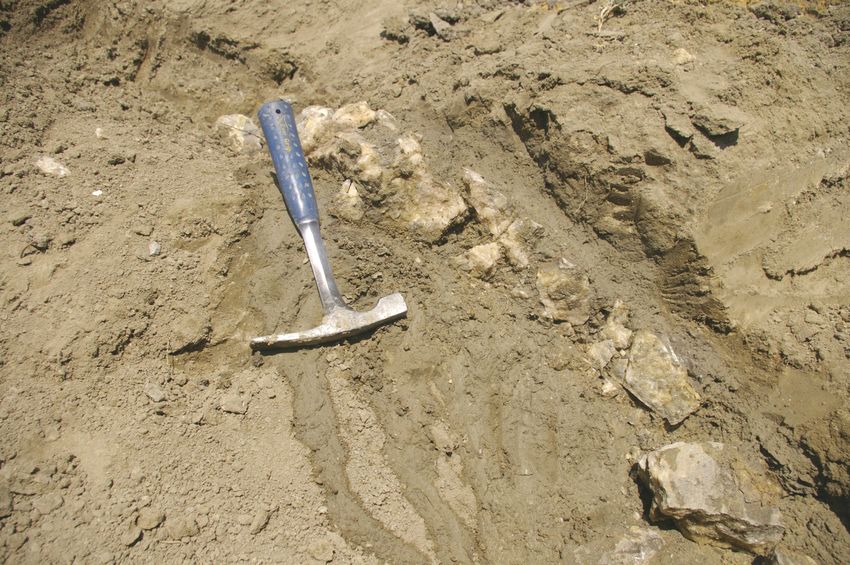
Sussex sandstone chips
with CaCO3 in partingsCoarse-grained calcite in 87-10E
TEAPOT DOME - SECTION 10 – TRENCHES
             (p ) 87-10W and 87-10E
                                           (?)
                      0

                                                                               Pedogenic
                                                                          18
                                                                           O = f(lat./elev.)
δ13C of CaCO3 (‰)

                     -5
                                                                              T=8.08 C
                                                                           Natrona Co.
                                                                                 =7.94 C
                    -10

                           Fault/fracture CaCO3               Physically mixed
                          (Hydrocarbon oxidation)             sample material
                    -15

                    -20
                           -14       -12              -10            -8            -6
                                                 δ18O of CaCO3 (‰)
SUMMARY OF SURFACE GEOCHEMICAL
MEASUREMENTS AT WEYBURN
British Geological 07/2001 CO2 flux, soil gas
Survey +Italian, CO2, CH4, light HC, Rn
French 09/2001 ditto
investigators 09/2002 ditto
10/2003 ditto + He
10/2004 ditto + He
10/2005 ditto + He
KERR Farm
Paul Lefleur 08/2010 soil gas CO2, CH4, LHC
02/2011 ditto
Gilfillan+Haszeldine06/2011 GW inert gas + isotopes
Romanak 8-09/2011 soil gas CO2, CH4, LHC, He
BGS + It., Fr. 10/2011 ditto + He
Wolaver et al. 2011 GeohydrologySUMMARY OF LEFLEUR FINDINGS
AT KERR FARM
· Both CO2 and CH4 had lower concentrations in
winter measurements relative to summer,
· Minor C2+ light hydrocarbons were found at
2-3 locations out of 30 locations measured,
· An anomalous CO2 location had a δ13C of
-23.5‰, similar to the injected CO2 from Buelah,
ND coal gasification plant,
· High correlation of CH4 to C2H6 at a few locations.
PAUL LEFLEUR CONCLUSION: There is leakage of
reservoir gases to the surface on the Kerr farm.PROCESS CONTROLLED O2-CO2 (from Romanak, 2011)
O2-CO2 at Kerr farm (from Romanak, 2011)
CO2-N2/O2 at Kerr Farm (from Romanak, 2011)
He – Ne Isotopic Ratios (from Gilfillan and
   Haszeldine, 2011) VERIFICATION
He – Ar Isotopic Ratios (from Gilfillan and
   Haszeldine, 2011) VERIFICATION
Kerr farm - summer                        Rangely CO2-EOR - summer
                                Land surface

   Organic C + O2   CO2 (high CO2)        Organic C + O2    CO2 (high CO2)

                                           CH4 + O2        CO2
                                                           (low CH4)
   CH3COO- + H+     CO2 + CH4
                    (high CH4)                     Methanotrophy
                                                   accelerates
      Methanogenesis
      accelerates                                         Gas
                                                      Microseepage
                                                        with CH4

 Subsurface                                                           Subsurface
temperature                                                          temperature
 gradient                                                              gradient

                                 (a)
Kerr farm - winter Rangely CO2-EOR - winter
Land surface
slow slow
Organic C + O2 CO2 (low CO2) Organic C + O2 CO2 (low CO2)
slow
CH4 + O2 CO2
slow
(high CH4)
CH3COO- + H+ CO2 + CH4
(low CH4) Methanotrophy
slows down
Methanogenesis
slows down Gas
Microseepage
with CH4
Subsurface Subsurface
temperature temperature
gradient gradient
(b)Klusman, 2011- Alternative Interpretation
of Lefleur, 2010, 2011 Data
• Injected CO2 from Buelah, ND reacts with
reservoir carbonate rock with δ13C of ≈ 0‰
to produce a produced fluid of -10 to -12‰.
The soil gas δ13C of -23‰ is consistent with
normal soil respiration, not leakage.
• The relative concentrations of CO2 and CH4
in summer and winter are consistent with a
methanogenic source for CH4. Slowing of
microbiological processes in winter reduces
the CH4 concentration. If there was leakage,
there would be increased CH4 in winter due
to slowing of methanotrophic oxidation.
CONCLUSION: Lefleur data is also consistent
with a conclusion of “No Leakage” on Kerr farm.Dangerous levels of leakage requiring
Methane
immediate project shut-down.
flux
(mg m-2d-1)
Moderate levels of leakage com-
promising environmental and
rice paddy
83 to 114 economic goals; ±~ 1% per year.
temperate
wetland 30.2
Low levels of leakage that are readily
detectable but do not compromise
Rangley 17.8
Dawanqi 17.0 environmental and economic goals;
Yakela ~0.01% year
fault 7.55
Rangley 3.59
Yakela 2.89
Teapot 0.14 Barely detectable, but not “quantified”
Liberty -.08
Liberty -2.31OVERALL CONCLUSIONS • Monitoring protocols will need to be developed for each project that reflects climate, geology, and accommodates normal cultural and environmental interferences at the surface, • No single method is likely to be completely satisfactory for most sites, • Measurement of carbon-containing gases is strongly supported by liberal use of isotopes, • Take advantage of faults as pathways from the subsurface for early detection, • Initially, seasonal variation in fluxes and soil gas concentration gradients will be needed, • Winter, and/or dry season will allow subsidence of environmental noise and improvement of signal/noise ratios, • Verification will likely require non-routine methods including carbon-14 and inert gas isotopic ratios.
I try to do good research, but it is necessary
to work in the dirt, and live in this cloud of
“isotopically light” CO2.
ACKNOWLEDGEMENTS
Rangely – U.S. Dept. of Energy-Basic Energy
           Sciences for funding;
         - Chevron Production USA for access to
           confidential reservoir characterization
           documents, reservoir water quality data,
           reservoir pressure data, and backhoe for
           soil characterization in trenches.

Teapot Dome – Rocky Mountain Oilfield Testing
          Center (RMOTC) for funding;
        - Naval Petroleum Reserve No. 3 for field
          access and data, and backhoe for soil
          profile characterization, fault trenching.
You can also read