Exploiting Bolivia's Natural Gas Resources - Kenneth B Medlock III Peter Hartley James A Baker III Institute for Public Policy - Baker Institute
←
→
Page content transcription
If your browser does not render page correctly, please read the page content below
Exploiting Bolivia’s Natural Gas Resources

                Kenneth B Medlock III
                   Peter Hartley

           James A Baker III Institute for Public Policy
                       Rice University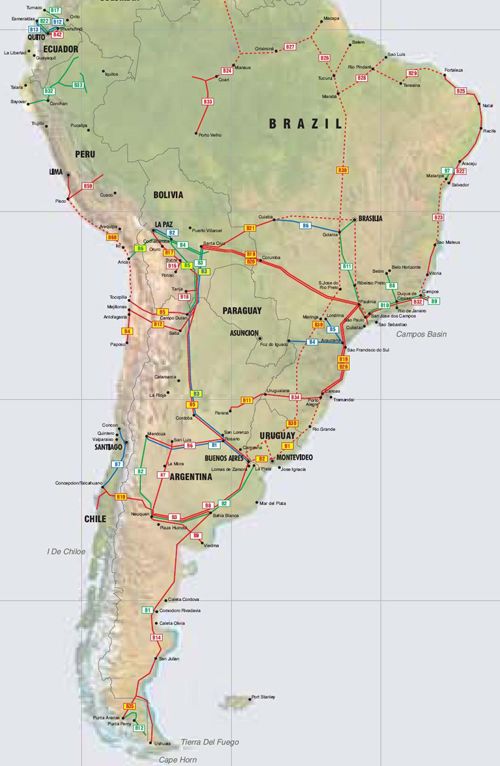
Regional Natural Gas Resources
•   Proved reserves are recorded only where development has occurred

•   Resource potential is about triple proved reserves and is distributed differently
Regional Natural Gas Consumption
•   Bolivia is relatively more important as an exporter in part because its domestic
    consumption is relatively low compared to its relative resource endowment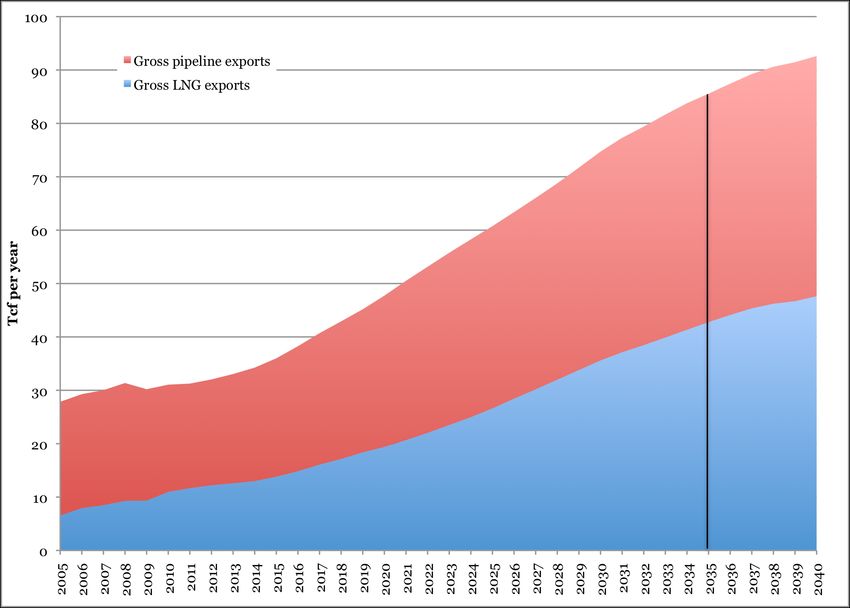
Bolivia International gas trade

• Bolivia also has a central location with
pipeline connections to surrounding
countries
• It also has opportunities to connect to
more locations
• Bolivia also has the potential to arbitrage
price differences in different regional
markets, making it a potential “trading
hub”
• In 2006, Bolivia joined a regional
pipeline project aimed at connecting
Venezuela to Argentina, but its viability is
questionable
The RWGTM overview
• The Rice World Gas Trade Model (RWGTM) was developed to examine
  potential futures for global natural gas, including quantifying the impacts of
  geopolitical influences on global natural gas market developments
• The model predicts regional prices, regional supplies and demands and
  inter-regional flows
• Regions are defined at the country and sub-country level, with extensive
  representation of transportation infrastructure
• The model is non-stochastic, but it allows analysis of many different
  scenarios. Geopolitical influences can alter otherwise economic outcomes
• The model is constructed using the MarketBuilder software from Altos
    – It is a dynamic spatial general equilibrium linked through time by Hotelling-
      type optimization of resource extraction
    – Capacity expansion is determined by current and future prices along with
      capital costs of expansion, operating and maintenance costs of new and existing
      capacity, and revenues resulting from future outputs and prices.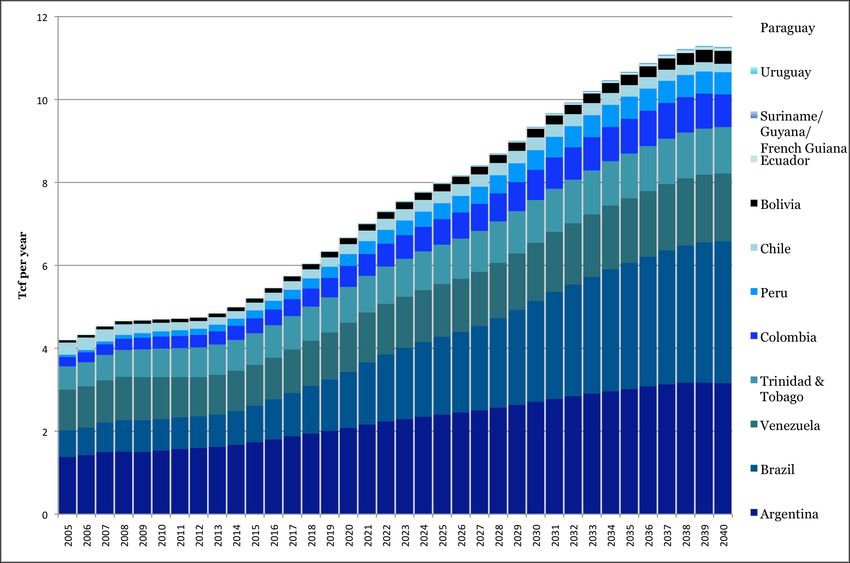
Reference Case Supply
Reference Case Demand
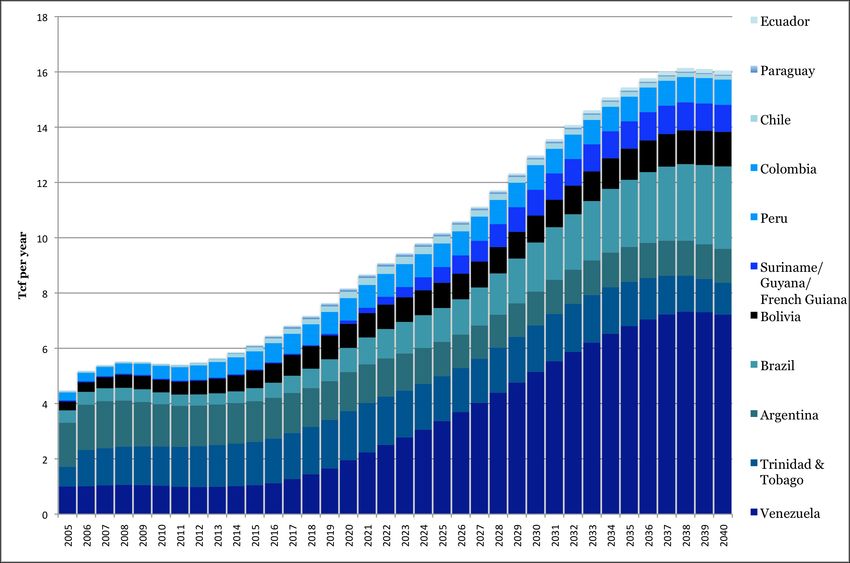
Reference Case exports
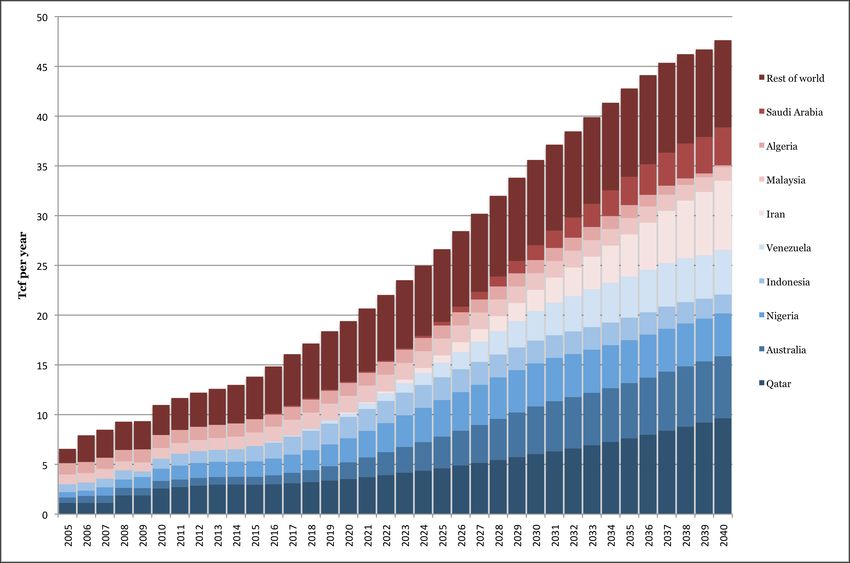
Reference Case LNG exports
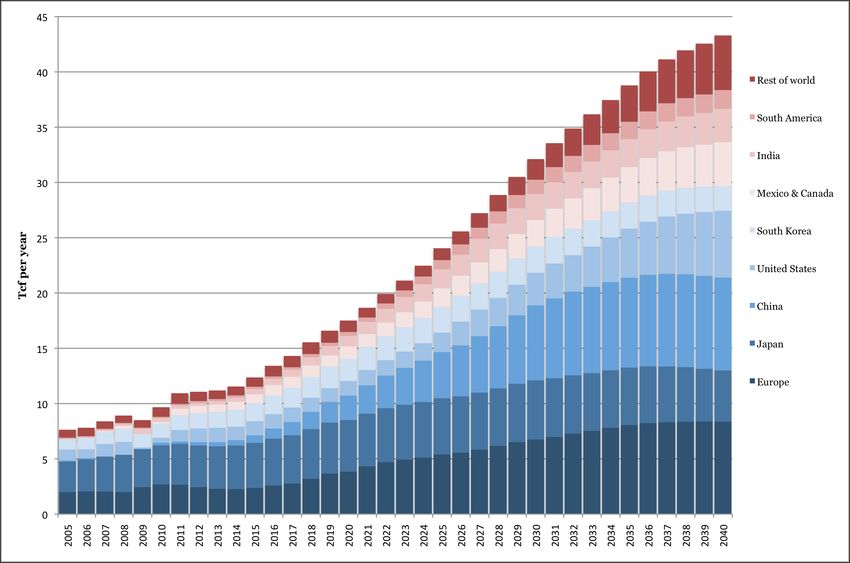
Reference Case LNG imports
South America supply – Reference Case

•   Venezuela supply grows to account for about 40% of South American supply
•   Late growth in Brazil from offshore developments.
•   Argentina declines
•   Bolivian growth is steady
South America demand– Reference Case

•   Demand growth strong in most countries, particularly for power generation (not
    shown separately)
•   Strong growth in Brazil and Argentina raise the importance of Bolivian supply to
    balancing the market
South America LNG trade – Reference Case
• Venezuela, Trinidad, Suriname and Peru all ultimately export LNG
• Strong demand growth pushes Argentina, Brazil and Chile into LNG
• Once LNG is imported, there are many substitutes for Bolivian gasDisposition of Bolivian supply – Reference Case
• Disposition of Bolivian Supply
– Steady demand growth in Bolivia at 3.1% p.a., largely driven by power demand.
– Export growth is initially strong, but the Brazilian market looks less attractive after the
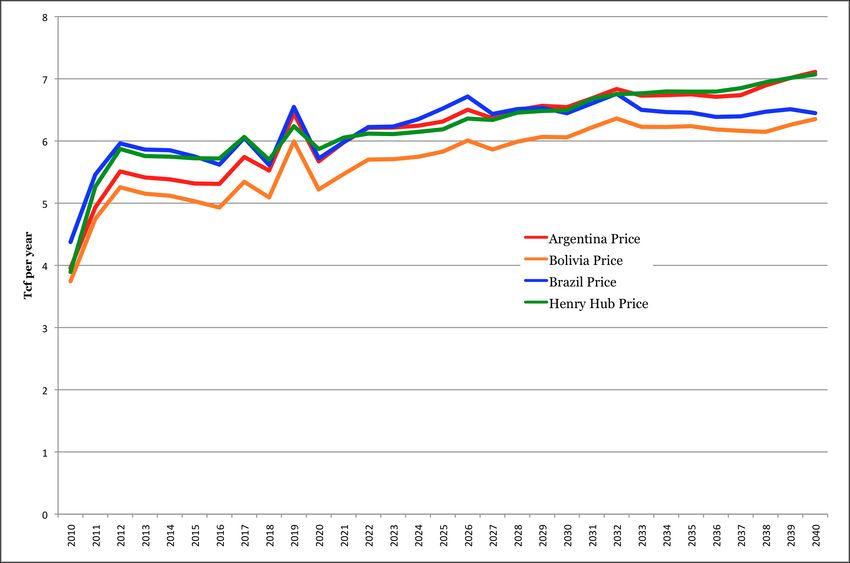
2020 due to strong growth in Brazilian offshore production.South America prices – Reference Case – Brazilian prices tend to flatten reflecting the onset of profitable extraction of offshore domestic resources. This also results in falling imports from Bolivia. – Argentina prices continue to climb, reflecting connection to global market (note trend compared to Henry Hub). This also means imports from Bolivia remain strong. – Bolivian netback to Argentina climbs, but falls to Brazil. Exports to Brazil are eventually limited to Brasilia, as long haul shipments to the coast are not competitive.
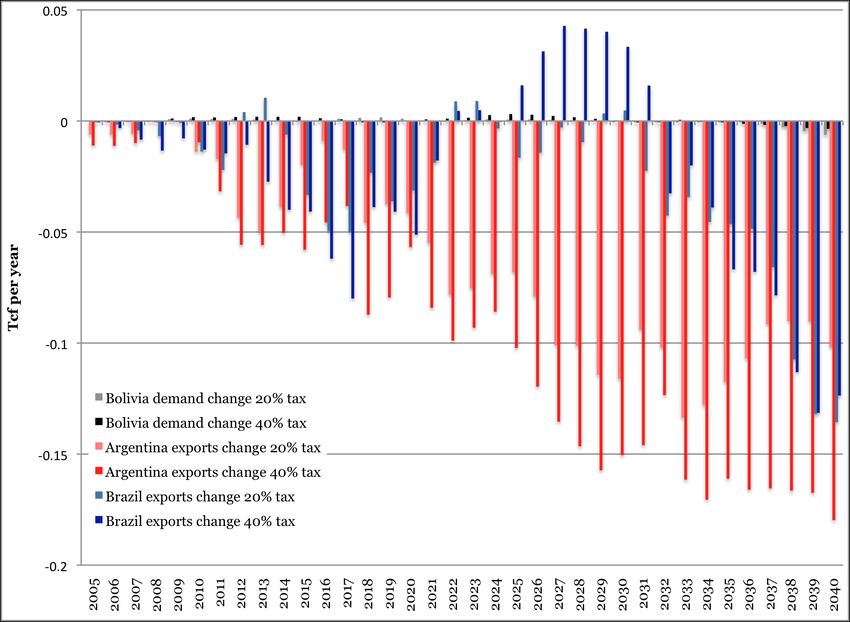
Pipeline export taxes and use of Bolivian gas
Price changes from export pipeline taxes
Export net gains with pipeline export pipeline taxes
Changes in LNG with 20% export pipeline taxes
Changes in LNG with 40% export pipeline taxes
Scenario Analysis: Nationalism and Upstream
                      Development

• In these scenarios, we raise the required rate of return on investments in
  the Bolivian upstream sector
    – The Bolivian government may offer less favorable contractual terms to non-
      Bolivian upstream companies
    – If the risk of abrogation of existing or future contracts to mineral rights is
      deemed high, then foreign investors will require higher returns on capital in
      Bolivia’s upstream sector
• Two scenarios raise the rate of return on upstream investments by 5% and
  10% above the competitive rate of approximately 15%
Higher development risks and use of Bolivian gas
Price changes caused by higher development risks
Export revenue change from higher development risks
Export revenue change from 40% tax and 10% premium
Closing remarks
•   Bolivia has limited ability to extract rents from its target export markets
•   The mature upstream sector in Argentina limits its sources for supply
    substitution to LNG
•   Nevertheless, Argentina demand for Bolivian exports is more elastic in response
    to the Bolivian policy changes
     • In the short term, increased Chilean LNG imports also enable Argentina to
         avoid Bolivian imports
•   Brazilian demand for Bolivian exports might increase a small amount in the
    medium run, but will decline in the short and especially very long run
     • A curious result politically is that Venezuela becomes an alternative source
         of natural gas for Brazil, reducing its LNG exports to do so
     • Peru and Trinidad and Tobago provide a small offset to reduced Venezuelan
         LNG exports from South America
     • Brazilian offshore resources also limit the increase in Brazilian prices
•   Argentine prices tend to rise more consistently as a result of the Bolivian actions,
    but the effects are complicated as major projects are shifted through time
Closing remarks
• Under the pipeline taxes, net gains on exports are slightly positive in the first few
years but quickly turn strongly and consistently negative
• If Bolivian policies raise the perceived risks of producing there, the resulting fall
in Bolivian supply negatively affects Argentina, Brazil and especially Bolivia itself
• In contrast to the tax policy that affects exports only, prices generally rise.
Although this can increase export revenues in some years, the rise in domestic
prices also makes Bolivian consumers worse off
• A combined export pipeline tax and increase in required return has strongly
negative effects on Bolivian export revenues
• Nationalism can severely hamper Bolivia’s upstream profitability by reducing
investment and prodding importers to develop alternative supplies
• The government must balance the public’s desire to “own” the resource with
broader goals of economic growth. Inflows of foreign capital are necessary for
Bolivia’s resource potential to be realized.Extra slides
A Brief History of the Bolivian Natural Gas Industry

• Nationalization and privatization has occurred more than once

• Privatization of the natural gas sector in the mid-1990’s attracted foreign
  E&P capital, increasing proved reserves 6-fold through the early 2000’s.

• In 2003, Bolivia’s government approved a Repsol-YPF led project,
  despite public opposition, to ship natural gas to Chile for export as LNG.
    – The decision catalyzed protests culminating in the resignation of President Sanchez

• A public referendum in late 2004 indicated significant displeasure with
  Sanchez’s energy policy

• In May 2006, President Morales re-nationalized Bolivia’s hydrocarbon
  resources and renegotiated export contracts with Argentina and Brazil
How much “rent” does Bolivia have to exploit?
• The impact of the re-nationalization is not yet certain
– Bolivia’s ability to protect and expand exports depends on having a first mover
advantage
– Nevertheless, capital inflow to Bolivia, including from Brazil and Argentina, has
dropped dramatically since 2003.
– Other sources (LNG, domestic production in Brazil, pipelines from Venezuela)
could leave Bolivia’s gas untapped if Bolivia tries to extract too much
• The government take in Bolivia now is about 70%, or almost 20
percentage points greater than other countries in the region
• To examine how much rent Bolivia could exploit, one needs a model of
the international gas market since many of the competing sources
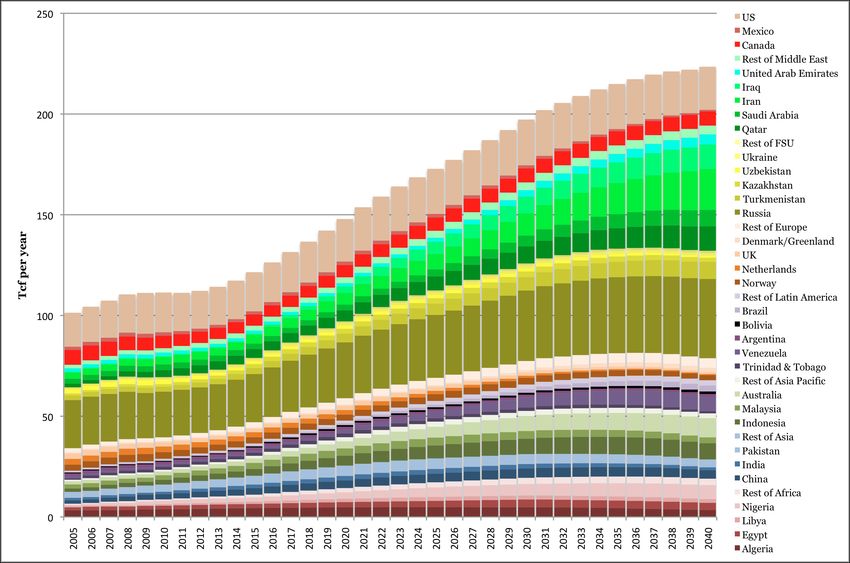
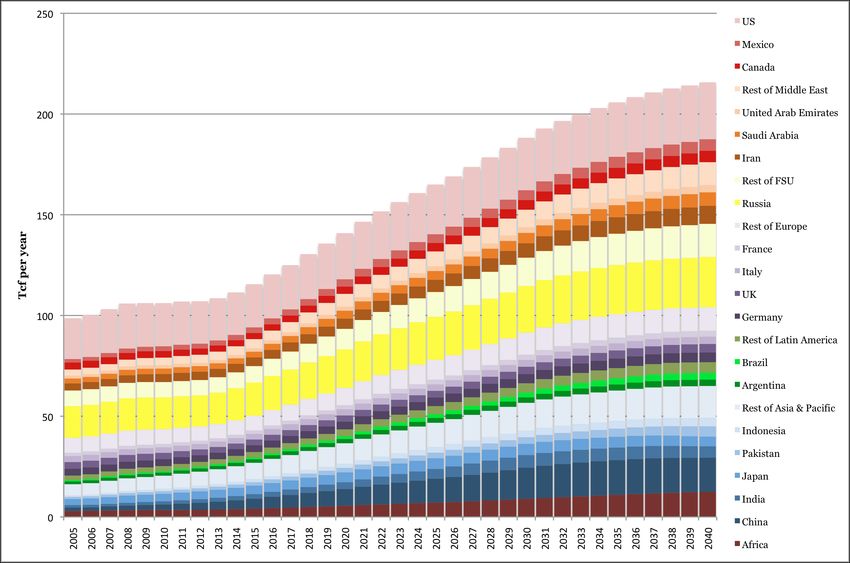
could come from elsewhere in the worldWorld natural gas demand and potential supply (USGS estimates)
Bolivia in a global gas market:
Two existing market outlets –
Argentina and BrazilThe RWGTM demand
– Over 290 regions.
• North America (Residential, Commercial, Industrial, Power Gen)
• Rest of World (Power Gen, Direct Use, EOR)
– Population growth taken from the UN median case projection to 2050.
– Economic growth is based on conditional convergence to historical US growth
rates at various levels of per capita income
– Energy intensity falls as income rises (see Medlock and Soligo, EJ 2001)
• Estimated using dynamic panel regression (134 countries)
• Dependent variable ln(intensity)
– The natural gas share of total energy increases with income, reflecting natural
gas as a premium fuel, but declines with relative price increases
• Estimated using dynamic panel regression (32 countries)
• Dependent variable ln(-ln(share)), implying price elasticity is low at very high or very
low natural gas shares
• For the rest of the world, estimated the electricity share in total natural gas demand using
dynamic panel regression (31 countries)
• Dependent variable again ln(-ln(share))The RWGTM supply
– Over 120 regions
– Natural gas resources are represented as…
• associated and unassociated natural gas resources,
• conventional, CBM and shale deposits in North America, Europe, China;
CBM and conventional in Australia; and conventional deposits elsewhere
– … in three categories
• proved reserves (updated 2006 Oil & Gas Journal estimates)
• growth in known reserves (P-50 USGS estimates and NPC estimates)
• undiscovered resource (P-50 USGS estimates and NPC estimates)
– North American cost-of-supply estimates were econometrically related
to play level geological characteristics and applied globally to generate
costs for all regions of the world
• Long run costs increase with depletion
• Short run adjustment costs limit the “rush to drill” phenomenon
• We allow technological change to reduce mining costs longer termThe RWGTM investment
• Required return on investment varies by region and type of project (using
ICRG and World Bank data)
• Detailed transportation network
– Pipelines aggregated into corridors where appropriate.
– Capital costs based on analysis of over 100 pipeline projects relating project cost
to various factors
– Tariffs based on posted data, where available, and rate-of-return recovery
– LNG is represented as a hub-and-spoke network, reflecting the assumption that
capacity swaps will occur when profitable
– LNG shipping rates based on lease rates and voyage time.
• For all capital investments in both the upstream and midstream, we allow
for existing and potential pipeline links, then “let the model decide” optimal
current and future capacity utilization.
• For detailed information please see Peter Hartley and Kenneth B Medlock
III, “The Baker Institute World Gas Trade Model” in The Geopolitics of
Natural Gas, ed. Jaffe, Amy, David Victor and Mark Hayes, Cambridge
University Press (2006).You can also read