Linkages among China's 2030 climate targets - IDDRI Xin WANG 17 Feb. 2016
←
→
Page content transcription
If your browser does not render page correctly, please read the page content below
Linkages among China’s 2030 climate targets

                 Xin WANG
                   IDDRI

                 17 Feb. 2016

                                              1
Preamble

Objective:
• Presentation of some key results of the paper “Exploring linkages
  among China‘s 2030 climate targets” published at CPJ 2016
       Co-authored with Shuwei ZHANG

Policy and target coherency is one of my major research areas
• Another paper on instrument coherency (ETS and FIT):
  • Lin, W., Gu, A., WANG, X., Liu, B., 2015. Aligning emissions trading
     and feed-in tariffs in China, Climate Policy, DOI:
     10.1080/14693062.2015.1011599

                                                                           2
Plan
1. Context
2. Method
3. Key results
3Increasing green quantitative targets in China
• Facing increasing domestic/international challenges on climate, energy
and environment, China introduced for the first time quantitative and
obligatory environmental targets in its 11th Five Year Plan (FYP)
(2006-2010)
• Energy per GDP intensity; Local pollutants emissions control (SO2, COD, etc.)
• Cf. quantitative targets in previous FYPs only on economic and development issues
• “Obligatory” indicates linking target achievement to career promotion of regional head
officials
• In 12th FYP (2011-2015), new environmental targets are added:
• CO2 per GDP intensity (carbon intensity); new local pollutants, etc.
• Prolonging and reinforcing existing targets
• With the general target of transition
• Green and low-carbon
• Restructuration of economy
• Innovation and domestic consumption driven growth
4of efficiency and improvements in economic performance. The 12th carbon pricing turns out to be a p
FYP should facilitate access to financial credits and capital for high the investments and induce gra
efficiency firms by redirecting economic resources to high produc- behaviour (e.g. use more public
tivity and low carbon intensive sectors. private cars, buy energy saving pr
Besides drastic improvements in energy efficiency, the struc- In fact, several economic in
tural effect also plays a determining role in reducing carbon introduced during the 11th FYP
emissions through sectoral adjustment by shifting the economy export of resources and energy int
from high carbon intensive to lower carbon intensive and high VA tax, export VAT refund rebate, exp
sectors (illustrated in Annex). Chapter 6 of the Plan outlines policy been implemented massively sinc
guidelines and actions to be taken. It advocates comprehensive being initially claimed for larger
measures for adjusting the industry and energy structure, energy resource conservation concerns a
conservation and energy efficiency improvement, increasing for- generating neither unique and ex
est carbon sinks and other means to substantially reduce the able political signals (Wang and
intensity of energy consumption and carbon dioxide emissions, domestic carbon pricing policies
which would allow for the effective control of greenhouse gas Some policy think-tanks propose
emissions with minimised impact on economic growth. alike cap- and trade- mechanism
some industry and energy sectors
Daily, 2010); Jiang (2011) also arg
2.2.2. Diversify economic and policy instruments may have positive economic imp
It is possible to decouple energy related GHG emissions from recycling regime is designed. By
economic growth provided that appropriate economic policy and clearly stated to implement prog
institutional adjustments are put in place timely; as empirical ments such as environmental tax
studies show that economic reforms have contributed to produc- pollutants mitigation. The introd
tivity growth, which in turn resulted in significant improvements 12th FYP highlights the change in
Source: Li and Wang, 2012.
52030 climate targets studied in our work
• China submitted its Intended Nationally Determined Contribution
(INDC) on 30 June 2015 to the UNFCCC, with quantitative targets up
to 2030.
• Previous to this, there exist a target: non-fossil fuels 15% to TPED by 2020
• China’s INDC include three major targets (excluding forestry targets)
• CO2 emissions peak no later than 2030
• Share of non-fossil fuels in TPED 20%
• Carbon intensity 60-65% reduction comparing to 2005 level
=> We assess the link and interaction among these targets with different
economic parameters.
6Choice of model to demonstrate linkages
• Complementary between simple and complex models
• Complex models as “black box” for non-modelers
• Extreme case: Pindyck (2013) of the MIT on integrated assessment models: illusory and
misleading perception of knowledge
• Simple models can also play a role to demonstrate causalities
• We aim at providing a first and rapid demonstration of linkages among
CN’s 2030 climate targets for both modelers and non-modelers.
• We constructed a simple assessment framework that can be reused
easily by others, with other data eventually.
• This is based on a previous work of Zhang, S., & Bauer, N. (2013). Utilization of the
non-fossil fuel target and its implications in China. Climate Policy, 13, 328–344.
7Our method
1. Assuming 2020 and 2030 non-fossil fuel targets (15% and 20% to
TPED) are achieved
2. We have the estimated real quantity (GW) of each non-fossil fuels by
2030 from official or quasi-official sources in China
3. We can obtain the TPED level by 2030
4. Based on official sources, we adjusted China’s energy mixt in 2030
5. We assume 8% and 6% as annual GDP growth rate for 2005-2020 and
2020-2030, respectively
6. We can than calculated related data: CO2 emissions, carbon/energy
intensity, energy GDP elasticity, etc.
8On our assumptions
• Achievement of 2030 non-fossil fuel target
• China in general can achieve its announced obligatory targets,
especially those marked in FYPs and promised to the international
community.
• E.g., energy intensity abatement by 2010: 20% announced cf. 19.1%
achieved
• E.g., Target of increasing 10GW solar power each year since 2013, cf.
10.4GW and 15.1GW in 2014 and 2015 as achieved
• The development of wind and solar power is also promoted by both
central and local governments as a major element for low-carbon
transition.
• GDP growth: these rate can be modified in a reasonable range but will
not impact our major findings.
9Downloaded by [
Table 2 Existing energy targets in China: 2020
Non-fossil fuel capacity
Primary energy type Targets as shareby 2030 Nature of the target
of TPED Source
• Non-fossil fuel 2030 capacities
Envisioned 15%are from experts
Compulsory
judgments asThe
the12thlatter
Five Yearstill
Plan of China
dominate
Natural gas policy design in10% China today. Indicative NDRC (2014)
Coal 62% Indicative NDRC (2014)
Oil 13% Calculated.
Total 100%
CLIMATE POLICY
10targets include both electricity and non-electricity uses of non-fossil fuels (as seen in Table 3). I
by Po
[
should also be noted that the figure of 12% for the proportion of gas in the total energy mix by 2030
des Sciences
2 Existing
Tablecould energy targets
be considered as ainconservative
China: 2020 estimate. A higher share of gas corresponds to a lower share o
Downloaded
coal in the energy mix, thus contributing to lower total CO2 emissions. Figures for annual running
Energy mixt by 2030
Primary energyare
hours type
based on Targets as share ofconstraints
technological TPED in Nature of the electricity
industrial target generation. Source
Finally, GDP growth rates of 8% and 6% (see OECD, 2012) are assumed respectively for the periods
• Adjustment
2005 – 2020in
Non-fossil fuel
table
2020 –32030
is made
15%
provided
a relativelytargets
Compulsory
incoherency (table 2) in China prior to
The 12th Five Year Plan of China
Downloaded by [FNSP Fondation National
and to reflect rapid rate of economic development
Natural gas 10% Indicative NDRC (2014)
2020, followed by a period of slightly slower growth for 2020 – 2030.
Coal 62% Indicative NDRC (2014)
Oil 13% Calculated.
4. Results
Total 100%
4.1. Total carbon emissions
Table 4 shows the total CO2 emission from fossil fuel combustion in 2020 and 2030, along with related
data required to carry out the calculations described in Section 2. As shown, total CO2 emission derived
CLIMATE POLICY
Table 4 CO2 emission and related data 18-19% current
level
2005 2010 2020 2030
Annual TPED growth from 2005 (%) 7 4 2.6
Total CO2 emission (Gt) 6.3 8.4 9.7 8.6
CO2 emissions growth rate (%) 5.7 2.9 1.2
Source: CO2 emissions in 2005 and 2010 are obtained from BP. Growth rate is relative to the 2005 base year.
CLIMATE POLICY
11Finding No.1 CO2 emissions peak prior to 2030
• As long as 2030 non-fossil fuel target is achieved, CO2 emission peak
can be achieved prior to 2030
• Total CO2 emissions 9.7Gt in 2020 and 8.6Gt in 2030
• Note1: this excludes CO2 emissions from industrial process
• Process emissions accounts 10% in total CO2 emissions 2005 (from 2nd National
Communication on CC of China)
• Reduction of the share/amount of cement, steel sectors as national plan in the future
• Improvement in technology
=> Exclusion of process emissions will not likely impact our result.
• Note2: this result does not change even under the scenario with fixed
coal share (from 65% as 2014 level up to 2030)
=> The increase of the share of NFF ensures an early peak from energy-
related CO2 emissions.
12Finding No.2 Higher carbon intensity abatement by 2030
as long as NFF target achieved
• Based on the scenario assessed, we have – 56.8% and – 71.7% as CI
decline relative to 2005 level by 2020 and 2030, respectively.
• Cf. announced target: -45-45% and -60-65% by 2020 and 2030,
respectively.
• This means an annual energy use carbon intensity decline of 1.4% for
2010-2030, comparing to 0.9% for 2005-2010 period.
13It should be emphasized that the very low average energy demand elasticity during the period of 1990–
Downloaded by [FNSP Fondation Nation
2000 is very probably due to the declining quality of energy statistics since the mid-1990s in Chin
(Sinton, 2001). This implies that the real energy demand elasticity could be higher during this period.
Energy demand elasticity can be further combined with GDP growth rate to assess the achievemen
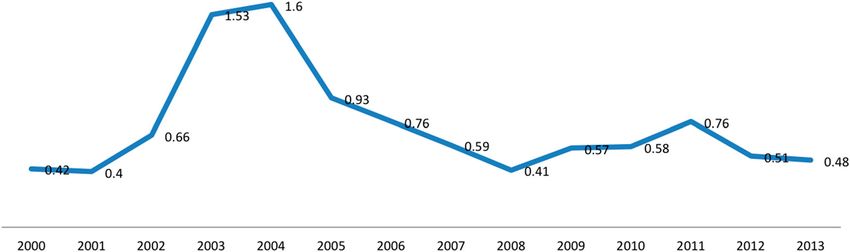
Finding No.3 Very likely achievement using energy
of the 2030 non-fossil fuel target. The downward curve in Figure 3 indicates the relation between GDP
elasticity as proxy
• To achieve such a result, we need to have average annual energy GDP
elasticity as 0.52 and 0.43 for 2010-2020 and 2020-2030, respectively.
• This is feasible following recent trends of diminishing energy elasticity
Figure 2 Annual energy consumption elasticity 2000–2013
CLIMATE POLICY
14Sets of energy elasticities and GDP growth rates for
simultaneous targets achievement (2030)
Downward curve:
achievement of NFF target
with a fixed amount of NFF X NFF
level X CI
-overachievement below the
curve O NFF; Our scenario
X CI (6.2%; 0.43)
Upward curve: simultaneous X NFF;
achievement of NFF (variable O CI
GW) and 65% carbon
intensity target O NFF;
-lower level on the curve O CI
indicates lower TPED
-overachievement of CI Intersection
below the curve (5.9%; 0.48)
15Finding No.4 Carbon intensity target 2030 could be
inconsistent with the achievement of Non-fossil fuel
target
Results obtained based on precedent figure.
• Carbon intensity does help to obtain total CO2 emissions
• Yet an energy per GDP intensity target is needed to ensure the TPED
level if we argue in the logic of achieving non-fossil fuel target.
16THANK YOU !
xin.wang@iddri.org
shuwei.zh@gmail.com
17Publications on carbon pricing; border carbon tax and
statistics (2011-2012)
Li, J.F., Wang, X., Zhang, Y.X., 2012. Is it in China's interest to implement an export carbon
tax?, Energy Economics, 34(6), pp.2072-2080.
[Summary republished at Nature Climate Change, 2, 230 (2012) doi:10.1038/
nclimate1477]
Wang, X., Li, J.F., Zhang, Y.X., 2012. A case for introducing an explicit carbon price into
China's export, Climate Policy, 12(4), pp.410-423.
Li, J., Wang, X., 2012. Energy paradigm shift and climate policy in China’s twelfth five-year
plan, Energy Policy, 41, pp.519-528.
Wang, X., Li, J.F., Zhang, Y.X., 2011. An analysis on the short-term sectoral competitiveness
impact of carbon tax in China, Energy Policy, 39, pp.4144-4152.
Voituriez, T., Wang, X., 2011. Getting the carbon price right through climate border
measures: a Chinese perspective, Climate Policy, 11(5), pp. 1257-1261.
Wang, X., 2011. On China's energy intensity statistics: toward a comprehensive and
transparent indicator, Energy Policy, 39, pp.7284-7289.
18Some publications on CN ETS (2014)
• Fei Teng, Xin Wang, LV Zhiqiang, 2014. Introducing the emissions
trading system to China’s electricity sector: Challenges and
opportunities, Energy Policy, 75, pp. 39-45.
• Ji Feng Li, Xin Wang, Ya Xiong Zhang, Qin Kou, 2014. The economic
impact of carbon pricing with regulated electricity prices in China - an
application of a computable general equilibrium approach, Energy
Policy, 75, pp. 46-56.
19A publication on EU-CN solar panel trade dispute
• Voituriez, T., WANG, X., 2015. Real Challenges behind the EU-China
PV trade dispute settlement, Climate Policy, 15(5), pp.670-677
20You can also read