Report 11: Evidence of initial success for China exiting COVID-19 social distancing policy after achieving containment
←
→
Page content transcription
If your browser does not render page correctly, please read the page content below
24 March 2020                                                        Imperial College COVID-19 Response Team

Report 11: Evidence of initial success for China exiting COVID-19
social distancing policy after achieving containment
Kylie E C Ainslie*, Caroline Walters*, Han Fu*, Sangeeta Bhatia, Haowei Wang, Marc Baguelin, Samir Bhatt,
Adhiratha Boonyasiri, Olivia Boyd, Lorenzo Cattarino, Constanze Ciavarella, , Zulma Cucunubá, Gina Cuomo-
Dannenburg, Amy Dighe, Ilaria Dorigatti, Sabine L van Elsland, Rich FitzJohn, Katy Gaythorpe, Lily Geidelberg,
Azra C Ghani, Will Green, Arran Hamlet, Wes Hinsley, Natsuko Imai, David Jorgensen, Edward Knock, Daniel
Laydon, Gemma Nedjati-Gilani, Lucy C Okell, Igor Siveroni, Hayley Thompson, Juliette Unwin, Robert Verity,
Michaela Vollmer, Patrick GT Walker, Yuanrong Wang, Oliver Watson, Charles Whittaker, Peter Winskill, Xiaoyue
Xi, Christl A Donnelly, Neil M Ferguson1, Steven Riley1

On behalf of the Imperial College COVID-19 Response Team

WHO Collaborating Centre for Infectious Disease Modelling
MRC Centre for Global Infectious Disease Analysis
Abdul Latif Jameel Institute for Disease and Emergency Analytics
Imperial College London

*contributed equally, 1Correspondence: s.riley@imperial.ac.uk; neil.ferguson@imperial.ac.uk

Summary
The COVID-19 epidemic was declared a Global Pandemic by WHO on 11 March 2020 [1]. As of 20
March 2020, over 254,000 cases and 10,000 deaths had been reported worldwide. The outbreak
began in the Chinese city of Wuhan, Hubei in December 2019. In response to the fast-growing
epidemic, China imposed strict social distancing in Wuhan on 23 January 2020 [2, 3] followed closely
by similar measures in other provinces. At the peak of the outbreak in China (early February), there
were between 2,000 and 4,000 new confirmed cases per day. For the first time since the outbreak
began there have been no new confirmed cases caused by local transmission in China reported for
five consecutive days up to 23 March 2020 [4-7]. This is an indication that the social distancing
measures enacted in China have led to control of COVID-19. These interventions have also impacted
economic productivity, and the ability of the Chinese economy to resume without restarting the
epidemic is not yet clear. Here, we estimate transmissibility from reported cases and compare those
estimates with daily data on within-city movement, as a proxy for economic activity. Initially, within-
city movement and transmission were very strongly correlated in the 5 provinces most affected by
the epidemic and Beijing. However, that correlation fell away quickly, especially outside Hubei, and is
no longer apparent even though within-city movement has started to increase. A similar analysis for
Hong Kong shows that intermediate levels of local activity can be maintained while avoiding a large
outbreak. These results do not preclude future epidemics in China, nor do they allow us to estimate
the maximum proportion of previous within-city activity that will be recovered in the medium term.
However, they do suggest that after very intense social distancing which resulted in containment,
China has successfully exited their stringent social distancing policy to some degree. Globally, China is
at a more advanced stage of the pandemic. Policies implemented to reduce the spread of COVID-19
in China and the exiting strategies that followed can inform decision making processes for countries
once containment is achieved.

SUGGESTED CITATION
Kylie E C Ainslie, Caroline Walters, Han Fu et al. Evidence of initial success for China exiting COVID-19 social
distancing policy after achieving containment. Imperial College London (24-03-2020), doi:
https://doi.org/10.25561/77646.

                 This work is licensed under a Creative Commons Attribution-NonCommercial-NoDerivatives
                 4.0 International License.

DOI: https://doi.org/10.25561/77646                                                                Page 1 of 8
24 March 2020                                                   Imperial College COVID-19 Response Team

We analyse daily reported COVID-19 cases for each province in mainland China and for Hong Kong
SAR and Macau SAR [7] (Figure 1). The reproduction number (Rt) measures transmissibility and is
defined as the average number of new cases generated by each case. When the number of cases is
growing, Rt is greater than 1; when the number of cases is decreasing, Rt is less than 1. Changes in Rt
are not immediately evident in case data for two reasons. First, there are delays from infection to the
onset of symptoms and from the onset of symptoms to seeking care. Second, people must be tested,
and those tests reported to become a case in these data.

As a proxy for economic activity we obtained daily within-city movement data from 1 January to 17
March 2020 for major metropolitan cities within each province in mainland China (Figure 1), Hong
Kong SAR, and Macau SAR. These data, provided by Exante Data Inc [8], measured travel activity
relative to the 2019 average (excluding lunar new year). The underlying data are based on near real-
time people movement statistics from Baidu. Based on GPS tracking, the data allow quantification of
the number of trips taken per person in the population. At the country level, ~5 trips per person was
normal. If that went down to 3 daily trips per person, that would be described as a 40% drop. We
calculated the weighted average movement within each province using city population size (see
Supporting Table S1).

Estimates of Rt over time for each region were obtained using the EpiEstim R package [9]. We assumed
a mean serial interval of 6.48 days with a standard deviation of 3.83 days [10]. To account for the delay
between symptom onset and report of confirmed cases, we calculated the cross-correlation between
daily movement and Rt for Hubei province (where 84% of all confirmed cases in China, Hong Kong,
and Macau occurred as of 22 March) for time lags between 0 and 20 days. Cross-correlations were
calculated using the ccf function in the stats R package. The highest correlation was observed for a 4-
day lag (Figure S1). Next, we determined biweekly rolling Pearson intra-region correlation coefficients
between Rt and movement data for each province. To determine how the movement patterns in Hubei
province (where the most cases were observed) influenced the Rt in other regions, we also calculated
biweekly rolling Pearson inter-region correlation coefficients between Rt in each region and
movement in Hubei. All analyses were performed in R 3.6.2 [11].

We found that as movement restrictions were put into place within mainland China from late January
to early February 2020, within-city movement and Rt were highly positively correlated (Figure 2, i.e., a
decrease in movement was highly correlated with a decrease in Rt ). However, as movement resumed
within each province/region, the correlation between within-city movement and Rt declined steeply
and became strongly negative (intra-region correlation). We also evaluated the correlation between
within-city movement in Hubei and Rt in other regions (inter-region correlation). Movement in Hubei
was initially strongly positively correlated with Rt in other provinces/regions. However, as movement
resumed within each province/region, inter-region correlations became weaker.

In Hong Kong, where less strict movement restrictions were implemented and a lessened, but
consistent level of economic activity has been maintained, we observed no correlation between intra-
Hong Kong movement and Rt (Figure 3).

DOI: https://doi.org/10.25561/77646                                                          Page 2 of 8
24 March 2020 Imperial College COVID-19 Response Team
It is important to note that this work is an analysis of correlation, not causation. While within-city
movement undoubtedly affects Rt, this analysis does not infer causation. To estimate Rt, we used
confirmed case reports; however, confirmed cases are only a proportion of the total number of
infected individuals. Therefore, our estimates of Rt may be biased if the proportion of cases being
detected varied substantially over short periods of time.
We assessed the correlation between daily movement and estimated Rt over time and observed
strong positive correlation between movement and Rt initially and then observed a decoupling of this
correlation as China began to remove movement restrictions and restart their economy. These results
provide evidence that China’s containment strategies are continuing to be effective as they restart
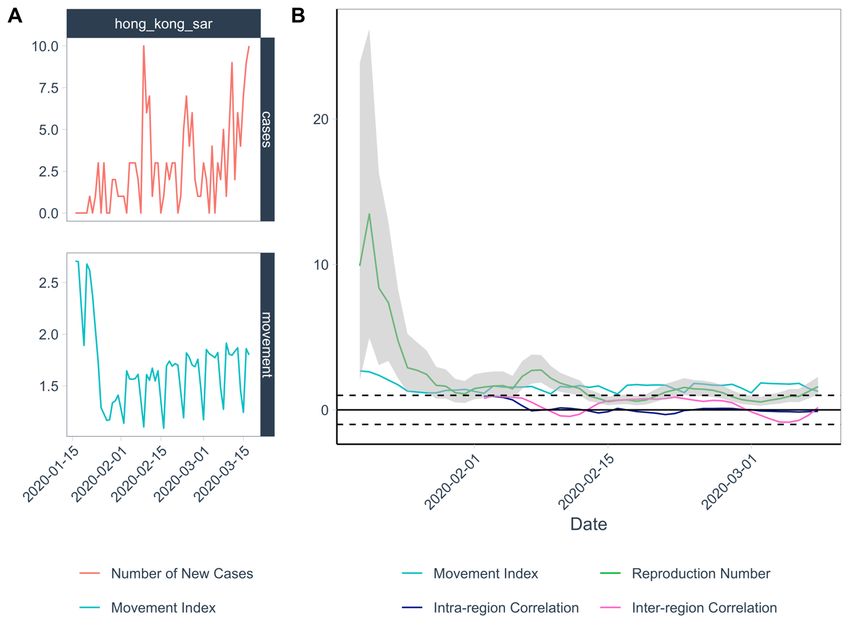
their economy. In Hong Kong, movement and Rt within Hong Kong were not correlated, suggesting
that they are able to maintain economic activity while simultaneously containing COVID-19 effectively.
References
1. World Health Organization. WHO Director-General's opening remarks at the media
briefing on COVID-19. 11 March 2020; Available from:
https://www.who.int/dg/speeches/detail/who-director-general-s-opening-remarks-
at-the-media-briefing-on-covid-19---11-march-2020
2. Wuhan Epidemic Prevention and Control Centre for Novel Coronavirus-infected
Pneumonia. Notice for the epidemic of novel coronavirus-infected pneumonia in
Wuhan city. 22 March 2020; Available from:
http://www.hubei.gov.cn/zhuanti/2020/gzxxgzbd/zxtb/202001/t20200123_2014402
.shtml.
3. BBC News. China coronavirus: Lockdown measures rise across Hubei province. 23
January 2020; Available from: https://www.bbc.co.uk/news/world-asia-china-
51217455.
4. National Health Commission of the People’s Republic of China. March 19: Daily
briefing on novel coronavirus cases in China. 2020; Available from:
http://en.nhc.gov.cn/2020-03/19/c_77945.htm.
5. National Health Commission of the People’s Republic of China. March 20: Daily
briefing on novel coronavirus cases in China. 2020; Available from:
http://en.nhc.gov.cn/2020-03/20/c_78006.htm.
6. National Health Commission of the People’s Republic of China. March 21: Daily
briefing on novel coronavirus cases in China. 2020; Available from:
http://en.nhc.gov.cn/2020-03/21/c_78058.htm.
7. Chinese Center for Disease Control and Prevention, Distribution of the novel
coronavirus-infected pneumonia. 2020.
8. Exante Data Inc, Electronic Data. 2020.
9. Cori, A., Estimate Time Varying Reproduction Numbers from Epidemic Curves. R
package version 2.2-1. 2019.
10. Ferguson, N.M., et al., Impact of non-pharmaceutical interventions (NPIs) to reduce
COVID19 mortality and healthcare demand. 2020. DOI: 10.25561/77482.
11. R Core Team. R: A language and environment for statistical computing. Available
from: https://www.R-project.org/.
DOI: https://doi.org/10.25561/77646 Page 3 of 824 March 2020 Imperial College COVID-19 Response Team Figures Figure 1. Plots of daily new confirmed cases (red line, top row) and daily movement index (Exante Data Inc, NY, blue line, bottom row) for Hubei, Beijing, Guangdong, Henan, Hunan, and Zhejiang. The cyclic movement patterns seen in Beijing and toward the end of February in Zhejiang are the result of decreased travel on weekends. DOI: https://doi.org/10.25561/77646 Page 4 of 8
24 March 2020                                                   Imperial College COVID-19 Response Team

   Figure 2. Plots of estimated reproduction number, movement, and correlation in the 5 provinces in
   mainland China with the highest numbers of cumulative confirmed cases and Beijing (top: Beijing,
   Guangdong, Henan; bottom: Hubei, Hunan, Zhejiang). Light blue: mean daily movement index (Exante
   Data Inc, NY, green: mean effective reproduction number estimated using daily confirmed case reports
   (grey shading: 95% credible interval), dark blue: intra-region correlation between movement index and
   effective reproduction number, pink: inter-region correlation between movement index in Hubei and
   effective reproduction number in each province. Reproduction number was estimated assuming a lag of -
   4 days. Dashed lines indicate the upper and lower bounds of the correlation coefficients (-1, 1).

DOI: https://doi.org/10.25561/77646                                                         Page 5 of 8
24 March 2020                                                     Imperial College COVID-19 Response Team

Figure 3. (A) Plots of daily new confirmed cases (top) and daily movement index (bottom) for Hong Kong. (B)
Plots of estimated reproduction number, movement, and correlation in Hong Kong. Light blue: mean daily
movement index, green: mean effective reproduction number estimated using daily confirmed case reports
(grey shading: 95% credible interval), dark blue: intra-region correlation between movement index and
effective reproduction number, pink: inter-region correlation between movement index in Hubei and
effective reproduction number in Hong Kong. Dashed lines indicate the upper and lower bounds of the
correlation coefficients (-1, 1).

DOI: https://doi.org/10.25561/77646                                                            Page 6 of 8
24 March 2020                                                     Imperial College COVID-19 Response Team

Supplemental Material
S1. City-level population size data

Table S1. Province and source of population size data. Numbers of total residents at the end of 2018 in each
city were extracted from the provincial Statistical Yearbooks.

 Province            Source

 Guangdong              http://stats.gd.gov.cn/gdtjnj/content/post_2639622.html

 Henan                  http://www.ha.stats.gov.cn/hntj/lib/tjnj/2019/zk/indexch.htm

 Hubei                  http://tjj.hubei.gov.cn/tjsj/sjkscx/tjnj/qstjnj/

 Hunan                  http://222.240.193.190/19tjnj/indexch.htm

 Zhejiang               http://zjjcmspublic.oss-cn-hangzhou-zwynet-d01-
                        a.internet.cloud.zj.gov.cn/jcms_files/jcms1/web3077/site/flash/tjj/Reports
                        1/2019%e5%b9%b4%e7%bb%9f%e8%ae%a1%e5%b9%b4%e9%89%b4%e5
                        %85%89%e7%9b%9820200121_2146/indexch.htm

DOI: https://doi.org/10.25561/77646                                                             Page 7 of 8
24 March 2020 Imperial College COVID-19 Response Team Figure S1. Cross-correlation between Hubei movement and reproduction number for different lag times. The highest correlation is for a lag of -4 days. DOI: https://doi.org/10.25561/77646 Page 8 of 8
You can also read