Application of Horizontal Confluents Jets in a School Virtual Chamber
←
→
Page content transcription
If your browser does not render page correctly, please read the page content below
E3S Web of Conferences 246, 02005 (2021)                                                                https://doi.org/10.1051/e3sconf/202124602005
Cold Climate HVAC & Energy 2021

       Application of Horizontal Confluents Jets in a School Virtual
       Chamber
       Eusébio Conceição1,3*, Mª Inês Conceição2, João Gomes3, Mª Manuela Lúcio1 and Hazim Awbi4
       1FCT – University of Algarve, Campus de Gambelas, 8005-139 Faro, Portugal
       2IST– University of Lisbon, Av. Rovisco Pais 1, 1049-001 Lisboa, Portugal
       3CINTAL, Campus de Gambelas, 8005-139 Faro, Portugal
       4School of Built Environment, University of Reading, Reading, RG6 6AW, UK

                     Abstract. The study presented in this work is performed in a virtual chamber, similar to an existing
                     experimental chamber, with dimensions of 4.50×2.55×2.50 m3. The chamber, occupied with twelve virtual
                     manikins, is equipped with six tables, twelve chairs, one exhaust system and one inlet system, based in
                     confluents jets system. In the exhaust system are considered six air ducts, located above the head level,
                     connected to the ceiling area. The inlet system, based in four vertical ducts, with 0.15 m diameter, located
                     on the corners of the chamber, are equipped with consecutive holes, that promotes horizontal jets near the
                     wall. The results demonstrate that when the airflow rate increases the air quality number increases, the
                     thermal comfort number decreases and the ADI increases slightly. The predicted percentage of dissatisfied
                     index values show that the thermal comfort level is acceptable, the dioxide carbon concentration values
                     show that the indoor air quality is near the acceptable value and the Draught Risk is acceptable.

       1 Introduction                                                           presented and detailed in the studies of Awbi [7], for
                                                                                uniform environments, and Conceição et al. [8], for non-
           Several studies have been developed on the area of                   uniform environments, and it allows to assess, in an
       confluent jets ventilation systems [1]-[2]. Confluent jets               integrated way, the overall performance of the
       define a system of multiple jets that combine with each                  ventilation system.
       other, after traveling a certain distance after their exit, to               The numerical software used in this work is based on
       form a single jet that will converge to the exit of the                  a coupling between Computer Fluid Dynamics (CFD)
       ventilation system.                                                      and Human Thermal Response (HTR) numerical
           Several parameters are used to evaluate the local                    models. This methodology can be seen in the studies of
       thermal discomfort, thermal comfort and indoor air                       Conceição and Lúcio [9], [10], Conceição [11], and
       quality levels. Draught Risk (DR) is used to evaluate the                Conceição et al. [12], [13].
       local thermal discomfort level that the occupants are                        This software also uses a third numerical model,
       subjected, carbon dioxide (CO2) concentration is used to                 Building Dynamic Response, BDR, (as example, the
       evaluate the indoor air quality level, Predicted Mean                    works of Conceição et al. [14] and Conceição and Lúcio
       Vote (PMV) index and Predicted Percentage of                             [15]), which evaluates the air temperature distribution,
       Dissatisfied (PPD) index are used to evaluate the                        the surfaces temperature distribution and the energy
       thermal comfort level of the occupants and Air                           consumption [16]-[17]. This software considers the
       Distribution Index (ADI) is used to evaluate                             evaluation of thermal comfort through the PMV/PPD
       simultaneously the air quality, thermal comfort and                      indexes [18], the adaptive thermal comfort [18], and the
       contaminants and heat removal efficiencies. DR was                       temperature preferred control model [19].
       developed by Fanger et al. [3] and depends on                                The purpose of this numerical study is to develop a
       temperature, velocity and turbulence intensity of the air.               new horizontal confluent jets system, using three
       CO2 concentration can be used to evaluate indoor air                     numerical software, in order to evaluate simultaneously
       quality [4]. PMV and PPD indexes, parameters                             the occupants thermal comfort, indoor air quality and
       developed by Fanger [5], are applied to determine the                    Draught risk, that each one are subjected. The confluent
       thermal comfort conditions in conditioned spaces and                     jets, with dimensions similar to the seated occupant
       they are used by ISO 7730 [6] to define three thermal                    height, promote simultaneously airflow in all vertical
       comfort categories (A, B, C) requirements. ADI was                       wall area.

       * Corresponding author: econcei@ualg.pt

  © The Authors, published by EDP Sciences. This is an open access article distributed under the terms of the Creative Commons Attribution License 4.0
  (http://creativecommons.org/licenses/by/4.0/).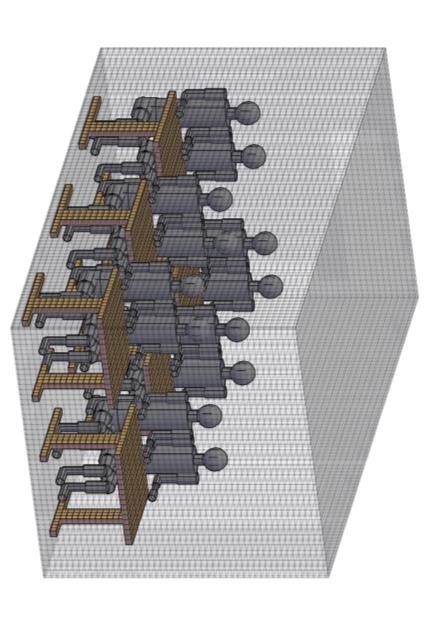
E3S Web of Conferences 246, 02005 (2021) https://doi.org/10.1051/e3sconf/202124602005
Cold Climate HVAC & Energy 2021
Three software, developed by the authors of this The differential CFD model evaluates the air
work, are used: a coupling of the CFD and HTR and a velocity, air temperature, air turbulence intensity and
third software that simulate the BDR. The first evaluates CO2 concentration. In this study the DR around the
the airflow around the occupants, the second the human occupants, the thermal comfort, the air quality and the
thermal response, and the third the surrounding surface ADI are evaluated.
temperatures, used in the other two. The integral numerical model, that simulates
This study was developed for winter conditions and Building Dynamic Response, evaluates the air
considers three Cases, each one corresponding to a temperature distribution, surfaces temperature
specific airflow rate. distribution and energy consumption.
The integral numerical models consider energy and
mass balance integral equations. The final equation
2 Materials and Methods system is resolved using the Runge-Kutta-Felberg
This numerical study considers: method with error control.
The Building Dynamic Response numerical model
a coupling of a differential numerical model, that
was validated in winter conditions [20] and in summer
simulates the Computational Fluids Dynamics,
conditions [21].
CFD, (see Figure 1), and an integral numerical
The differential numerical model, that simulate the
model, that simulates Human Thermal Response,
Computational Fluids Dynamics, considers the Navier-
HTR, systems (see Figure 2);
Stokes balance equations, the energy balance equations,
an integral numerical model, that simulates Building
the mass balance equations, the contaminant balance
Dynamic Response, BDR.
equation and the k-epsilon turbulence model balance
equations (using the RNG turbulence model). In the
resolution of all equations system, it is used the
Tridiagonal Matrix Algorithm (TDMA) method.
The differential numerical model was validated in
isothermal and non-isothermal conditions and was
validated in a coupling methodology with the Human
Thermal Response numerical model. One example can
be seen in [9].
The ADI is used to evaluate simultaneously the
occupant thermal comfort, occupant air quality and
ventilation effectiveness for heat and contaminants
removal levels.
The numerical study, presented in this work, is
performed in a virtual chamber, similar to an existing
experimental chamber, with dimensions of
4.50×2.55×2.50 m3 (Figures 1 and 2):
a) With occupants, desks, seats, and ventilated system
occupied with twelve virtual manikins;
equipped with six tables;
equipped with twelve chairs;
equipped with one exhaust system build with six
vertical air ducts, located above the head level,
connected to the ceiling area;
equipped with one inlet system, based in a confluents
jets system, based in four vertical ducts, with 0.15 m
diameter, located on the corners of the chamber, and
equipped with consecutive holes, that promotes
horizontal jets near the wall.
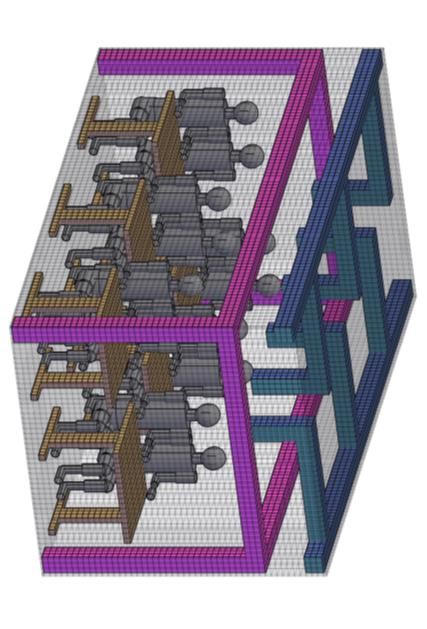
The location of the occupants and the number of the
occupants, that is presented in the following pictures,
can be show in Figure 3.
The inlet (green arrows) and outlet (red arrows)
airflow location used in the CFD numerical simulation
b) With occupants, desks, and seats
can be seen in Figure 4.
Figure 1. Scheme of the virtual chamber, equipped with a The ventilation system was built with four vertical
ventilation system, used in the CFD. ducts, located in the corners of the wall, with a length of
The integral numerical model, that simulates the 180 cm and a diameter equal to 12.5 cm. Each duct
human thermal and thermoregulatory and clothing contains two lines of holes (each line for each adjacent
thermal response, evaluates the tissue, blood and wall surface), from 25 cm to 100 cm, above the floor
clothing temperatures distribution. level.
2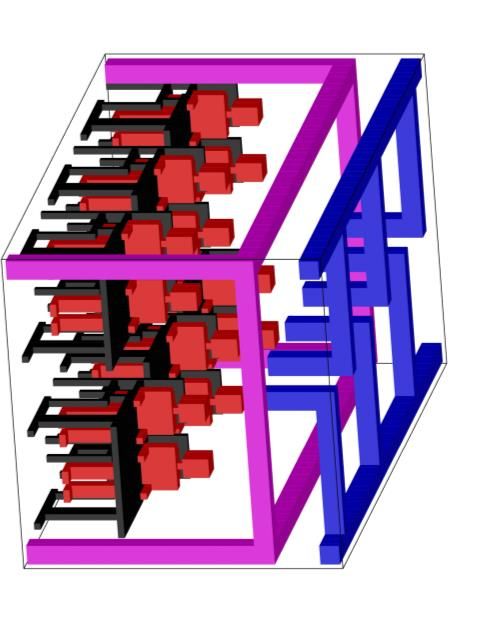
E3S Web of Conferences 246, 02005 (2021) https://doi.org/10.1051/e3sconf/202124602005
Cold Climate HVAC & Energy 2021
Case A – with an airflow rate for 12 occupants, an
inlet air velocity of 0.36 m/s, an inlet air temperature
of 11.6 ºC and a thermal power of 1447.3 W;
Case B – with an airflow rate for 24 occupants, an
inlet air velocity of 0.72 m/s, an inlet air temperature
of 15.8 ºC and a thermal power of 3942.6 W;
Case C – with an airflow rate for 36 occupants, an
inlet air velocity of 1.08 m/s, an inlet air temperature
of 17.2 ºC and a thermal power of 6438.2 W.
a) With occupants, seats, and ventilated system
b) With occupants, desks, and seats.
a)
Figure 2. Scheme of the virtual chamber, equipped with a
ventilation system, used in the HTR.
b)
Figure 4. Inlet (green arrows) and outlet (red arrows) airflow
location used in the CFD numerical simulation: a) front and
b) side view.
It was considered a typical clothing level of 1 clo for
Figure 3. Location of the occupants and identification of the winter conditions, with a typical level of activity of 1.2
number of the occupants. met [6].
The numerical simulations were performed for a
winter typical day conditions: 3 Results and Discussion
with indoor mean air temperatures of 20ºC;
with indoor air relative humidity of 50%; In this section the distribution of environmental
with outdoor air temperature of 0ºC. variables around the occupants, namely the air velocity
distribution, the air temperature distribution and the DR
In the numerical simulation three Cases were distribution, and the ADI are presented.
studied:
3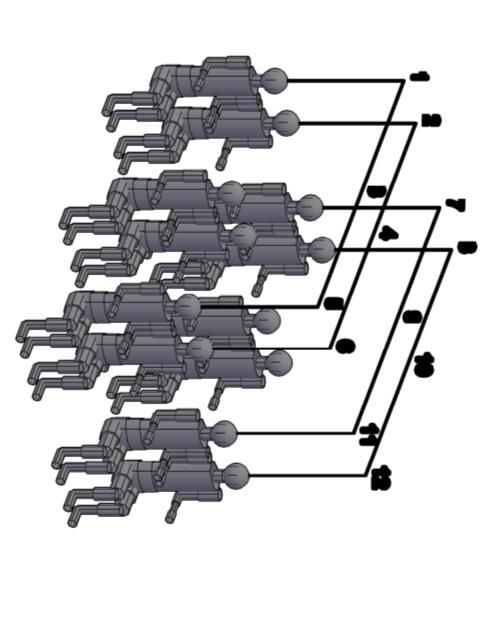
E3S Web of Conferences 246, 02005 (2021) https://doi.org/10.1051/e3sconf/202124602005
Cold Climate HVAC & Energy 2021
3.1 Environmental Variables • The air velocities around the occupants sections are
higher in the upper members than the lower
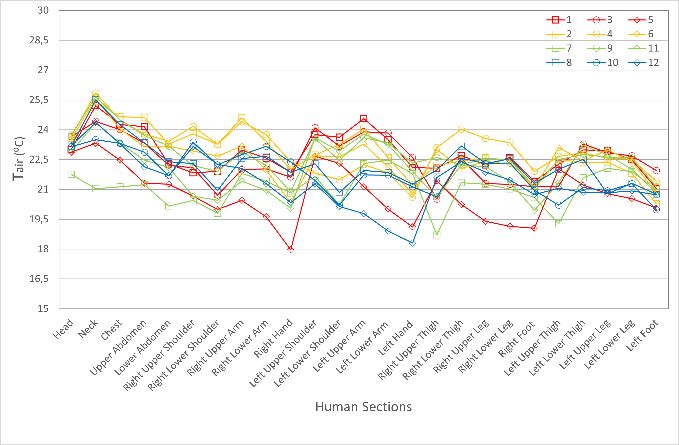
In Figures 5 to 7 are presented, respectively, the air members;
velocity distribution, air temperature distribution and • The air velocity around the occupants’ sections
DR distribution, around the occupants, for winter increase when the airflow rate increases;
conditions. The figures a) are associated with the Case • The occupants seated near the left wall present
studied A, figures b) are associated with the Case higher air velocity in the left upper and lower
studied B and figures c) are associated with the Case member than the right upper and lower member. In
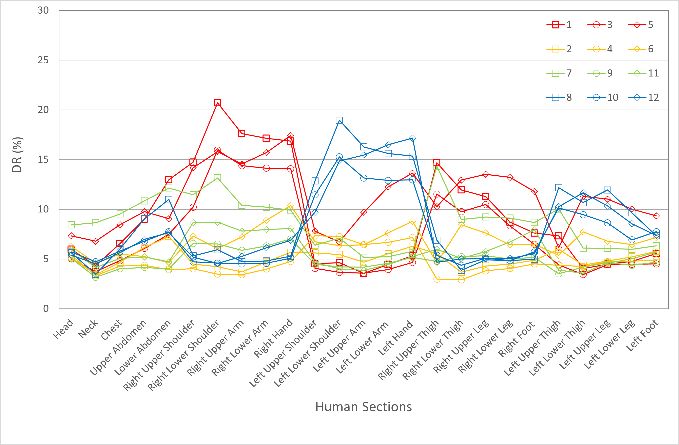
studied C. In the DR evaluation, the Category A is the occupants seated near the right wall the opposite
associated with (10%), the Category B is associated with is verified.
(20%) and the Category C is associated with (30%) [6].
a) a)
b) b)
c) c)
Figure 5. Air velocity (Vair) distribution around the Figure 6. Air temperature (Tair) distribution around the
occupants for a) Case A, b) Case B, and c) Case C). occupants for a) Case A, b) Case B, and c) Case C).
The results obtained show that: • The air temperature around the occupants sections is
• The air velocity around the occupants sections is relatively uniform;
lower in the head and in the feet area; • The fluctuation of the air temperature around the
occupants’ sections decreases slightly when the
airflow rate increases;
4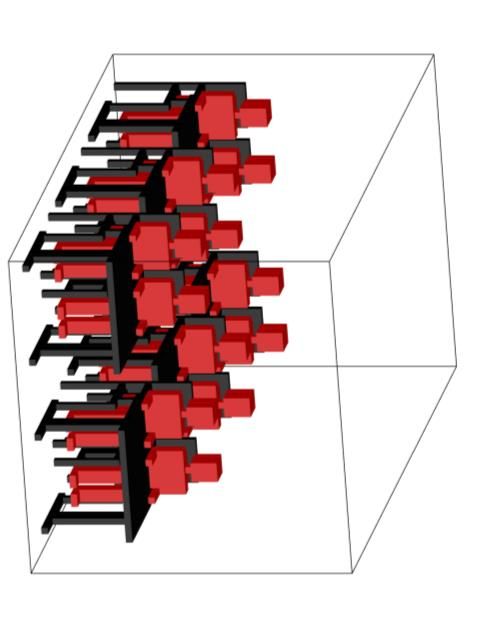
E3S Web of Conferences 246, 02005 (2021) https://doi.org/10.1051/e3sconf/202124602005
Cold Climate HVAC & Energy 2021
• The DR around the occupants’ sections increases Table 1, Table 2 and Table 3 present the results of
when the airflow rate increases; the effectiveness for heat removal, the PPD, N TC, CO2
• The DR in the Cases A and B are acceptable concentration in the breathing area, the effectiveness for
according to the Category B, while in the Case C is contaminants removal, the percentage of dissatisfied
acceptable according to the Category C; (PD) people with indoor air quality, N IAQ and the ADI
• The DR around the occupants’ sections is lower in index, obtained in winter conditions, respectively, for
the head and in the feet area; the Cases A, B and C.
• The DR around the occupants’ sections is higher in In the Tables 1 to 3 the following variables are
the upper members than the lower members. represented by:
• As was verified in the air velocity, the occupants N Number of occupant;
seated near the left wall present higher Draught Risk Tm (ºC) Body Mean Temperature;
in the left upper and lower member than the right ETC (%) Effectiveness for Heat Removal;
upper and lower member. In the occupants seated PPD (%) Predicted Percentage of Dissatisfied
near the right wall the opposite is verified. people;
NTC Thermal Comfort Number;
C (mg/m3)Carbon dioxide concentration (CO2) in
3.2 Air Distribution Index
the respiration area;
EIAQ Effectiveness for Contaminant Removal;
PDIAQ Predicted Dissatisfied with Indoor Air
Quality;
NIAQ Air Quality Number;
ADI Air Distribution Index.
The numerical simulation obtained results
demonstrate that:
The effectiveness of heat removal decreases when
the airflow rate increases;
The PPD index is acceptable, according to the
Category B [6], and increases when the airflow rate
a) increases. However, the occupants seated in the
corridor side present best thermal comfort level than
the occupants seated in the wall side;
The thermal comfort number decreases when the
airflow rate increases;
Table 1. ADI obtained in Case A.
N 1 2 3 4 5 6
T m (ºC) 23,6 24,0 23,3 24,0 21,2 23,3
ETC (%) 63,9 61,8 65,3 61,5 79,4 65,3
PPD (%) 5,3 5,0 5,3 5,0 8,4 5,3
NTC 12,2 12,3 12,3 12,3 9,4 12,4
C (mg/m 3 ) 2561,4 2819,2 2963,7 4818,9 9362,2 6134,6
EIAQ 42,1 37,4 35,2 20,1 9,8 15,4
b) PDIAQ 14,9 14,9 14,9 14,9 14,9 14,9
NIAQ 2,8 2,5 2,4 1,4 0,7 1,0
ADI 5,9 5,6 5,4 4,1 2,5 3,6
N 7 8 9 10 11 12 Mean
T m (ºC) 20,6 22,9 23,7 22,5 22,5 22,4 22,8
ETC (%) 85,3 67,6 63,0 70,2 70,2 70,6 68,7
PPD (%) 9,3 5,8 5,0 5,9 5,7 6,2 6,0
NTC 9,2 11,7 12,5 11,9 12,2 11,4 11,6
C (mg/m 3 ) 3693,2 2730,5 5495,3 3001,3 6014,2 10076,5 4972,6
EIAQ 27,2 38,9 17,4 34,7 15,7 9,1 25,2
PDIAQ 14,9 14,9 14,9 14,9 14,9 14,9 14,9
NIAQ 1,8 2,6 1,2 2,3 1,1 0,6 1,7
ADI 4,1 5,5 3,8 5,3 3,6 2,6 4,3
c)
Figure 7. Draught Risk (DR) distribution around the
occupants for a) Case A, b) Case B, c) and Case C).
5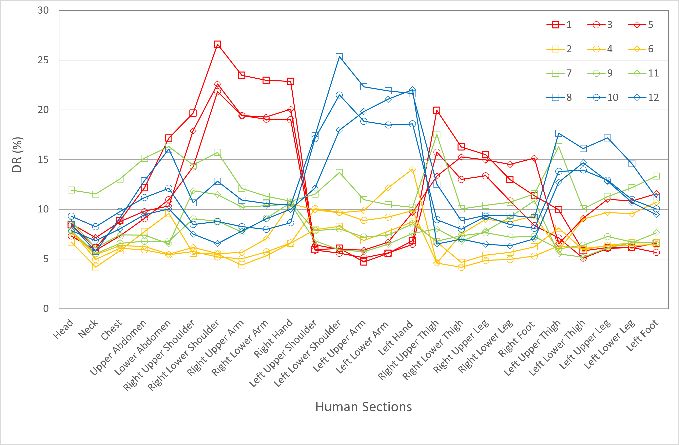
E3S Web of Conferences 246, 02005 (2021) https://doi.org/10.1051/e3sconf/202124602005
Cold Climate HVAC & Energy 2021
Table 2. ADI obtained in Case B. The ADI increases slightly when the airflow rate
N 1 2 3 4 5 6
increases.
T m (ºC) 23,1 23,3 22,8 23,4 21,4 23,1
ETC (%) 52,9 51,5 55,2 50,7 68,9 53,3 4 Conclusion
PPD (%) 6,0 5,5 6,1 5,3 10,1 5,9
NTC 8,7 9,4 9,0 9,5 6,8 9,0
In this work the application of horizontal confluents
jets in a virtual school chamber was done. The study,
C (mg/m 3 ) 1480,7 1627,7 1715,4 2984,7 6447,2 3038,7
made in winter conditions, considers a virtual chamber
EIAQ 43,5 37,8 35,1 17,2 7,2 16,8
occupied with twelve manikins and equipped with six
PDIAQ 8,0 8,0 8,0 8,0 8,0 8,0 desks, twelve chairs, one exhaust system and one inlet
NIAQ 5,4 4,7 4,4 2,1 0,9 2,1 system, based on a confluents jets system.
ADI 6,9 6,7 6,3 4,5 2,5 4,3 The airflow is distributed on the walls and ground
N 7 8 9 10 11 12 Mean floor. The ascendant airflow transports the CO2
T m (ºC) 21,0 22,8 23,2 22,2 22,4 22,0 22,6 concentration and heat release by the occupants to the
ETC (%) 75,1 55,6 52,2 60,6 59,0 62,0 58,1
exhaust system located above the head level. Therefore,
PPD (%) 10,0 6,3 5,5 7,0 6,5 7,6 6,8
the use of three rates was studied in order to optimize
the functioning of the ventilation system. The best result
NTC 7,5 8,8 9,5 8,6 9,1 8,2 8,7
3
was obtained for an airflow rate for 36 occupants (Case
C (mg/m ) 2241,4 1589,1 3264,1 1676,6 4327,2 6783,1 3098,0
C). In this case, the best ADI was obtained and a good
EIAQ 24,5 39,2 15,4 36,3 11,2 6,8 24,2 compromise between indoor air quality, with CO2
PDIAQ 8,0 8,0 8,0 8,0 8,0 8,0 8,0 values close to the acceptable limit, and the level of
NIAQ 3,1 4,9 1,9 4,5 1,4 0,8 3,0 thermal comfort of the occupants, which is acceptable
ADI 4,8 6,6 4,3 6,2 3,6 2,6 4,9 within category C [6]. However, the occupants seated in
the corridor side present best thermal comfort level than
the occupants seated in the wall side. For lower airflow
Table 3. ADI obtained in Case C. rate, the occupants seated in the corridor side present
best indoor air quality level than the occupants seated in
N 1 2 3 4 5 6
the wall side. However, for higher airflow rate the
T m (ºC) 23,1 23,2 22,4 23,1 21,8 22,6 opposite is verified;
ETC (%) 44,1 43,0 49,4 43,6 56,1 48,1 The local thermal discomfort obtained in this case is
PPD (%) 6,7 5,7 7,3 5,9 9,6 7,0 also acceptable with the DR values being within
NTC 6,6 7,6 6,7 7,4 5,9 6,8 category C [6]. The occupants seated near the left wall
C (mg/m 3 ) 1147,6 1254,9 1309,2 2128,4 1208,0 3286,6 present higher air velocity and Draught Risk levels in
EIAQ 43,3 37,2 34,7 17,2 39,6 10,1 the left upper and lower member than the right upper and
PDIAQ 5,3 5,3 5,3 5,3 5,3 5,3
lower member. In the occupants seated near the right
wall the opposite is verified
NIAQ 8,2 7,0 6,6 3,3 7,5 1,9
As the results show, this kind of airflow topology
ADI 7,4 7,3 6,6 4,9 6,6 3,6
promotes good air quality levels, because it removes the
N 7 8 9 10 11 12 Mean
CO2 concentration released in the respiration process,
T m (ºC) 20,8 22,1 22,7 21,3 22,0 21,6 22,2 promotes acceptable thermal comfort levels because it
ETC (%) 71,8 52,8 47,4 62,3 54,1 58,8 52,6 removes the heat emanated from the body promotes low
PPD (%) 11,6 8,7 6,6 10,2 7,8 9,6 8,1 DR levels because the higher air velocity levels are
NTC 6,2 6,1 7,2 6,1 6,9 6,1 6,6 located near the wall, in the non-occupied space, and
C (mg/m 3 ) 1775,9 1147,0 2969,5 1417,0 3176,7 5240,1 2171,7 low air velocity in the occupied area.
EIAQ 22,0 43,4 11,4 30,6 10,5 5,9 25,5
PDIAQ 5,3 5,3 5,3 5,3 5,3 5,3 5,3 Acknowledgement
NIAQ 4,2 8,2 2,2 5,8 2,0 1,1 4,8
ADI 5,1 7,1 3,9 6,0 3,7 2,6 5,4
The author would like to acknowledge to the project
(SAICT-ALG/39586/2018) from Algarve Regional
The carbon dioxide concentration decreases when Operational Program (CRESC Algarve 2020), under the
the airflow rate increases and in the Case C are near PORTUGAL 2020 Partnership Agreement, through the
the acceptable value. For lower airflow rate the European Regional Development Fund (ERDF) and the
occupants seated in the corridor side present best National Science and Technology Foundation (FCT).
indoor air quality level than the occupants seated in
the wall side. However, for higher airflow rate the
opposite is verified; References
The effectiveness for contaminant removal is [1] T. Arghand, T. Karimipanah, H. B. Awbi, M.
constant when the airflow rate increases; Cehlin, U. Larsson, and E. Linden, “An
The air quality number increases when the airflow experimental investigation of the flow and
rate increases; comfort parameters forunder-floor, confluent
6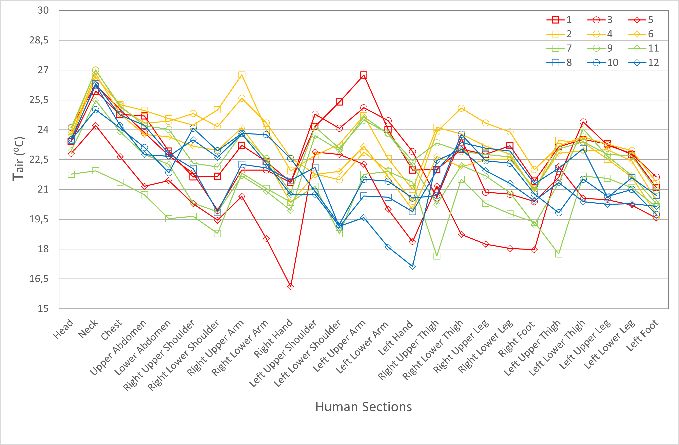
E3S Web of Conferences 246, 02005 (2021)                                                    https://doi.org/10.1051/e3sconf/202124602005
Cold Climate HVAC & Energy 2021

               jets and mixing ventilation systems in an open-          [14]   E. Z. E. Conceição, M. C. G. Da Silva, J. C. S.
               plan office,” Build. Environ., 2015, doi:                       André, and D. X. Viegas, “Thermal behaviour
               10.1016/j.buildenv.2015.04.019.                                 simulation of the passenger compartment of
       [2]     S. Ghahremanian and B. Moshfegh, “A study                       vehicles,” Int. J. Veh. Des., vol. 24, no. 4,
               on proximal region of low reynolds confluent                    2000, doi: 10.1504/IJVD.2000.005199.
               jets - Part 1: Evaluation of turbulence models           [15]   E. Z. E. Conceição and M. M. J. R. Lúcio,
               in prediction of inlet boundary conditions,”                    “Numerical simulation of passive and active
               2014.                                                           solar strategies in buildings with complex
       [3]     P. O. Fanger, A. K. Melikov, H. Hanzawa, and                    topology,” Build. Simul., vol. 3, no. 3, 2010,
               J. Ring, “Air turbulence and sensation of                       doi: 10.1007/s12273-010-0010-7.
               draught,” Energy Build., 1988, doi:                      [16]   E. Z. E. Conceição, M. M. J. R. Lúcio, and M.
               10.1016/0378-7788(88)90053-9.                                   C. Lopes, “Application of an indoor
       [4]     E. Z. E. Conceição, M. M. J. R. Lúcio, V. D. S.                 greenhouse in the energy and thermal comfort
               R. Vicente, and V. C. T. Rosão, “Evaluation of                  performance in a kindergarten school building
               local thermal discomfort in a classroom                         in the South of Portugal in winter conditions,”
               equipped with cross flow ventilation,” Int. J.                  WSEAS Trans. Environ. Dev., vol. 4, no. 8,
               Vent., 2008, doi:                                               2008.
               10.1080/14733315.2008.11683817.                          [17]   E. Z. E. Conceição and M. M. J. R. Lúcio,
       [5]     P. Ole Fanger, “Thermal comfort. Analysis and                   “Numerical study of the thermal efficiency of a
               applications in environmental engineering.,”                    school building with complex topology for
               Copenhagen Danish Tech. Press, 1970.                            different orientations,” Indoor Built Environ.,
       [6]     ISO, “ISO 7730: Ergonomics of the thermal                       vol. 18, no. 1, 2009, doi:
               environment Analytical determination and                        10.1177/1420326X08099550.
               interpretation of thermal comfort using                  [18]   E. Z. E. Conceição, J. M. M. Gomes, and A. E.
               calculation of the PMV and PPD indices and                      Ruano, “Application of HVAC Systems with
               local thermal comfort criteria,” Management,                    Control Based on PMV Index in University
               2005, doi: 10.1016/j.soildyn.2004.11.005.                       Buildings with Complex Topology,” IFAC-
       [7]     H. B. Awbi, Ventilation of Buildings. 2004.                     PapersOnLine, vol. 51, no. 10, 2018, doi:
       [8]     E. Z. E. Conceição, M. M. J. R. Lúcio, and H.                   10.1016/j.ifacol.2018.06.230.
               B. Awbi, “Comfort and airflow evaluation in              [19]   E. Z. E. Conceição, M. M. J. R. Lúcio, A. E. B.
               spaces equipped with mixing ventilation and                     Ruano, and E. M. Crispim, “Development of a
               cold radiant floor,” Build. Simul., vol. 6, no. 1,              temperature control model used in HVAC
               2013, doi: 10.1007/s12273-012-0093-4.                           systems in school spaces in Mediterranean
       [9]     E. Z. E. Conceição and M. M. J. R. Lúcio,                       climate,” Build. Environ., vol. 44, no. 5, 2009,
               “Numerical simulation of the application of                     doi: 10.1016/j.buildenv.2008.06.015.
               solar radiant systems, internal airflow and              [20]   E. Conceição, A. Silva, and M. Lúcio,
               occupants’ presence in the improvement of                       “Numerical study of thermal response of
               comfort in winter conditions,” Buildings, vol.                  school buildings in winter conditions,” in
               6, no. 3, 2016, doi: 10.3390/buildings6030038.                  Proceedings of the 9th Conference on Air
       [10]    E. Z. E. Conceição and M. Lúcio, “Numerical                     Distribution in Rooms (Roomvent 2004),
               and subjective responses of human thermal                       Coimbra, Portugal, 2004, pp. 5–8.
               sensation,” Proc. BioEng, 2001.                          [21]   E. Z. E. Conceição and M. M. J. R. Lúcio,
       [11]    E. Z. E. Conceição, “Evaluation of thermal                      “Numerical study of thermal response of
               comfort and local discomfort conditions using                   school buildings in summer conditions,” in HB
               the numerical modelling of the human and                        2006 - Healthy Buildings: Creating a Healthy
               clothing thermal system,” in RoomVent’2000-                     Indoor Environment for People, Proceedings,
               7th International Conference on Air                             2006, vol. 3.
               Distribution in Rooms, 2000, pp. 131–136.
       [12]    E. Z. E. Conceição, S. P. Rosa, A. L. V.
               Custódio, R. L. Andrade, M. J. P. A. Meira,
               and M. M. J. R. Lúcio, “Study of airflow
               around occupants seated in desks equipped
               with upper and lower air terminal devices for
               slightly warm environments,” HVAC R Res.,
               vol. 16, no. 4, 2010, doi:
               10.1080/10789669.2010.10390912.
       [13]    E. Z. E. Conceição, M. Lúcio, and J. P.
               Farinho, “Experimental and numerical study of
               personalized of ventilation in classrooms
               desks,” in Proceedings of the 10th
               International Conference in Rooms, Room
               Vent, Helsinki, Finland, 2007, pp. 13–15.

                                                                    7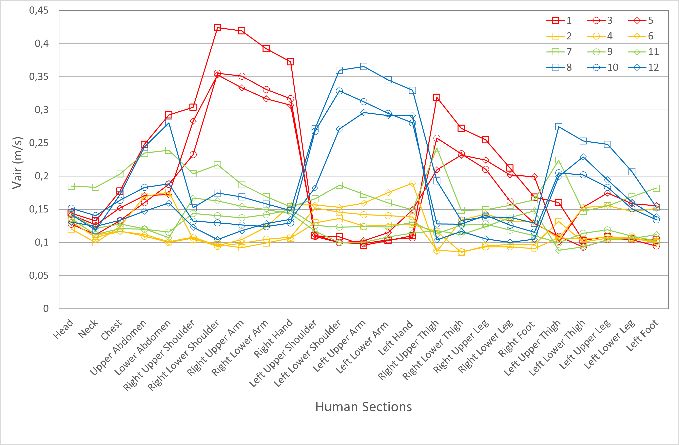
You can also read