Integrating renewables into the Japanese power grid by 2030 - Frequency stability and load flow analysis of the Japanese system in response to ...
←
→
Page content transcription
If your browser does not render page correctly, please read the page content below

Integrating renewables
into the Japanese
power grid by 2030
Frequency stability and load flow analysis
of the Japanese system in response to
high renewables penetration levels

Shota Ichimura (REI)
Dimitri Pescia (Agora Energiewende)

BERLIN, 11 APRIL 2019
Framework :
Is Japan more sensitive to
grid instabilities than other
power systems?
Solar PV has risen rapidly in Japan over the last five years, but
concerns regarding grid integration could raise the possibility
of a renewables slow-down
 Installed solar and wind capacities in Japan in 2010 and 2018. Projection for 2030 according
 to the government plan and the forecast of RES sector                                             Solar PV has risen rapidly over the last five years
GW                                                                                                 in Japan (55* GW installed capacity end of 2018),
180                                                                                                making the country one of the most dynamic PV
160                                                                                                markets outside of China.
140
                                                                                                   In Kyushu and Shikoku islands, hourly VRES
120
                                                                                                   infeed already covered respectively 84% and 79%
100                                                                                                of demand in summer (~ over 55% of hourly
  80                                                                                               production)
  60
  40
                                                                                                   However, the annual share of VRES is still rather
                                                                                                   low (~7%) and governmental renewables targets
  20
                                                                                                   for 2030 (22-24% RES, i.e. ~10% VRES) are
   0                                                                                               significantly below international averages.
         2010                     2018                               Gvt plan      RES      peak
                                                                                  sector    load
                                                                                forecasts          Concerns over whether RES can be efficiently
                                wind energy   solar PV   Peak load                2030             integrated into Japan’s power grid without
                                                                                                   endangering grid stability raised the possibility of
 Source (REI, BP, GWEC, METI), data for 2018 are preliminary, peak load data from 2017,            renewables slow-down in the country.
 Gvt plans 2030 represents current targets, RES 2030 forecasts from the RES sector (2017)

                                                                                                                                                    3
* preliminary data (BP, 2019)
Renewable integration is more challenging in island systems
than in interconnected systems. But Japan is actually made up
of large, interconnected islands
 Comparative energy data between Japan, France and Germany (as one region)
 and Ireland.                                                                              Island systems cannot benefit from cross-border
                                                                                           exchange to balance the system at lower costs.
                                                                                           Furthermore, the available inertia is lower in
                                                                                           islands than in large interconnected systems.

                                                                                           The Japanese power system is comprised of three
                                                                                           main AC synchronous areas : Western Japan (50
                                                                                           Hz), Easter Japan (60 Hz), Hokkaido (60 Hz).

                                   Peak     Yearly            Share of
                                                                         Wind and          Japan is an island system but it is not Ireland! The
                                                     Share of              solar           Japanese power system is comparable – in size –
                    Country*        load consumption          coal and
                                                      VRES               capacities
                                   (GW)     (TWh)             nuclear
                                                                           (GW)            to the sum of France and Germany. Hokkaido
                    Japan           165       979         6%    35%       52 GW            alone is comparable to Ireland.
                    Sum of France
                                  172         1100        14%   52%       129 GW
                    and Germany                                                            As a result, renewables grid integration and grid
                    Ireland          4,4       31         25%   19%        3 GW            stability is more challenging in Japan than in both
                                                                                           France and Germany (since Japan is not
 Source: Meti (2016), Entsoe (2017), RTE (2018), Agora /Sandbag (2018), REI (2018), SEAI   interconnected) but easier than in Ireland.
 (2018)

*2017 data for Japan. 2018 data for the European countries.                                                                                4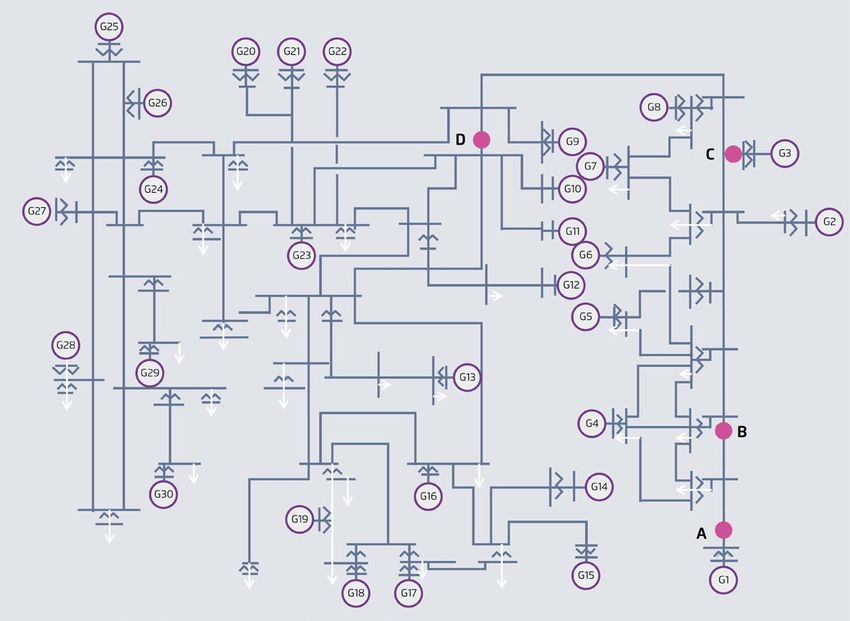
Maintaining power system stability is one of the most critical
 task of transmission system operators
   Typical frequency response behaviour in the event of a loss of generation          Power system stability refers to the capacity of an
                                                                                      electric system to regain a state of operating
                                                                                      equilibrium after being subject to a physical
                                                                                      disturbance.
                                                                                      In order to test system stability, the dynamic (or
                                                                                      transient) behavior of key physical values
                                                                                      (frequency, voltage, generator rotor angle) is
                                                                                      analyzed after a triggering event. This study
                                                                                      focuses only on the frequency stability in Japan.
                                                                                      Key physical values must remain in safe operating
                                                                                      range after disturbance as to avoid damages and
                                                                                      serious consequences for the system (cascading
                                                                                      effects, local black-outs, system splits,…)
                                                                                      The system inertia* and the control reserves
                                                                                      prevent the frequency from dropping. Frequency
                                                                                      nadir and RoCOF** are important parameters to
                                                                                      monitor, in order to limit frequency deviation
   EGI (2019)                                                                         incidents.

*Inertia is the kinetic energy stored in the rotating part of synchronous machines.
                                                                                                                                      5
**RoCoF is Rate of Change of Frequency. RoCOF is inversely proportional to inertia.
High vRES infeed can challenge stable grid operation in
isolated systems by pushing down the system inertia limits
Hourly generation in Japan in 2030 (left: one day in December in the
government scenario; right: one day in May in the +RES scenario)
                                                                                   By default, VRES is a non-synchronously
           Day in December                             Day in May                  connected generator and does not provide inertia.
    8% vRES West JP, inertia: 440 GWs       65% vRES West JP, inertia : 100 GWs)
    5% vRES East JP, inertia : 300 GWs       72% vRES East JP, inertia : 60 GWs)

                                                                                   High VRES infeed displaces synchronous
                                                                                   generators (nuclear, coal and gas power plants),
                                                                                   leading to a loss of system inertia.

                                                                                   Without additional counter-measures, an isolated
                                                                                   system with high vRES infeed can become more
                                                                                   vulnerable to frequency instabilities.

                                                                                   International experiences (Ireland, Denmark,
                                                                                   Texas,…) have shown that several technical
                                                                                   solutions exist to support frequency stability. This
                                                                                   study investigates the situation for Japan.
REI, Agora, EGI, gridlab

                                                                                                                                    6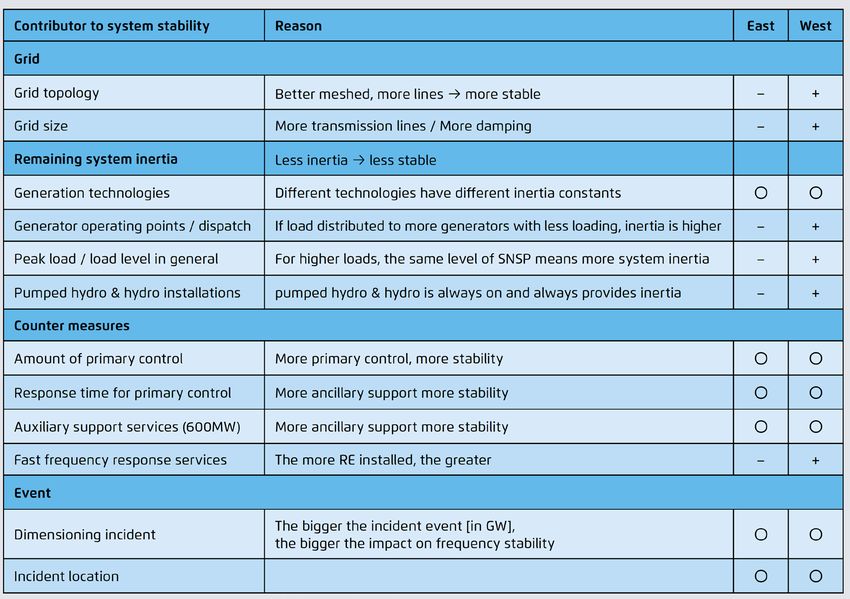
Model set-up for the Japan
grid study
Independent and transparent grid integration studies
contribute to a factually grounded debate

    Scenario development                            Dispatch modelling                      Grid modelling

     • Database                                   • Evaluation of hourly                • Evaluation of frequency
     • Projection of generation                     demand-supply structure               stability
       capacity                                   • Selecting snapshot                  • Load flow analysis
     • Estimation of RE output                      assessed in grid model              • Impact evaluation of
                                                                                          higher VRE penetration
         200    Geothermal
    GW

                Biomass
         150    Wind
                Solar
         100    Hydro

          50

           0
               2015   2020   2025   2030

                             Integrated discussion: Issues and countermeasures to expansion of RE capacity

                                                                                                                    8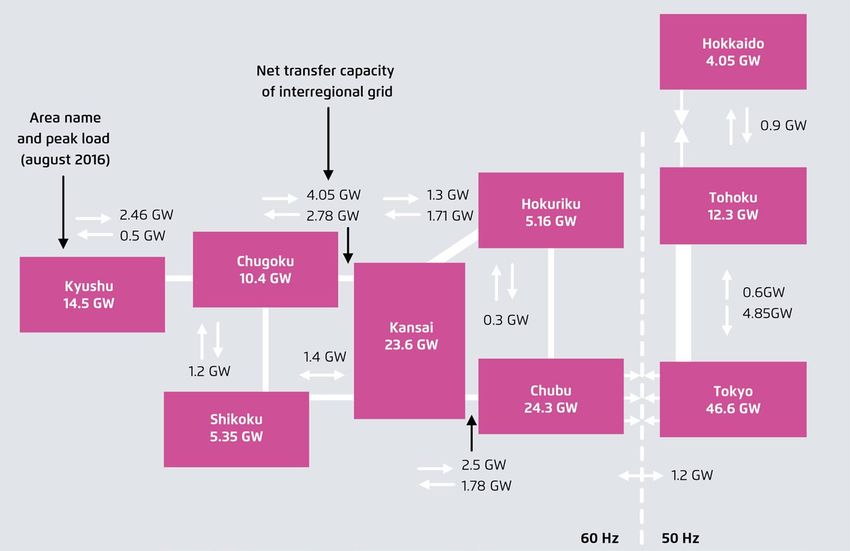
1. Scenario development : two scenarios were investigated for
the Japanese power system in 2030

  Government target scenario: long-term projection by government (PV:64GW, Wind:10GW; 60GW total coal + nuclear)
  Higher renewable energy scenario: based on target by RE industrial association (PV:100GW, Wind36GW; 37 GW total coal +
  nuclear*

             Energy mix in FY2030 based on the government                                                    Distribution of PV and Wind capacity in 2030
              long-term energy projection published in 2015
                                                                                             35
                                          PV, 7.0%

                                                                                        GW
                                                      Wind, 1.7%                                                  WIND
                                                                                             30
                                                              Hydro, 8.8~9.2%                                     PV
                                                                                             25

                                                                                             20
                         Coal, 26%                                 Geothermal,
                                                                    1.1~1.0%                 15
                                                                    Biomass, 3.7~4.6%
                                                                                             10

                                                                                              5
                     Oil, 3%
                                                 Nuclear, 22~20%
                                                                                              0

                                                                                                                                                 Kansai

                                                                                                                                                                                                                                      Kansai
                                                                                                                                                          Chugoku

                                                                                                                                                                    Shikoku

                                                                                                                                                                                                                                               Chugoku

                                                                                                                                                                                                                                                         Shikoku
                                                                                                  Hokkaido

                                                                                                                                                                                       Hokkaido
                                                                                                             Tohoku

                                                                                                                      Tokyo

                                                                                                                                                                              Kyushu
                                                                                                                              Hokuriku

                                                                                                                                                                                                  Tohoku

                                                                                                                                                                                                           Tokyo

                                                                                                                                                                                                                                                                   Kyushu
                                                                                                                                         Chubu

                                                                                                                                                                                                                   Hokuriku

                                                                                                                                                                                                                              Chubu
                               LNG, 27%
                                                                                                                        Government target                                                                  Higher renewable energy

* The investigated scenario considered 0 GW nuclear and 37 GW coal. However, the dimensioning parameter for the frequency analysis is not the level of nuclear and coal
capacities taken individually but rather the sum of both. The +RES scenario is therefore comparable to an alternative scenario were some coal generators have been                                                                                                          9
replaced by nuclear reactors located in the same area.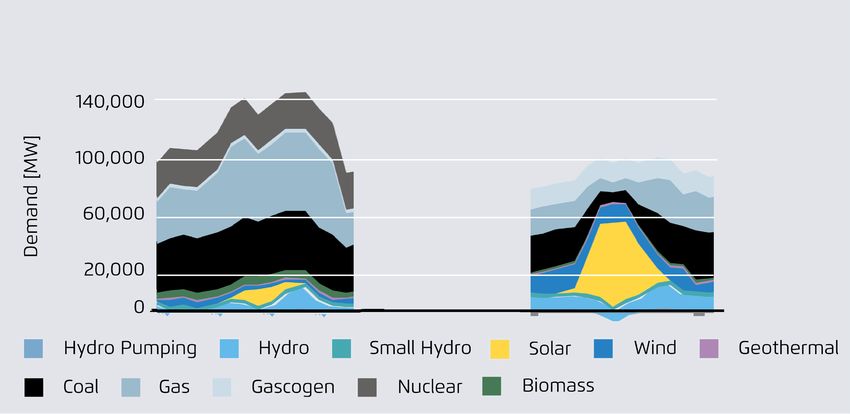
2. Dispatch modelling: Hourly demand-supply was simulated
in minimum/maximum demand day in each month in 2030 by
using the SWITCH model*
6 Hokkaido
8 Chugoku 4 Hokuriku Main flexibility : pumped-
GW
GW
4
GW
6
4 2 hydro (16 GW), cross-
2
2
0
region exchanges, thermal
0 0
-2 -2 power plants (coal and
1 5 9 1 5 9 -2 1 5 9 1 5 9 gas). Nuclear cannot
1 5 9 1 5 9 a.m. a.m. a.m. p.m. p.m. p.m.
a.m. a.m. a.m. p.m. p.m. p.m.
a.m. a.m. a.m. p.m. p.m. p.m.
operate flexibly in Japan.
10 Tohoku
10 Kyushu
In +RES scenario, the max.
GW
5
GW
5 0 PV in-feed for all Japan
0 -5 reaches 64 GWh/h and 26
-10
-5
1 5 9 1 5 9
GWh/h for wind**
1 5 9 1 5 9
a.m. a.m. a.m. p.m. p.m. p.m.
a.m. a.m. a.m. p.m. p.m. p.m.
Wind energy is produced
6 Shikoku 40 Tokyo
almost exclusively in East
20 Kansai 15 Chubu Japan
GW
GW
4 30
GW
GW
15 10
2 10 20
5
0 5
0
10 In Kyushu, Shikoku,
0
-2
-5 -5
0 Hokkaido and Tohoku
1 5 9 1 5 9 1 5 9 1 5 9
a.m. a.m. a.m. p.m. p.m. p.m.
1 5 9 1 5 9 1 5 9 1 5 9
a.m. a.m. a.m. p.m. p.m. p.m.
hourly VRES infeed can
a.m. a.m. a.m. p.m. p.m. p.m. a.m. a.m. a.m. p.m. p.m. p.m.
be above demand levels
■Interregional ■Hydro Pumping ■Hydro ■Solar ■Wind ■Geothermal ■Biomass ■Coal ■Gas
*SWITCH model was developed by Dr. Fripp Mathiass (Assistant professor at Hawaii University) and maintained by Renewable & Appropriate Energy Laboratory of UC
Berkeley. Hourly supply-demand of each area is simulated to minimize cost considering interregional electricity trade. 10
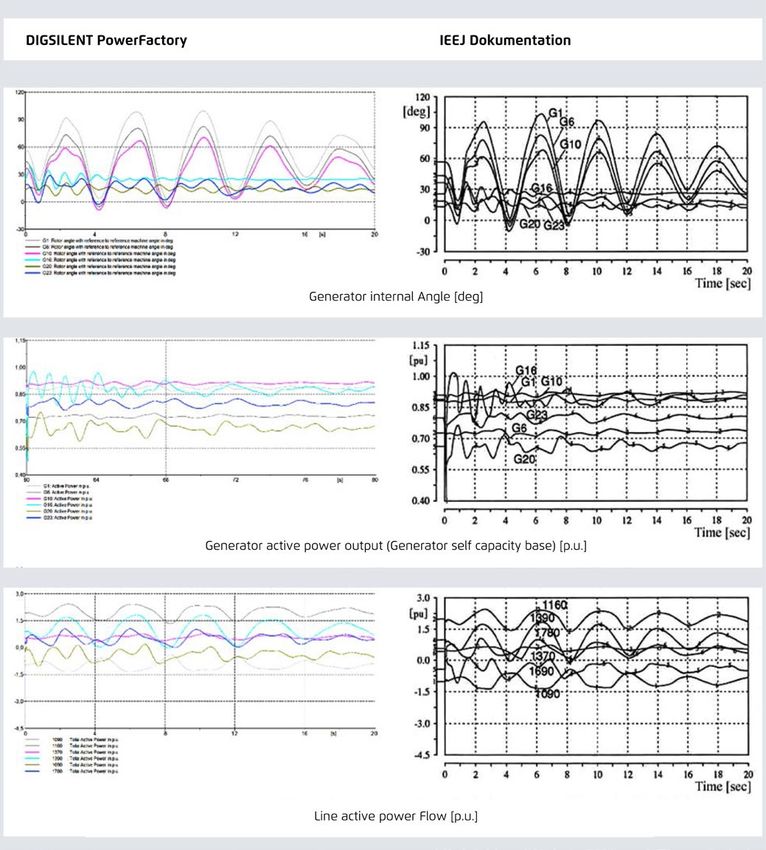
** For installed PV and wind capacities of respectively 100 GW and 36 GW.3. Grid model analysis : Evaluation of the impact of increasing
instantaneous VRE penetration on frequency stability and load
flow
Example of results validation in
IEEJ power system model (EAST30)
Powerfactory
Frequency stability analysis :
frequency variation caused by an incident
must be kept within a tolerable range
Methodology:
IEEJ power system model (2001 is
reconstructed and validated in
Powerfactroy (DIgSILENT) for this
analysis).
The constraint of frequency stability is set
to maintain frequency nadir within the
range of 0.98 p.u., which equals to the
threshold of 58.8Hz in the Western grid
and 49 Hz in the Eastern Grid.
IEE Japan (2001) IEE Japan, Gridlab
11Key results of the study
There are already existing technical measures to improve grid
stability in situations where high VRES infeed may place a
strain on grid operation
  Frequency response after loss of 1 500 MW for western Japan +RES scenario;
                                                                                                         Instantaneous penetration of VRES above a
  with and without wind and solar FFR
                                                                                                         certain threshold may violate the frequency
                                                                                                         stability limits of the Japanese power system
                                                                                                         (frequency nadir > 58,8 Hz in West Japan and >
                                                                                                         49 Hz in East Japan* and RoCoF < -0.2 Hz/s)
                                                                                                         The use of renewables-based Fast Frequency
                                                                                                         Response (FFR) services may allow higher
                                                                                                         instantaneous penetration levels, while still
                                                      S1 : Low vRES : August 7pm / 9,4% vRES
                                                      S2 : mid vRES : August 1pm / 44,8% vRES
                                                                                                         maintaining frequency stability in tolerable ranges
                                                      S2b : high vRES/mid load : July 1pm / 49,1% vRES
                                                      S3 : high vRES, low load : May 1pm / VRES 64,9%    FFR is a super fast (
The existing Japanese transmission grid can incorporate
instantaneous VRES penetration of up to 60% in East Japan
and 70% in West Japan, while maintaining frequency stability
Evaluation of the frequency nadir for the western synchronous area (left) and in
eastern Japan (right) under various vRES infeed Under conservative assumptions on grid stability
and without any other technical counter-measures,
VRES infeed above ~60% in West Japan and
above ~50% in East Japan could begin to
challenge the system frequency stability limit.
The use of renewables-based FFR* services may
allow instantaneous VRES penetration to rise to
~70% in West Japan and ~60% in East Japan,
while still maintaining frequency stability in
tolerable ranges.
These assessment confirm trends observed in
Kyushu and Shikoku in 2018 where hourly VRES
infeed covered already respectively 84% and 79%
of demand (and accounts for over 55% of
production). By 2030, those high regional infeed
would become the norm for Japan as a whole.
EGI, Gridlab, Agora, REI
* Fast Frequency Response
14The Western grid is more robust in withstanding internal
incidents than the Eastern grid
Comparison of factors influencing stability between the eastern and western synchronous areas
EGI/Gridlab (2019)
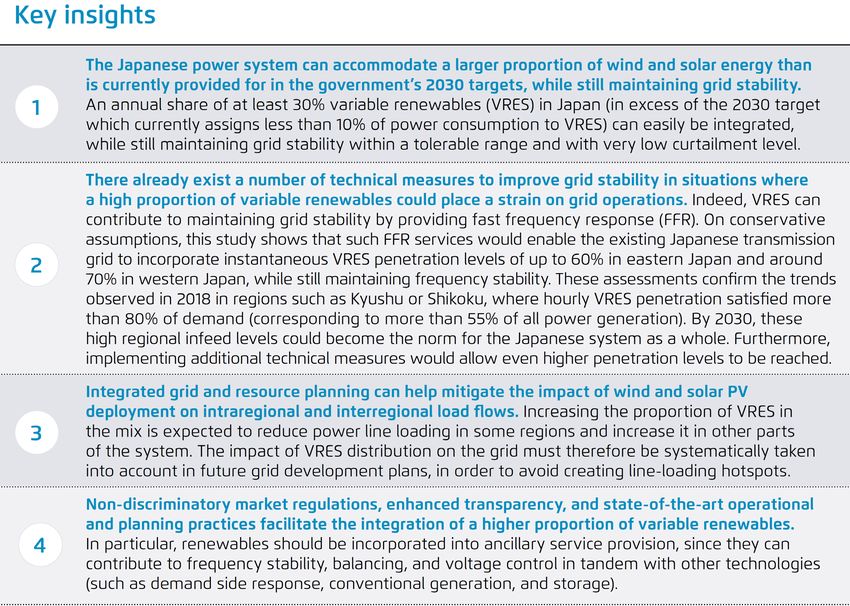
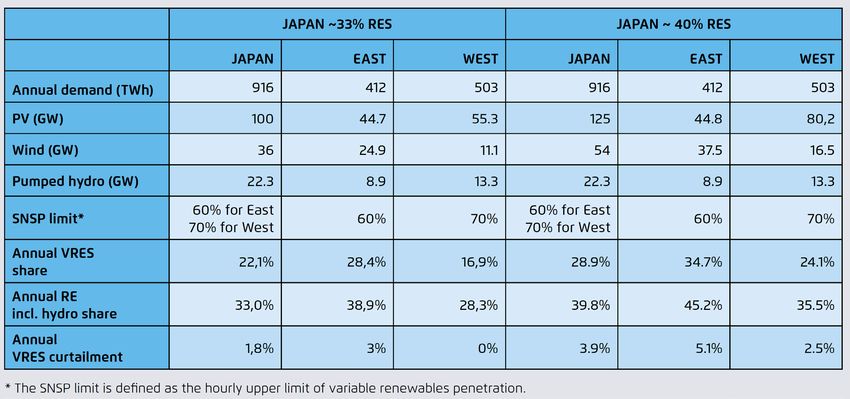
15An annual share of at least 30% VRES can easily be integrated,
while maintaining grid stability within tolerable ranges and
with very low curtailment levels.
Estimation of curtailment level in 2030 by introducing an upper SNSP limit of One solution to ensure stable system operation is
60% in East Japan and 70% in West Japan to introduce instantaneous penetration (SNSP*)
limits and curtail VRES infeed above those
thresholds. This is for example applied in Ireland
(today SNSP limit 65%. Objective to reach 75%)
Applying SNSP limits in line with the results of this
study (60% in East Japan and 70% in West Japan)
would lead to curtailment levels below 2% in the
+RES scenario**.
A higher renewable shares of 40% (corresponding
to 30% VRES) could also be achieved on the
same stability limit assumptions with only a very
small increase in the curtailment level to 4% of
annual VRES generation
Further VRES expansion entails considering
additional measures to maintain stability. This
should be implemented in the form of ancillary
services and provided by other technologies (DSR,
EGI, Agora, REI storage, synchronous condensers,…)
*SNSP : System Non-Synchronous Penetration 16
**The +RES scenario has a share of ~33% RES in 2030 (22% wind and solar energy)Integrated grid and resource planning can help mitigate the
impact of wind and solar PV deployment on intraregional and
interregional load flows
Line loading tendencies by region in 2030 the +RES scenario
More renewables does not necessarily mean more
congestion!
Location is key.
Increasing the proportion of VRES in the mix is
indeed expected to reduce power line loading in
some regions (Kyushu, Chugoku, Tohoku) and
increase it in other parts of the system (Tokyo,
Chubu, Kansai, Hokuriku)*
The impact of VRES distribution on the grid must
therefore be systematically taken into account in
future grid development plans, in order to avoid
creating line-loading hotspots
EGI, Gridlab (2019)
*This study could only assess high-level line-loading tendencies. A detailed evaluation of grid reinforcement measures would call for further investigation. This 17
would require greater transparency and improved data access.Non-discriminatory market regulations, enhanced
transparency and state-of the art of operation and planning
practices facilitate RES integration
Excerpt from Danish regulations for wind farms connected at a voltage level
above 100kV Variable renewables are not only bringing new
Wind mill output challenges in term of power system operation, but
(in % of nominal load) also provide solutions, for example to ensure
system stability.
RES should be integrated in ancillary service
provision, since they can contribute to frequency
stability, balancing and voltage control, in tandem
with other technologies (DSR, conventional
generation, storage)
Integrating renewables in ancillary services can
contribute to reducing the overall cost for ancillary
services procurement.
Non-discriminatory regulations must be
implemented in order to facilitate renewable
integration (through the definition of grid codes
provisions, but also in designing the different short-
DEA (2004) term and ancillary market segments)
18Conclusion - Key insights of the study
19Agora Energiewende T +49 (0)30 700 1435 - 000 Please subscribe to our newsletter via
Anna-Louisa-Karsch-Str.2 F +49 (0)30 700 1435 - 129 www.agora-energiewende.de
10178 Berlin www.twitter.com/AgoraEW
www.agora-energiewende.de
Thank you for
your attention!
Questions or Comments? Feel free to contact us:
s.ichimura@renewable-ei.org
dimitri.pescia@agora-energiewende.de
Agora Energiewende is a joint initiative of the Mercator
Foundation and the European Climate Foundation.You can also read