Status of Offshore Wind Energy Development in Germany - Year 2018 - On behalf of
←
→
Page content transcription
If your browser does not render page correctly, please read the page content below
Status of Offshore Wind Energy
Development in Germany

Year 2018

                 On behalf of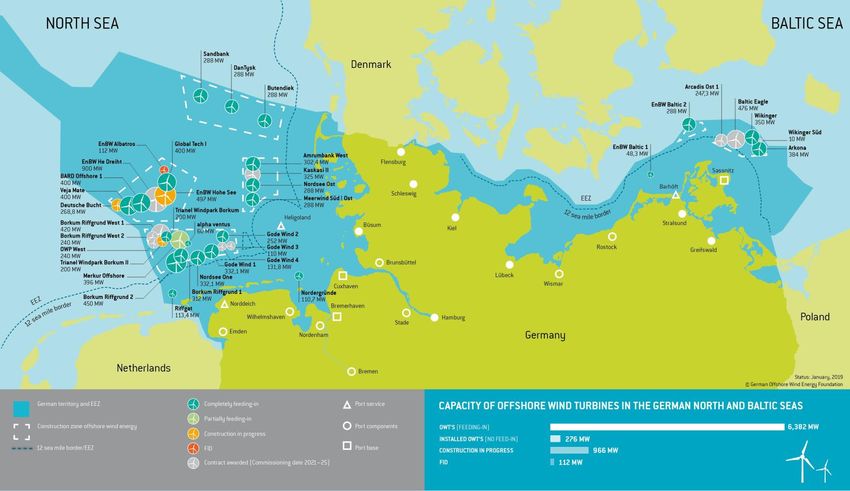
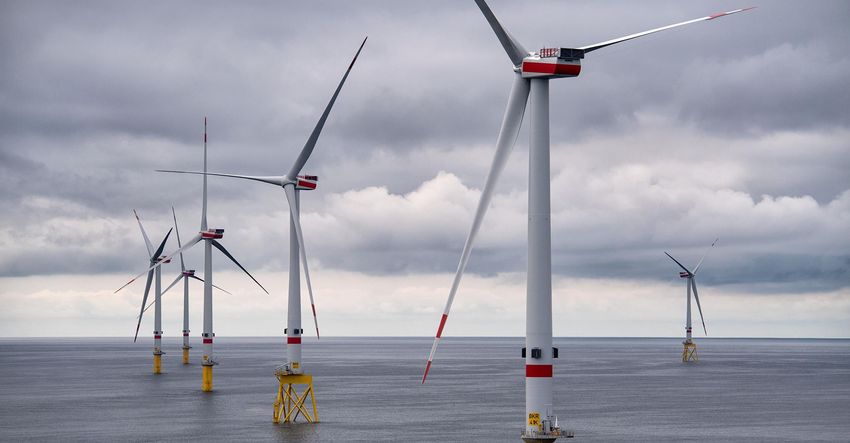
Status of Offshore Wind Energy Development in Germany – Year 2018

Contents
Offshore Wind Energy Development ....................................................................................................................................... 3
Turbine Configuration and Foundation Types ..................................................................................................................... 4
Water Depth and Distance to Shore ........................................................................................................................................ 5
Distribution across Federal States and North and Baltic Seas ....................................................................................... 6
Tender Results within the Transitional System .................................................................................................................... 7
Development Target and Assigned Grid Connection Capacity ..................................................................................... 8
Activities in Offshore Wind Energy Projects .......................................................................................................................... 9
Overview of Grid Connection Capacities ..............................................................................................................................10
Monthly Electricity Production and Market Values .........................................................................................................11

Notes
The data was obtained through surveys with industry representatives, as well as additional research (e.g.
BNetzA and BSH).
Retroactive adjustments to the data were done based on the BNetzA turbine portfolio and the master
data of transmission grid operators (TSO, German: Übertragungsnetzbetreiber or ÜNB).
The information provided within the text and figures partially includes rounded values. Thus, when
added, there is a possibility of deviations from the overall values.

Photo on Title Page
Offshore Wind Farm Borkum Riffgrund 2 (2018)
©Ørsted

Contact
Deutsche WindGuard GmbH
Oldenburger Strasse 65
26316 Varel, Germany
Phone         +49-4451 9515 0
Fax           +49-4451 9515 29
Email         info@windguard.de
URL           http://www.windguard.com/
Status of Offshore Wind Energy Development in Germany – Year 2018

Offshore Wind Energy Development
In Germany in 2018, 136 new offshore wind                                                              Status of the Offshore Wind Energy Development
turbine generators (OWT) producing an installed                                                                                          Capacity       Number
capacity of 969 MW started feeding into the grid.
The cumulative capacity of all 1,305 OWT feeding                                                                     OWT (feeding in)     969 MW          136 OWT

into the grid in Germany by December 31st, 2018

                                                                                                       Year 2018
                                                                                                       Additions
                                                                                                                     Installed OWT (no
was 6,382 MW. Compared to the previous year,                                                                                              276 MW           46 OWT
                                                                                                                     feed-in)
this equates to a 23% decrease in annual
                                                                                                                     Foundations w/o
additions.                                                                                                                                          124 Foundations
                                                                                                                     OWT
In addition to the OWT already feeding into the
                                                                                                                     OWT (feeding in)    6,382 MW        1,305 OWT
grid, over the course of the year 46 additional

                                                                                                       ´Cumulative
                                                                                                       2018-12-31
OWT with 276 MW had been fully erected but                                                                           Installed OWT (no
                                                                                                                                          276 MW           46 OWT
were not feeding into the grid by December 31st,                                                                     feed-in)
2018. By the end of the year, a further                                                                              Foundations w/o
                                                                                                                                                    124 Foundations
124 foundations had been prepared to receive                                                                         OWT
their respective OWT.

                                                      3,500 MW                                                                                 7,000 MW
                                                                     OWT (feeding in) - Cumulative Capacity
  Capacity (Addition, Modification and Dismantling)

                                                                     Annual Dismantling
                                                      3,000 MW                                                                                 6,000 MW
                                                                     Annual Capacity Modification
                                                                     OWT (feeding in) - Annual Additions
                                                      2,500 MW                                                                                 5,000 MW

                                                                                                                                                             Cumulative Capacity
                                                      2,000 MW                                                                                 4,000 MW

                                                      1,500 MW                                                                                 3,000 MW

                                                      1,000 MW                                                                                 2,000 MW

                                                       500 MW                                                                                  1,000 MW

                                                         0 MW                                                                                  0 MW
                                                                 2008 2009 2010 2011 2012 2013 2014 2015 2016 2017 2018
                                                      -500 MW                                                                                  -1,000 MW
                                                                                          Year of Commisioning

Development of the Offshore Wind Energy in Germany (Capacity of OWT Feeding into the Grid)

                                                                                                                                                                                   3
Status of Offshore Wind Energy Development in Germany – Year 2018
Turbine Configuration and Foundation Types
The additions of 2018 are characterized by a Looking at the total portfolio, monopiles by far
notable increase in size of offshore wind turbine are the most implemented technology. In second
generators. The OWT placed into service in 2018 and third place are jackets and tripods, which do
had an average nominal capacity of over 7 MW. not affect the current new construction.
Compared to the installations of the previous
year, rotor diameter and hub height also Average Turbine Configuration of OWT Feeding into
increased. The average specific area power the Grid
decreased slightly compared to 2017. Average Additions Cumulative
Monopiles were used for most of the OWT Configuration Year 2018 2018-12-31
foundations installed in 2018, corresponding to Nameplate Capacity
7,124 kW 4,890 kW
(incl. upgrades)
the trend of previous years. The second
Rotor Diameter 158 m 129 m
foundation technology employed in 2018, so-
called suction bucket jackets, is being used in Hub Height 106 m 93 m
larger numbers for the first time in a German Specific Power 363 W/m² 369 W/m²
project.
350
300
Number of Foundations
250
200
150
100
50
0
2012 2013 2014 2015 2016 2017 2018
Year of Foundation Installation
Monopile Jacket Tripod Tripile Suction Bucket Jacket
Foundation Types over Course of Time
4Status of Offshore Wind Energy Development in Germany – Year 2018
Water Depth and Distance to Shore
There are notable variances in water depth and the center field of portfolio projects with regard
distance to shore of offshore wind energy to water depth and distance to shore. In
projects in Germany. Some projects are barely particular, these are the North Sea-Cluster 2, as
20 km off the mainland coast, while projects in well as Baltic Sea projects. Projects realized in
the clusters of Zone 2 are clearly more than North Sea-Clusters 6 and 8 exhibit far larger
100 km away from the mainland. Water depths distances to shore and water depths. They
differ accordingly. belong to projects furthest from the mainland in
A number of projects currently in development or water depths of about 40 meters.
realized during 2018, respectively, are found in
160 km
Bubble Area ≘ Installed Capacity
140 km
120 km
Distance to Shore
100 km
80 km
60 km
40 km
20 km
0 km
0m 5m 10 m 15 m 20 m 25 m 30 m 35 m 40 m 45 m 50 m
Water Depth
Existing Projects Projects in Development in 2018
Water Depth and Distance to Shore
5Status of Offshore Wind Energy Development in Germany – Year 2018
Distribution across Federal States and North and Baltic Seas
Over the course of 2018, OWT were placed into
service both in the North and Baltic Seas. There
Lower Saxony
are currently no further OWT under construction
in the Baltic Sea. In comparison, at the end of
Mecklenburg-
2018 in the North Sea there existed not only non-
Western
grid feeding OWT, but also foundations ready to
Pomerania
be outfitted with OWT and OWT locations
awaiting work to be done to them. Schleswig-
In total, by year's end the capacity feeding into Holstein
the grid amounted to 5,306 MW in the North Sea
and 1,076 MW in the Baltic Sea.
With regard to the distribution across the
German federal states (allocation according to
the location of the grid connection point) the Cumulative Capacity
EEZ Territoral Waters
vast majority of installed capacity is allocated to
Lower Saxony. The share of OWT erected in Distribution of the Cumulative Capacity of OWT
(feeding in) across the Federal States and Sea Areas
territorial waters is small compared to OWT
located in the exclusive economic zone (EEZ,
German: Ausschließliche Wirtschaftszone or
AWZ).
Distribution across the North and Baltic Seas
North Sea Baltic Sea
Capacity Number Capacity Number
OWT (feeding in) 585 MW 76 OWT 384 MW 60 OWT
Year 2018
Additions
Installed OWT (no feed-in) 276 MW 46 OWT 0 MW 0 OWT
Foundations w/o OWT 124 Foundations 0 Foundations
OWT (feeding in) 5,306 MW 1,073 OWT 1,076 MW 232 OWT
´Cumulative
2018-12-31
Installed OWT (no feed-in) 276 MW 46 OWT 0 MW 0 OWT
Foundations w/o OWT 124 Foundations 0 Foundations
6Status of Offshore Wind Energy Development in Germany – Year 2018
Tender Results within the Transitional System
A total of 3.1 GW of the grid connection capacity Based on the current legislative environment, the
available up to 2025 was awarded in two next tendering round for offshore wind energy
tendering rounds in April 2017 and April 2018. will not occur until September of 2021 within the
Participation in these tendering rounds was only framework of the so-called central model.
permitted for projects within territorial waters, as 10 ct/kWh
well as in Zones 1 and 2 that had either been 9 ct/kWh
8 ct/kWh
approved or discussed prior to August 1st, 2016. 7 ct/kWh
Awarded Bid
The projects with the lowest per-kWh-cost were 6 ct/kWh
awarded winning bids. These projects are 5 ct/kWh
4 ct/kWh
scheduled to become operational starting in 3 ct/kWh
2021 and until 2025. The respective 2 ct/kWh
commissioning dates as planned by the 1 ct/kWh
0 ct/kWh
individual stakeholders align with the 2017 2018
corresponding grid connection availability. Tender Round
The bid values of the awarded projects of both Average Capacity-weighted Awarded Bid
tendering rounds range from 0 € cents/kWh to Published Project-specific Awarded Bids
9.83 € cents/kWh. On a capacity weighted Ⱶ Range of Award Prices
average, the award level of 0.44 € cents/kWh Range of Awarded Bids in Tender Rounds of the
from the 2017 round is significantly lower than Transitional System (Database: BNetzA)
the 4.66 € cents/kWh from 2018.
Awarded Offshore Projects in the North und Baltic Sea (Database: BNetzA, BSH, Additional Research)
Accepted Expected Year of
Project Tender Round Developer/Owner Awarded Bids
Capacity Commissioning
North Sea
Kaskasi II 2018 Innogy 325.00 MW 2022 unknown
OWP West 2017 Ørsted 240.00 MW 2024 0.00 € ct/kWh
Borkum Riffgrund West 2 2017 Ørsted 240.00 MW 2024 0.00 € ct/kWh
Gode Wind 3 2017 Ørsted 110.00 MW 2024 6.00 € ct/kWh
Borkum Riffgrund West 1 2018 Ørsted 420.00 MW 2024/25 0.00 € ct/kWh
Gode Wind 4 2018 Ørsted 131.75 MW 2024/25 9.83 € ct/kWh
EnBW He Dreiht 2017 EnBW 900.00 MW 2025 0.00 € ct/kWh
Baltic Sea
Arcadis Ost 1 2018 Parkwind NV 247.25 MW 2021 unknown
Wikinger Süd 2018 Iberdrola 10.00 MW 2022 0.00 € ct/kWh
Baltic Eagle 2018 Iberdrola 476.00 MW 2022/23 6.46 € ct/kWh
7Status of Offshore Wind Energy Development in Germany – Year 2018
Expansion Target and Allocated Grid Connection Capacity
Currently, the German Renewable Energy Sources In addition, during the April 2017 and April 2018
Act (German: Erneuerbare-Energien-Gesetz or tendering rounds of the transitional system
EEG) defines as development target an increase following the Offshore Wind Energy Act (German:
of installed offshore wind energy capacity to Windenergie-auf-See-Gesetz), projects with a
6.5 GW for 2020 and 15 GW for 2030. The goal capacity of 3.1 GW scheduled to become
defined for 2020 has almost been reached as of operational between 2021 and 2025 have been
today. A curtailment of development up to 2020 assigned. As a result, the overall cumulative
is set through the maximum allotted total capacity of 10.8 GW will be achieved by 2025. To
capacity of 7.7 GW as defined by the Energy reach the 2030 goal defined by the EEG, another
Industry Act (German: Energiewirtschaftsgesetz). 4.2 GW are needed. This capacity is to be
This capacity has been exhausted by projects that awarded in tendering rounds according to the
received grid connection confirmation prior to central model starting in 2021.
the onset of the tendering system.
4.2 GW OWT (feeding in)
Installed OWT (no feed-in)
6.4 GW
Development Taget for
Construction in Progress
2030
15 GW
Final Investment Decision
Expected Grid Connection Capacity assigned
Develpoment until
2025 3.1 GW
Accepted Projects in Transitional System
10,8 GW 0.3 GW
0.1 GW
1.0 GW Tender Volume in Central Model
0.002 GW
Expected Develpoment
until 2020
7,7 GW
Development Status of Offshore Capacity with expected Commissioning by 2030
8Status of Offshore Wind Energy Development in Germany – Year 2018
Activities in Offshore Wind Energy Projects
By December 31st, 2018, 22 offshore wind energy A final investment decision is available for project
projects (OWP) are operational in Germany. EnBW Albatros, which will be realized along with
Included are the projects Arkona and Borkum EnBW Hohe See. An investment decision was also
Riffgrund 2, in which all OWT started feeding into made in 2018 for two pilot OWT in the North Sea,
the grid during the course of 2018. Added to which will henceforth be attributed to the project
these are four additional OWP that were in the Deutsche Bucht. The OWT GICON-SOF has
construction phase by the end of 2018 and one secured its grid connection confirmation, but has
project with an existing investment decision. not yet received a final investment decision.
OWT installation within the OWP Merkur A total of 10 OWP were awarded during the
Offshore was completed and a number of OWT tendering rounds of 2017 and 2018. They have
were placed into service. hence secured their grid connection capacity and
Over the course of 2018, foundations were are to be realized by 2025.
installed in the projects Trianel Windpark
Borkum II, EnBW Hohe See and Deutsche Bucht.
Overview Map of Offshore Wind Energy in Germany 2018 (©Map: German Offshore Wind Energy Foundation)
9Status of Offshore Wind Energy Development in Germany – Year 2018
Overview of Grid Connection Capacities
By the end of 2018, in the German North and requirements will be based on the area
Baltic Seas a grid connection capacity of about development plan (German: Flächen-
6.8 GW was available for offshore wind projects. entwicklungsplan or FEP) developed by the
By 2020, further grid connection systems of Federal Maritime and Hydrographic Agency
1.4 GW overall are scheduled to be operational. (German: Bundesamt für Seeschifffahrt und
Additional capacities of 3.45 GW are budgeted by Hydrographie or BSH). The FEP is currently only
2025. available in draft and should be finalized by
For OWP that will be realized in the central June 2019.
system starting in 2026, offshore connection line
Installed and Planned Grid Connections (to Converter Station or Bundling Point) in the North and Baltic Seas
(Database: Draft FEP, O-NEP 2030 (2nd Draft, Confirmation and Implementation Report, Additional Research)
(Expect.) (Plan.)
Grid Connection System Status Assigned Offshore Wind Energy Projects
Commissioning Capacity
North Sea
Nearshore Emden In Operation 2004 4,5 MW Single OWT Nearshore
NOR-2-1 (Alpha Ventus) In Operation 2009 62 MW alpha ventus
NOR-6-1 (BorWin1) In Operation 2010 400 MW BARD Offshore 1
NOR-0-1 (Riffgat) In Operation 2014 113 MW Riffgat
Borkum Riffgrund 1, Trianel Windpark
NOR-2-2 (DolWin1) In Operation 2015 800 MW
Borkum
NOR-4-1 (HelWin1) In Operation 2015 576 MW Meerwind Süd | Ost, Nordsee Ost
NOR-5-1 (SylWin1) In Operation 2015 864 MW Butendiek, DanTysk, Sandbank
NOR-4-2 (HelWin2) In Operation 2015 690 MW Amrumbank West, Kaskasi II
NOR-6-2 (BorWin2) In Operation 2015 800 MW EnBW Albatros, Deutsche Bucht, Veja Mate
NOR-3-1 (DolWin2) In Operation 2016 916 MW Gode Wind 1, Gode Wind 2, Nordsee One
NOR-0-2 (Nordergründe) In Operation 2017 111 MW Nordergründe
NOR-2-3 (DolWin3) In Operation 2018 900 MW Borkum Riffgrund 2, Merkur Offshore
NOR-8-1 (BorWin3) Under Construction 2019 900 MW EnBW Hohe See, Global Tech I
Construction Preparations
NOR-3-3 (DolWin6) 2023 900 MW Gode Wind 3, Gode Wind 4
Under Way
In the Permitting Procedure, Borkum Riffgrund West 2, OWP West,
NOR-1-1 (DolWin5) 2024 900 MW
Award Process in Preparation Borkum Riffgrund West 1
NOR-7-1 (BorWin5) In the Permitting Procedure 2025 900 MW EnBW He Dreiht
Preparation of the Planning
NOR-7-2 (BorWin6) 2027 900 MW
and Permitting Procedures
Preparation of the Planning
NOR-3-2 (DolWin4) 2028 900 MW
and Permitting Procedures
Preparation of the Planning
NOR-6-3 (BorWin4) 2029 979 MW
and permitting Procedures
NOR-9-1 Named in the FEP draft n.a. 1,000 MW
Baltic Sea
Nearshore Rostock In Operation 2006 3 MW Single OWT Nearshore
OST-3-1 (Baltic 1) In Operation 2011 51 MW EnBW Baltic 1, GICON SOF
OST-3-2 (Baltic 2) In Operation 2015 288 MW EnBW Baltic 2
OST-1-1 (Ostwind 1) In Operation 2018 250 MW Wikinger
OST-1-2 (Ostwind 1) Under Construction 2019 250 MW Arkona
OST-1-3 (Ostwind 1) Under Construction 2019 250 MW Arkona, Wikinger, Wikinger Süd
In the Permitting and Award
OST-2-1 (Ostwind 2) 2021 250 MW Arcadis Ost 1
Procedure
In the Permitting and Award
OST-2-2 (Ostwind 2) 2021 250 MW Baltic Eagle
Procedure
In the Permitting and Award
OST-2-3 (Ostwind 2) 2022 250 MW Baltic Eagle
Procedure
OST-1-4 (or OST-2-4) Named in the FEP draft 2026 300 MW
OST-7-1 Named in the FEP draft 2027 n.a.
10Status of Offshore Wind Energy Development in Germany – Year 2018
Monthly Power Production and Market Values
According to calculations of the Fraunhofer ISE,
6 ct/kWh
German OWP fed 18.8 TWh of electricity into the
grid in 2018. This is equivalent to an increase in
5 ct/kWh
feed-in of offshore energy of 8% compared to
the previous year, giving offshore wind energy a
Market Value
4 ct/kWh
share of about 3.5% of the public power supply
in 2018. The production data forecasted by 3 ct/kWh
Transmission System Operators (TSO, German:
Übertragungsnetzbetreiber or ÜNB) is slightly 2 ct/kWh
higher.
The average, volume-weighted power market 1 ct/kWh
revenues per kilowatt hour for offshore OWT
0 ct/kWh
(monthly market values) increased notably over
Jan
Sep
Nov
Dec
Feb
Apr
Aug
Mar
May
Oct
Jul
Jun
the course of the year compared to the level of
the previous year. The average volume-weighted Market Value Offshore Wind Energy 2018
market value increased from 3.0 € cents/kWh in Market Value Offshore Wind Energy 2017
2017 by 37% to 4.1 € cents/kWh in 2018. Where Monthly Market Values for Offshore Wind Energy
in January 2018 the value was still at (Database: Netztransparenz)
2.5 € cents/kWh, in November the maximum
market value of the year of 5.4 € cents/kWh was
reached.
2.5 TWh 25 TWh
2.0 TWh 20 TWh
Cumulative Production
Monthly Production
1.5 TWh 15 TWh
1.0 TWh 10 TWh
0.5 TWh 5 TWh
0.0 TWh 0 TWh
Monthly Production 2018 Monthly Production 2017
Cumulative Production 2018 Cumulative Production 2017
Power Production from Offshore Wind Turbine Generators (Database: Projection by TSO (Netztransparenz)
11About Deutsche WindGuard In a complex energy market WindGuard is committed to providing extensive scientific, technical, and operational services which are unbiased and manufacturer-independent. WindGuard has been publishing the semi-annual development statistics since 2012. About the Bundesverband Windenergie e.V. (BWE) The Bundesverband WindEnergie e.V. (BWE) is a partner of over 3,000 wind energy industry companies and represents about 20,000 members. The entire know-how of a multifaceted industry is pooled through BWE. About Bundesverband der Windparkbetreiber Offshore e.V. (BWO) BWO represents all businesses that develop, construct and operate offshore wind farms in the German North and Baltic Seas. This allows BWO to combine forces to achieve a successful energy transition in Germany and Europe. About Stiftung OFFSHORE-WINDENERGIE The German Offshore Wind Energy Foundation was founded in 2005 on the initiative of the Federal Environment Ministry. Also participating were the coastal states and all economic sectors engaged in offshore wind energy. About VDMA Power Systems The association Power System and its working groups represent the interests of manufacturers and suppliers of power and heat generation plants. About the WAB e.V. WAB is the network of the onshore wind energy in Germany´s northwest region and serves as a nationwide contact for the offshore wind industry. Since 2002, more than 350 German companies and institutes have become members of WAB.
You can also read