2019 Moose Management Recommendation - to the Vermont Fish and Wildlife Board February 27, 2019
←
→
Page content transcription
If your browser does not render page correctly, please read the page content below
2019 Moose Management
   Recommendation
               to the
   Vermont Fish and Wildlife Board
        February 27, 2019

       Vermont Fish and Wildlife Department
            Agency of Natural Resources
        1 National Life Drive, Dewey Building
            Montpelier, VT 05620-3208
                    802-828-1000

                                                1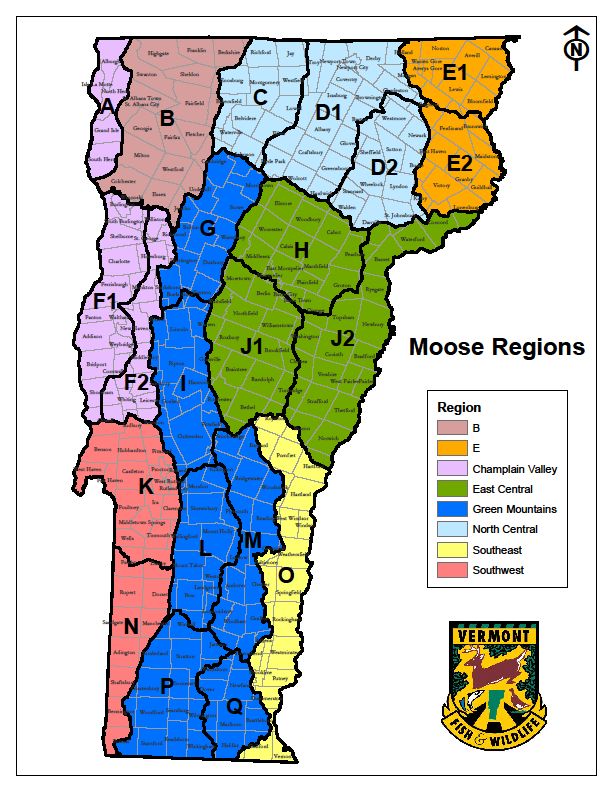
Recommendation
The Vermont Fish and Wildlife Department recommends that the Fish and Wildlife Board
approve zero (0) permits for the 2019 moose hunting seasons. The Department’s commitment to
fair and equitable access to hunting warrants that priority be given to addressing changes in
current Vermont statutes and Board regulations that constrain opportunities across all hunters in
Vermont’s moose hunting permit allocation structure. The Board should anticipate that once the
statutory issues are addressed by the Vermont Legislature, the Department will recommend a set
of changes to the moose rule for 2020 hunting seasons.
Moose Management Issues
Existing biological data support a limited hunting season of bulls-only in Wildlife Management
Unit E. This hunt would have very limited influence on moose population numbers there.
A basic tenet of wildlife conservation and management is the fair and equitable access and
enjoyment of wildlife. The Vermont Fish and Wildlife Department strives for equitable access
for hunters. As we learned in 2018; however, the existing statutory and regulatory framework for
the allocation of moose hunting permits prevents a fair opportunity for hunters. The current
system was developed at a time when permit numbers far exceeded the numbers that can be
sustained by the lower moose densities now experienced throughout the state.
Last years’ experience highlighted the need to make several changes to Vermont statutes and
regulations to accommodate issuing lower permit numbers. These potential changes include the
following:
            •   Consistency between statute and the moose rule regarding the number of auction
                permits;
            •   Adjusting veteran permits and auction permits from a set number to a percentage
                of the total moose permit recommendation; and
            •   Addressing the expiration or maintenance of bonus points when permit numbers
                are so low that the applicants have virtually no chance of being drawn and are
                consequently forced to submit money or lose their total bonus points.
It is the Department’s position that holding another moose hunting season under the constraints
experienced last year is not consistent with the tenet described above, and there is merit in
addressing this matter prior to holding another moose hunting season. It is important to note that
the pending moose management plan will incorporate the final analysis and conclusions of the
moose study into long-term management strategies to conserve and manage moose in Vermont.
This may require establishing revised moose density objectives, addressing public opinions and
input on management strategies, and informing the public of the management challenges ahead
for moose. The public discussion around the moose management issues alone from the planning
process will be helpful in guiding the Department’s moose plan. The outcome of the plan will be
important in setting the stage for moose management as early as 2020.

                                                                                                 2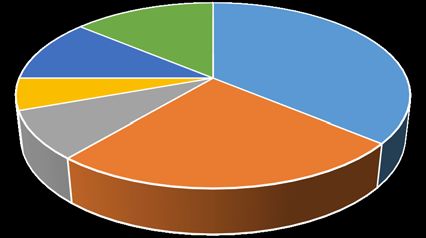
Biological Status of Moose
The Vermont Fish and Wildlife Department evaluated the biological status of Vermont’s moose
population using several key datasets. After its analysis at the regional level, the Department’s
Big Game Team determined that a moose season of 13 bulls-only permits limited to Region E
(WMUs E1 and E2) will, once again, have no significant effect on moose population trends.
These permit numbers, however, will once again be subject to the statutory and regulatory
constraints regarding the number of permits delegated to auction, veterans and special
opportunity hunts with no allowance for the general hunting public.

Status of Vermont’s Moose Population
The Vermont Fish and Wildlife Department uses several datasets that inform its moose population
models to monitor population trends at the statewide and regional levels (Figure 1).

                        Figure 1. Vermont moose management regions
Rolling three-year averaged moose sighting rates from deer hunter surveys are used as a population
index that is incorporated into our moose population estimation formula. The moose sighting rates
are an index of the population and not necessarily reflective of the true population, because many
factors (e.g., weather, hunter behavior) can affect sighting rates from one year to the next. Thus,

                                                                                                    3
we use other indexes of population such as incidental mortality reports along with survival and
productivity from the three-year moose study to assess how closely our population estimate
matches the true population. While moose sightings from the 2018 Deer Hunter Survey were
greater than the three-year average, and in Region E were 110% greater than the three- year
average (Table 1), comparison with incidental mortality, survival and productivity data suggest
the population is more likely to have remained stable with previous years or continued declining
in some regions.
Table 1. Moose sighting rates in 2018 compared to 2016-2018 average.
                                                 Sighting
                                                   rates       Percent
                           Region
                                              2016-           Difference
                                              2018 2018
                           WMU E1 & E2         1.31 2.75         110
                           North Central        0.3    0.32        7
                           East Central         0.2    0.31       55
                           Green Mountains     0.19 0.17         -11
                           WMU B               0.08 0.13          63
                           Champlain Valley    0.02 0.02           0
                           Southeast           0.02 0.02           0
                           Southwest           0.02 0.02           0

Moose population estimates: The increased sighting rates of moose by November season deer
hunters in 2018 resulted in greater three-year moose population estimates for four (4) of eight (8)
regions (Table 2). Of the four regions with target moose densities, only Region E (WMUs E1 and
E2) is within the current established threshold for hunting (25% of the target population). The bull:
cow ratios from last year’s Deer Hunter Survey are still good statewide (88 bulls:100 cows) and
within Region E (80 bulls:100 cows), and they remain consistent with adult sex ratio objectives.
The new rolling three-year estimate for Region E is 1.3 moose/mile2 (Table 2). It’s unlikely,
however, that the population in Region E could have grown that much with the 52% calf mortality
rates and relatively low fecundity rates observed in our collared moose study last year. Forty
hunters returned a Region E survey in 2018, and 9 different hunters saw a total of 90 moose. One
hunter, over 12 hunting days, saw 38, or 42% of all moose seen in Region E. If this one hunter had
not returned a survey, the Region E population estimate would have remained fairly stable at 1.11
moose/mile2, with an 80% confidence interval range of 0.95 to 1.28 moose/mile2.

Table 2. Rolling 3-Year 2016-2018 Moose population Estimate by Region

                                                                                                   4
2016 – 18
Target Density Target Percent
REGION Popn Pop Est Difference Difference
(Moose/Mile2)
(Density/mi2)
E 1.0 632 830 (1.3) 198 0.31
NC 0.5-1.0 834 342 (0.3) -491 -0.59
EC 0.25 - 0.5 507 309 (0.2) -198 -0.39
GM 0.0 - 0.5 994 410 (0.19) -584 -0.59
B NA NA 34 34 0.00
CV NA NA 0 0 0.00
SE NA NA 12 12 0.00
SW NA NA 0 0 0.00
Total 2967 1938 -1029 -0.35
Non-hunting Moose Mortalities: We maintain a statewide database of all recorded non-hunting
moose mortalities that occur in addition to the legal hunting harvest (Table 3). These data are
collected and reported on a biological year basis, which begins on June 1, after most of the moose
calves have been born. We review summaries of non-hunting moose mortalities each year when
we develop season recommendations, as this information helps us assess how well our moose
population estimate matches the true population.
The total number of moose dying from non-hunting causes in the Biological Year ending May 31,
2018 was 93, virtually unchanged from the previous year. The total for WMU E also remained
stable (26 vs. 25), supporting evidence that the WMU E population may not have increased as
indicated by the deer hunter sighting rates.
Table 3: Non-hunting Moose Mortality for Biological Year 2017 (7/01/17 – 6/30/18)
CAUSE OF DEATH
Illegal Motor Suspected Tick Other Unknown Total Total
Region Vehicle Brainworm BY2017 BY2016
E 0 19 1 2 0 4 26 25
Others 2 34 17 2 4 8 67 66
Total 2 53 18 4 4 12 93 91
5Moose Study Mortality and Productivity: In the second year of a three-year study, 30 8-month old
calves, along with 6 cows, were radio-collared in January 2018. Only 1 of 33 cows died during the
winter, resulting in a survival rate of 97%. Of 30 collared calves, one slipped its collar partway
through the winter season, and 15 of the remaining 29 calves died by the end of May. The 48%
calf survival rate was down from 60% the previous year (Figure 2).
Observed Winter Survival
1
0.9
0.8
0.7 0.90 0.97
0.6 n = 27 n= 32 2017
0.5
of 30 of 33
2018
0.4
0.6 0.48
n = 18 n = 14
0.3 of 30 of 29
0.2
0.1
0
Adult Calf
Figure 2. Vermont collared cow and calf winter survival rates, 2018 – 2019.
Infestation by winter ticks was implicated in the cause of death for many of these calves, and in
2018, 6 calves were also infected with brainworm. Over the two years of the study thus far,
winter ticks and brainworm have caused over two-thirds of collared moose mortalities (Figure 3).
2017/2018 Cause of Death
Ticks Only
Ticks/Brainworm 14%
11% 36%
Brainworm Only 6%
Septicemia 8% 25%
Other
Unkown
Figure 3. Cause of death of Vermont collared moose, 2017-2018.
6Total tick counts were made on 4 half-hides collected from deceased calves. The average estimated
tick load (actual number of ticks counted times 2) was 31,147 ticks (range 19,660 – 58,778). This
average was 47% higher than the 2017 average count of 21,134 ticks on 4 calf hides.
Similarly, the average number of ticks counted on rump and shoulder transects of live calves at
time of capture in January 2018 was 33.4, up 45% from 23.1 the previous year (Figure 3). The
observed increase in overwinter mortality in the second year of the study was therefore not
surprising.
Thirty additional 8-month old calves were collared in January 2019, and their average tick load at
capture was 32.6 ticks, representing no significant change from 2018 (Figure 4).
Figure 4. Average tick counts (from shoulder and rump transects) on Vermont calves at time
of capture in January, 2017-2019.
In addition to tick loads carried into the winter season, calf body weights have been correlated with
tick-induced mortality by published studies of New England moose. The average weight of
Vermont calves at time of capture has remained close to 380 pounds through all 3 years (Figure
5). With similar average tick count and body weight of calves collared in 2018 and 2019, losing
half of our calves this winter is once again possible.
7Figure 5. Average weight of collared Vermont calves at time of capture, 2017-2019.
Population Models: For Region E, we use a population model (MOOSPOP) to estimate the impact
of hunter harvest on the moose population. This model incorporates estimates of 1) current-year
population size, age structure, and adult sex ratio; 2) number of moose hunting permits to be issued;
3) hunter success rates; 4) seasonal mortality by age classes; and 5) ovulation rate by age class of
the cow. The starting population size is from the rolling 3-year average deer hunter sightings.
The Department applied analyses of moose data for Region E similarly to past years to quantify
the effects of various harvest prescriptions on the moose population trend. Trials were run using
limited versus zero moose hunting permits beginning in 2019. These trials were run with very
conservative application of moderate to severe population effects from winter ticks with a low tick
year every three years, as prescribed from moose research in New Hampshire. We also applied the
lower 80% confidence interval 2018 population estimate for Region E as a conservative starting
point (718 moose/1.14 moose/mile2 vs. 830 moose/1.31 moose/mile2). Tables 4 and 5 illustrate the
stabilizing effect of annually applying 13 bull-only permits under the winter tick scenarios offered
above. Of course, annual adjustments to the permit numbers allow for adaptive management to
achieve the target population. Interannual variability in survival and reproduction are impossible
to accurately predict, thus an adaptive management approach also allows for adjustments based on
what the final year of the moose study show and what subsequent years of non-hunting mortality
and moose sighting data show.
Table 4. MoosPop trial for Region E with 0 permits.
8Table 5. MoosPop trial for Region E with 13 permits.
Harvest Potential
The issuance of a small number of bull-only permits produces slightly different density estimates
but does not drive overall moose density trends in WMU E. Instead, fluctuations in winter
mortality of calves from winter ticks more significantly influences increases and decreases in
moose density over the five-year period. A season recommendation of 13 bulls-only permits for
WMU E is sustainable, will not influence the population over time, and is consistent with the goals
of the current moose plan, one of which is to provide hunting opportunities and local meat.
Proposed Timing and Outreach
The proposed moose management recommendation will be presented to the Fish and Wildlife
Board at their February 27, 2018 meeting. The Department will collect public comments for a
minimum of 30 days. Public input will be sought at three Department held public hearings to be
held in conjunction with the March deer meetings and through emails. The Department will
announce the public comment period through press releases, email distribution lists and its website.
9You can also read