Population Exposure to Ambient PM2.5 Pollution in China
←
→
Page content transcription
If your browser does not render page correctly, please read the page content below
Population Exposure to Ambient PM2.5 Pollution in China
1 Ying Long, Beijing Institute of City Planning, China, longying@bmicpd.com.cn
2 Jianghao Wang, Institute of Geographic Sciences and Natural Resources Research,
Chinese Academy of Sciences, China, wangjh@lreis.ac.cn (co-lead author)
3 Kang Wu, Capital University of Economics and Business, China, wukang@cueb.edu.cn
(corresponding author)
4 Junjie Zhang, University of California, San Diego, USA, junjiezhang@ucsd.edu
(corresponding author)
4 Results
4.1 Overall pattern
Using the above data and method, we estimate daily average PM2.5 concentrations for each
sub-district (see supplementary materials for validation results). A sub-district is polluted if its
PM2.5 level is above 75 μg/m3 on a particular day. First of all, we report the frequency (equivalent
number of months in a year) that a sub-district violates national ambient air quality standards.
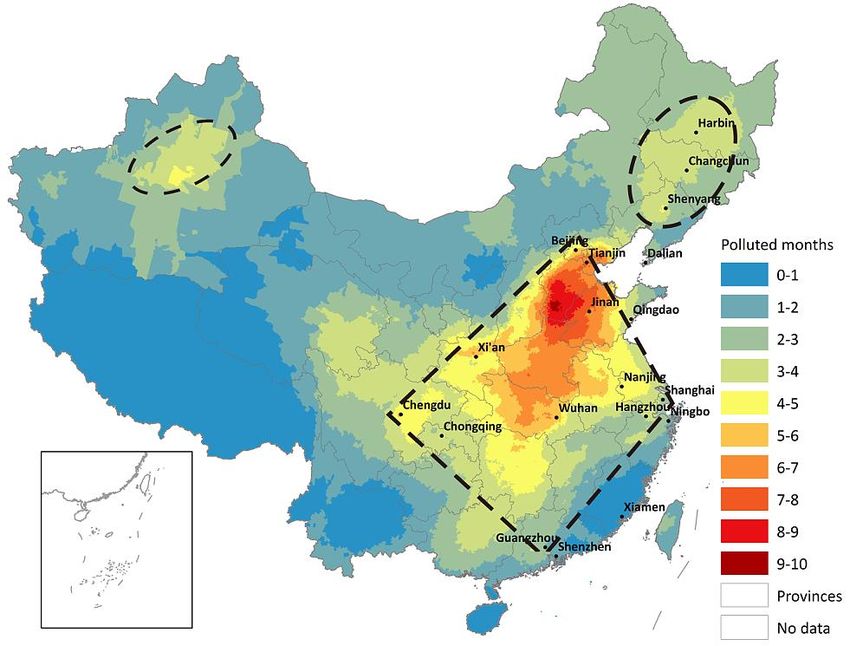
See Figure 2 and the online visualization at the Beijing City Lab.1 Our results highlight three
pollution hotspots in China indicated in Figure 2. The most pronounced hotspot is a
diamond-shaped large area that sprawls across eastern and central China. The area is anchored
by four major metropolitan areas: Beijing in the north, Shanghai in the east, Guangzhou in the
south, and Chengdu in the west. The other two hotspots are the Harbin-Shenyang Corridor in
Northeast China and northern Xinjiang with Urumqi as the center.
[Figure 2 about here]
The estimation results show that the mode of the months of PM2.5 pollution for the Chinese
sub-districts is 1-2 months in a year. Since the population centers tend to be more polluted, the
mode of population exposure to PM2.5 reaches 3-4 months in a year. Cumulatively, a total area of
243 million km2 has PM2.5 pollution longer than 3 months. In terms of the population exposed,
827 million people are exposed to PM2.5 pollution for longer than a quarter of a year. These
results are summarized in Table 1.
[Table 1 about here]
Nearly 11 percent of sub-districts (or 4,100 sub-districts) suffer from PM2.5 pollution over half a
year. These sub-districts are mainly located in Beijing, Tianjin, southern and central Hebei, central
and eastern Henan, central and western Shandong, and central Hubei. The total area of these
highly exposed sub-districts is 347,432 km2, or approximately 3.65% of mainland China’s land
area. These highly exposed sub-districts combined have more than 223 million people, almost 17%
of total population in mainland China.
1
Website: http://www.beijingcitylab.com
1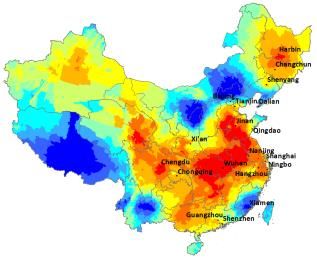
Moreover, the number of polluted months in some sub-districts is over 8 months and even up to
9 months in a year. These areas are mainly distributed in southern Hebei, northern Henan and
western Shandong, covering more than 121,000 km2 area and 90 million residents.

By contrast, less than half of the total sub-districts, or merely 18,664 sub-districts, have less than
3 polluted months. Low exposed sub-districts are mainly in the plateau and alpine regions like
Tibet and Northwest China, southeastern coastal regions (Fujian, Guangdong, and Hainan), and
southwestern border regions (Yunan, part of Guizhou, and Guangxi). Although the low exposure
regions cover three-quarters of China’s land areas, or 7,097,097 km2, they only accommodate 38%
of total population.

We calculate exposure intensity based on the estimated days of exposure and the population
density for each sub-district according to equation (2). The results are mapped in Figure 5.
Because the PM2.5 pollution and population density are highly correlated, exposure intensity
has the same spatial pattern as its two determinants. For each sub-district, the higher the
population density is, the more pollution the area is exposed to, and the greater exposure
intensity it has. Therefore, nearly all the densely populated sub-districts are among the worst
polluted regions (Figure 3a). In particular, the areas with high exposure intensity almost cover the
entire eastern-central China apart from east Fujian, the Harbin-Dalian corridor in the northeast,
and the Guanzhong and Chengdu Plain in the west. Therefore, the spatial pattern of exposure
intensity is more concentrated compared with population density. Although some sub-districts
have relatively low pollution levels, high population density still gives rise to serious exposure
intensity.2

Studies reveal that seniors and children are more susceptible to PM2.5 pollution (Zhang et al,
2002; Ashmore, 2009). We also estimate the exposure intensity for the susceptible subpopulation
defined as the age groups younger than 14 years old or elder than 65 years old. We find that the
pattern of the susceptible groups’ exposure intensity to PM2.5 (Figure S2) is similar to that of
the population exposure in Figure 3b.

[Figure 3 about here]

4.2 Seasonality of PM2.5 pollution

In this section, we aggregate the daily pollution level to the monthly level. More specifically, we
calculate the percentage of days within a month that is subject to PM2.5 pollution. Figure 4
illustrates the spatiotemporal variation of pollution exposure (population density not accounted).
Overall, Chinese people are exposed to PM2.5 pollution in almost every month of a year. The
seasonal fluctuation spreads and congregates in space due to a complex interplay with climate
difference, diffusion conditions, and coal combustion (Fenger, 1999; Stanners and Bourdeau,
1995).

2
  These sub-districts include the Pearl River Delta, eastern Guangdong, southeaster Zhejiang, Guangxi, Hunan,
and the Sichuan Basin.
                                                          2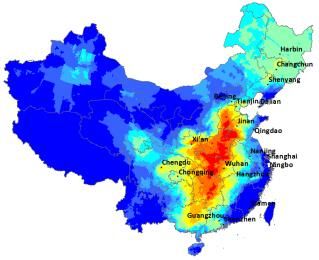
[Figure 4 about here]

Influenced by downdraft and coal-fired heating, PM2.5 pollution in winter half year (from October
to March) is generally much more serious than that of summer half year (from April to
September) (Zheng et al., 2005; Meng et al., 2007; Yang et al., 2011). The whole country is
suffered from incredibly high PM2.5 pollution in winter half year. Typically in December and
January, an overwhelming majority of sub-districts are exposed to PM2.5 pollution longer than 50%
of days in a month. Except for the regions with low human activities such as forests and plateaus,
the southeastern coastal areas like Fujian and Hainan are the only densely populated regions
with good air quality.

Pollution starts to abate from February and reach the minimal level in August. In spring and
summer, pollution is limited to a number of areas in the north due to the spring dust storm (He et
al., 2001). As demonstrated in Figure 4, the population in North China still suffers from high PM2.5
concentrations even between May and September.3 After August, pollution starts to increase
again; it expands from the north to the south gradually until it covers the most part of China in
December.
4.3 City-Level PM2.5 pollution

In this section, we aggregate the sub-district pollution level to the city level. Figure 5 illustrates
the spatial heterogeneity of PM2.5 pollution across 654 cities. The pollution pattern shows that
the northern cities are worse than southern cities, the inland cities are worse than the coastal
cities, and the plain and basin cities are worse than the plateau and hilly cities.

[Figure 5 about here]

The top polluted cities include the Beijing-Tianjin-Hebei region (BTH), Henan, mid-western
Shandong (except cities in the Shandong Peninsula), central Hubei, and central Shaanxi (eg, Xi’an).
The next tier of polluted cities with exposure between 111 and 158 days include the northeastern
Yangtze River Delta (YRD, eg, Nanjing), Chengdu Plain (eg, Chengdu), east Hubei, and Hunan (eg,
Wuhan and Changsha). Residents in the major urbanization city-regions like BTH, YRD,
Chengdu-Chongqing, and the middle reaches of Yangtze River are exposed to PM2.5 pollution for
longer than 100 days a year. The exception is that the Pearl River Delta (PRD), east Fujian, the
Shandong Peninsula, and the Liaodong Peninsula have relatively lower PM2.5 exposure.

Furthermore, we rank all cities in terms of days of exposure to PM2.5 pollution (see Table S1). We
find that the worst 20 cities are mostly from central or southern part of Hebei province. This
region is clustered with of the iron and steel industry that highly rely on coal consumption. The
cities in Tibet, Yunnan, and Fujian are among the cleanest cities in China in terms of PM2.5
pollution.

We propose to use total exposure, product of pollution days and population, to identify cities

3
 These areas include the Beijing-Tianjin-Hebei (BTH) region, southeastern Shanxi, northern-central Henan, and
western Shandong.
                                                       3
with the worst PM2.5 pollution. All cities are ranked by this indicator and the top 20 worst cities
are listed in Table S2. Beijing ranks the top in this category, indicating a huge amount of
population was exposed to PM2.5 pollution in the past year. The other three metropolitan
cities—Tianjin, Shanghai, and Chongqing—are all on the top of the list among other big cities.
Although some cities have relatively short duration of exposure, the risk of pollution is still high
because of the concentrated population.

Furthermore, we focus on the PM2.5 exposure in the thirteen major urbanization regions that are
identified by the Ministry of Environmental Protection of China as key regions in air quality
management. Table 2 presents various exposure indicators in the thirteen major urbanization
regions via aggregating indicators of cities within each region. The troubling fact is that half of
these city-regions had over 100 pollution days in the past year. Only Fujian province’s annual
average concentration achieved a relatively low level of 37μg/m3 but still slightly above the
national standard of 35μg/m3. The percentage of city-regions that attained the PM2.5 standard is
negligible.

[Table 2 about here]

4.4 Simulation Results

We first simulate the implication of several stages of PM2.5 standards proposed by the WHO in
2005. The WHO recommended standard for daily average PM2.5 concentration is 25 μg/m3. Its
adopters include Canada and Australia. The three interim targets are: 75 μg/m3 adopted by China,
India, and Mexico (interim-target 1, IT-1), 50 μg/m3 adopted by EU and Thailand (interim-target 2,
IT-2), and 37.5 μg/m3 adopted by the United States, Japan, and Singapore (interim-target 3, IT-3).
We simulate population exposures under each standard for the counterfactual analysis. If the IT-2
standard (50 μg/m3) is used, 776 million people are exposed to PM2.5 pollution for longer than
half a year; if the standard is raised to IT-3 (37.5 μg/m3), the exposed population increases to
1195 million. Under the WHO recommended standard of 25 μg/m3, 1,322 million people, or
96.5% of the Chinese population in 2010, live in the polluted environment for over half a year.
The simulation results of population exposure under various hypothetic standards are
summarized in Figure 6.

[Figure 6 about here]

In addition, we simulate the implication of China’s most recent air pollution control plan. The
Chinese government has enacted the Air Pollution Prevention and Control Action Plan to tackle
the challenge of air pollution. The plan requires the PM2.5 concentrations in three major
metropolitan areas—Beijing-Tianjin-Hebei, Yangtze River Delta, and Pearl River Delta—to
decrease by 25%, 20%, and 15% respectively. In this plan, the target for Beijing is to limit its
annual average concentration of PM2.5 to 60 μg/m3 as of 2017 (85 μg/m3 in our study). There is
no specific requirement for the areas beyond the aforementioned three metropolitan areas. The
simulation result in Figure 6 demonstrates that population exposure to PM2.5 is reduced
significantly if the plan can achieve its target. For instance, 184 million people are exposed to

                                                 4
PM2.5 over half a year in 2017, in contrast to 223 million during 2013-2014.

6 Conclusions

This paper assesses China’s potential population exposure to PM2.5. We estimate daily PM2.5
concentrations using both ground-based measurements and MODIS AOD images at the
sub-district level. We map PM2.5 concentration for each sub-district to gain knowledge on the
overall pattern and spatiotemporal variations. We also simulate the potential population
exposure under various hypothetical scenarios, including different stages of standards proposed
by WHO and China’s most recent Air Pollution Prevention and Control Action Plan. Our results
show that China’s PM2.5 pollution will still be abysmal even if it can achieve the target in the plan,
which calls for further actions to mitigate the pollution of fine particles.

Tables and Figures

Table 1 PM2.5 pollution under China’s ambient air quality standards
Months          of    Cumulative area exposed             Cumulative population exposed
pollution             (10,000 km2)                         (million people)
≥1                    745                                 1,241
≥2                    470                                 1,070
≥3                    243                                 827
≥4                    110                                 550
≥5                    61                                  355
≥6                    35                                  223
≥7                    12                                  90
≥8                    4                                   34
≥9                    0.4                                 3

Table 2 Basic exposure indicators in 13 major urbanization regions
                                                Annual         average     Percentage of
City-region                     Exposed day
                                                concentration (μg/m3)      qualified cities
Beijing-Tianjin-Hebei           219             107                        0
Yangtze River Delta             99              64                         0
Pearl River Delta               53              44                         4.5
South-Central Liaoning          80              56                         0
Shandong                        146             80                         0
Wuhan metropolitan area         161             87                         0
Changsha-Zhuzhou-Xiangtan       127             71                         0
Chengdu-Chongqing               113             66                         0
Fujian                          17              37                         43.5
North Central Shanxi            128             70                         0
Central Shaanxi                 132             79                         0
                                                  5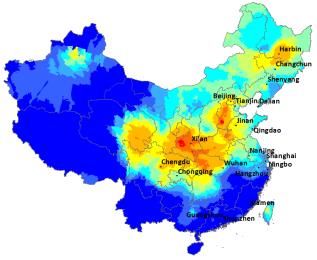
Annual         average    Percentage of
City-region                    Exposed day
                                               concentration (μg/m3)     qualified cities
Gansu and Ningxia              69              58                        0
Northern Xinjiang              89              60                        0

Figure 1 Spatial distribution of monitoring stations in 190 Chinese cities

                                                 6
Figure 2 The number of polluted months in a year for each Chinese sub-district violating
national PM2.5 standard

(a)

                                           7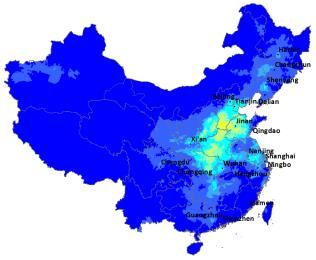
(b)
Figure 3 Population density (a, persons per km2) and exposure intensity (b, polluted
days*persons per km2) at the sub-district level

                                         8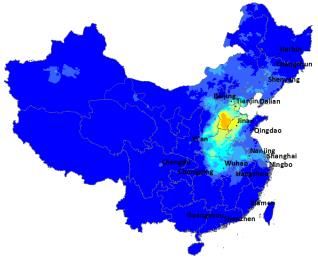
Apr 2013                           May 2013                 Jun 2013   Jul 2013

                                                                                  Exposed ratio
                                                                                  In each
                                                                                  month

Aug 2013                           Sep 2013                 Oct 2013   Nov 2013

Dec 2013                           Jan 2014                 Feb 2014   Mar 2014

Figure 4 Exposed days in each month for each sub-district

                                                                   9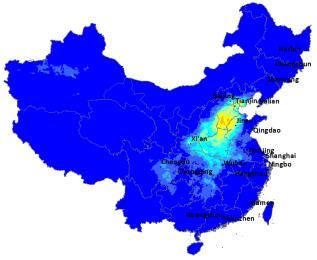
Figure 5 Polluted days for each Chinese city

Figure 6 Statistical descriptions for polluted months under various WHO standards

                                               10
Supplementary materials
S1 Inventory of estimated exposures for all Chinese cities
The inventory including a map and the raw data is available for free access at the website of the
Beijing City Lab (http://www.beijingcitylab.com/projects-1/13-pm2-5/). Tables S1 and S2 rank
selected Chinese cities in terms of PM2.5 pollution and the potential population exposure.
Table S1 Ranking of Chinese cities in PM2.5 pollution
Top 20 worst cities Top 20 best cities
Population Days of Population Days of
City City
(million)4 Exposure (million) Exposure
Xingtai 0.7 279 Fuqing 1.2 15
Shahe 0.5 260 Fuzhou 2.9 15
Nangong 0.5 255 Ruili 0.2 14
Handan 1.4 253 Yongan 0.3 14
Linqing 0.7 253 Putian 1.9 12
Shijiazhuang 2.6 252 Kunming 3.5 11
Jizhou 0.4 252 Shishi 0.6 11
Gaocheng 0.8 250 Longhai 1.0 11
Jinzhou 0.5 248 Chuxiong 0.6 11
Anyang 0.6 246 Longyan 0.7 11
Xinji 0.6 245 Jinjiang 1.9 10
Wuan 0.8 244 Zhangping 0.2 10
Hengshui 0.5 241 Zhangzhou 0.5 10
Dezhou 0.6 240 Quanzhou 1.5 9
Xinle 0.5 239 Xiamen 3.5 8
Luquan 0.4 238 Nanan 1.4 8
Shenzhou 0.6 238 Yuxi 0.5 7
Liaocheng 1.1 238 Anning 0.3 6
Anguo 0.4 238 Lhasa 0.3 2
Yucheng 0.5 238 Shigatse 0.1 2
Table S2 Ranking of cities in potential population exposure to PM2.5 pollution
Total Annual
Population Exposed exposure average
City Area(km2)5
(million) days (million concentration
people*days) (μg/m3)
Beijing 18.9 161 3048 84 12163
Tianjin 10.4 204 2130 94 7158
4
The population is for the whole county if a city is county-level city. For other cities with higher administrative
rank, the population is for the city proper.
5
The area is for the administrative boundary of each city, rather than the urban built-up area.
11Total Annual
Population Exposed exposure average
City Area(km2)5
(million) days (million concentration
people*days) (μg/m3)
Shanghai 22.4 88 1964 60 5476
Wuhan 9.7 158 1535 85 8583
Chengdu 7.4 150 1114 81 2171
Chongqing 11.4 97 1104 61 15385
Xi’an 6.5 162 1056 91 3569
Nanjing 7.2 138 991 76 4736
Jinan 4.1 213 873 98 3070
Zhengzhou 4.1 201 832 96 1015
Guangzhou 11.1 65 723 50 3412
Shenyang 6.3 108 676 64 3471
Harbin 5.8 115 668 69 7016
Tangshan 3.2 205 653 96 3253
Shijiazhuang 2.6 252 645 136 379
Hangzhou 6.3 98 619 66 3344
Zibo 3.1 188 589 91 2984
Suzhou 5.3 109 581 68 4606
Foshan 7.4 75 551 52 3798
Xuzhou 3.1 148 451 80 3038
12You can also read