Optimization of Promethazine and Demethylpromethazine Separation Conditions in Capillary Electrophoresis by Response Surface Methodology
←
→
Page content transcription
If your browser does not render page correctly, please read the page content below
Int. J. Electrochem. Sci., 16 (2021) Article ID: 210333, doi: 10.20964/2021.03.36

                                                                        International Journal of
                                                                        ELECTROCHEMICAL
                                                                                SCIENCE
                                                                              www.electrochemsci.org

Optimization of Promethazine and Demethylpromethazine
Separation Conditions in Capillary Electrophoresis by Response
Surface Methodology
Chunxiu Gu1,2, BingHan1, Yan Dong1,*, Baining Liu1,2,*, Kaowen Zhou1,2,*
1
  Biochemical Engineering College, Beijing Union University, Beijing 100023, China
2
  Beijing Key Laboratory of Biomass Waste Resource Utilization, Beijing 100023, China
*
 E-mail: zhoukaowen@buu.edu.cn, dongyan@buu.edu.cn, liubaining@buu.edu.cn

Received: 11 November 2020/ Accepted: 2 January 2021 / Published: 31 January 2021

Demethylpromethazine (DMPMZ) is one of the main metabolites of promethazine (PMZ). DMPMZ
has only one methyl less than PMZ. In the past, in order to separate them by capillary electrophoresis
(CE), it is often necessary to add additives to separation buffer solution. Under the optimized
experimental conditions by response surface methodology, however, PMZ and DMPMZ can be
separated well without using additives. The optimum CE conditions were 21.846 mmol/L phosphate
buffer solution (pH 5.653) and separation voltage of 14.408 kV. The resolution of PMZ and DMPMZ
is more than 1.5 without any additives under the optimized experimental conditions. The optimization
method is universal for many multiparameter processes.

Keywords: Capillary electrophoresis; Promethazine; Demethylpromethazine; Optimization; Response
surface methodology

1. INTRODUCTION

        Capillary electrophoresis (CE) is an efficient method for separation of biochemical and medical
analytes because of its strong separation ability, short analysis time and less sample consumption. Tris
(2,2’-bipyridyl) ruthenium (II) (Ru(bpy)32+)-based electrochemiluminescence (ECL) for detecting
organic amine compounds has attracted much attention due to its inherent high sensitivity and
selectivity in the past decades. CE separation with end-column ECL detection (CE-ECL) has been
extensively studied and utilized for the analysis of various drugs [1–21], antibiotics [22–24], enzymes
[25], alkaloids [26–29], amines [30–34], hormones [35] and pesticide residues [36, 37] in different
foods, pharmaceuticals, animals and plants.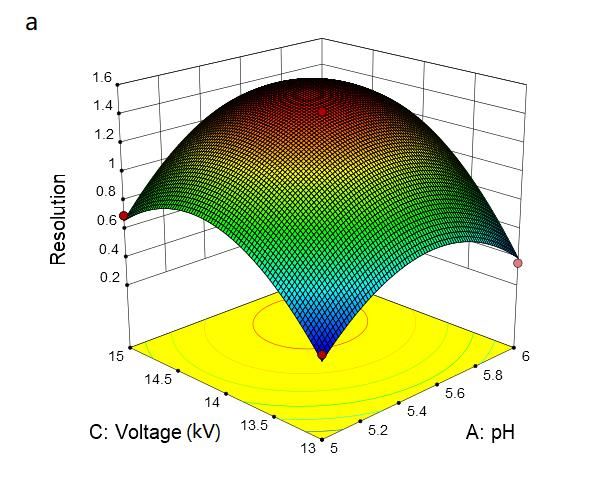
Int. J. Electrochem. Sci., 16 (2021) Article ID: 210333                                               2

        Promethazine (PMZ) is widely used as an antihistamine to alleviate allergic symptoms and
enhance the analgesic, anesthetic and sedative effects of other drugs [38]. In vivo, PMZ can be
biotransformed into a variety of metabolites which most belong to the phenothiazine category which
contain tertiary amine groups, such as promethazine sulfoxide (PMZSO), demethylpromethazine
(DMPMZ), dioxopromethazine (DOPMZ), dihydroxypromethazine (DHPMZ) and so on.
Simultaneous determination of PMZ and its metabolites in blood or urine is extremely important to
realize the economic effect and pharmacokinetics of PMZ. DMPMZ has only one methyl less than
PMZ (see Figure 1). In the past, in order to separate them by CE, it is often necessary to add additives
to separation buffer solution [39, 40], otherwise they could not be completely separated. However,
under the optimized experimental conditions by response surface methodology (RSM), DMPMZ and
PMZ can be separated well without using additives.

                                     N                                  NH

                                 N                                  N

                                 S                                  S

                               PMZ                              DMPMZ

                   Figure 1. Structure of promethazine and demethylpromethazine.

        RSM is a statistical method to solve multivariable problems by using appropriate experimental
data to find the optimal process parameters [41, 42]. There are many reports in the literature about the
optimization of experimental conditions by RSM [43-46]. In this paper, on the basis of single factor
experiments, RSM is used to investigate the interactions of different factors. It is expected that PMZ
and DMPMZ can be separated directly by optimizing the separation conditions of CE.

2. EXPERIMENTAL

2.1. Materials and Reagents

       Tris (2,2’-bipyridyl) ruthenium (II) dichloride hexahydrate (Ru(bpy)3Cl2·6H2O) was purchased
from Alfa Aesar (Johnson Matthey, USA). Disodium hydrogen phosphate (Na2HPO4) and sodium
dihydrogen phosphate (NaH2PO4) were all of analytical reagent grade and were purchased from
Beijing Chemical Factory (Beijing, China). PMZ and DMPMZ standard substances were purchased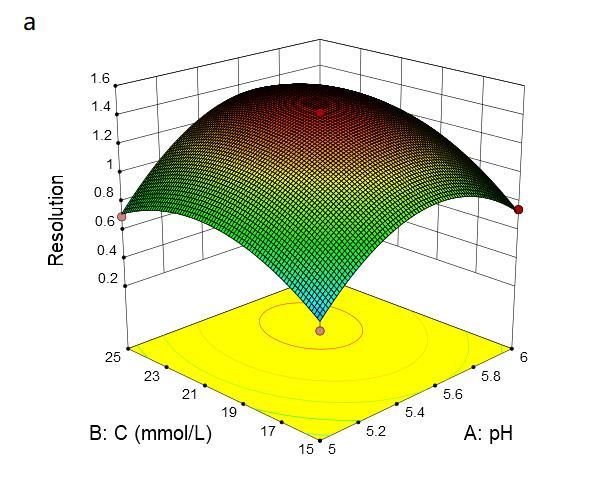
Int. J. Electrochem. Sci., 16 (2021) Article ID: 210333                                               3

from National Institutes for Food and Drug Control (Beijing, China).

2.2. Solutions preparation

       Ru(bpy)32+solutions were prepared with Ru(bpy)3Cl2·6H2O and secondary distilled water.
Phosphate buffer solutions (PBS) were prepared with disodium hydrogen phosphate, sodium
dihydrogen phosphate and secondary distilled water. Standard solutions of PMZ and DMPMZ were
prepared with their standard substance and secondary distilled water. All solutions used in the
experiments were filtered through a 0.22 μm cellulose acetate membrane.

2.3. Apparatus and ECL detection conditions

        CE-ECLwas performed on a MPI - B multi-parameter chemiluminescence analysis test system
(Xi’an Remex analytical instruments Co., Ltd., Xi’an, China). Cyclic voltammetry and potentiostatic
method were carried out in a three electrodes system with a platinum working electrode of 500 μm in
diameter, an Ag/AgCl reference electrode of 300 μm in diameter and a platinum wire auxiliary
electrode of 1 mm in diameter. Uncoated capillary (25μm x 40 cm, Yongnian Optical Fiber Factory,
Hebei, China) was rinsed respectively with 0.1 mol/L NaOH solution for 20 min, secondary distilled
water for 10 min and running buffer for 15 min before use.
        ECL conditions in detection cell: Detection potential is 1.2V (vs. Ag/AgCl). Concentration of
Ru(bpy)32+ is 6 mmol/L. Concentration of PBS is 40 mmol/L. The pH of PBS is 6.5.

3. RESULTS AND DISCUSSION

3.1. Selection of capillary electrophoresis parameters by single factor experiments

3.1.1 The pH of separation PBS

         The acidity of separation PBS is an important condition affecting the separation effect. In the
literature work of CE with PBS medium, the application range of pH value is mostly between 4-8 [4-
12,22-24,28-32]. Therefore, we mainly study the influence of pH in this range on the resolution. When
the pH of the PBS changes from 4.5 to 6.5, the resolutions of PMZ and DMPMZ under 20 mmol/L
PBS and separation voltage 14 kV are shown in Figure 2. With the increase of the pH of separation
PBS, the resolution shows a trend of "first increase and then decrease", and reaches the maximum at
pH = 5.5. So, we chose 5.5 as the pH value of separation buffer solution.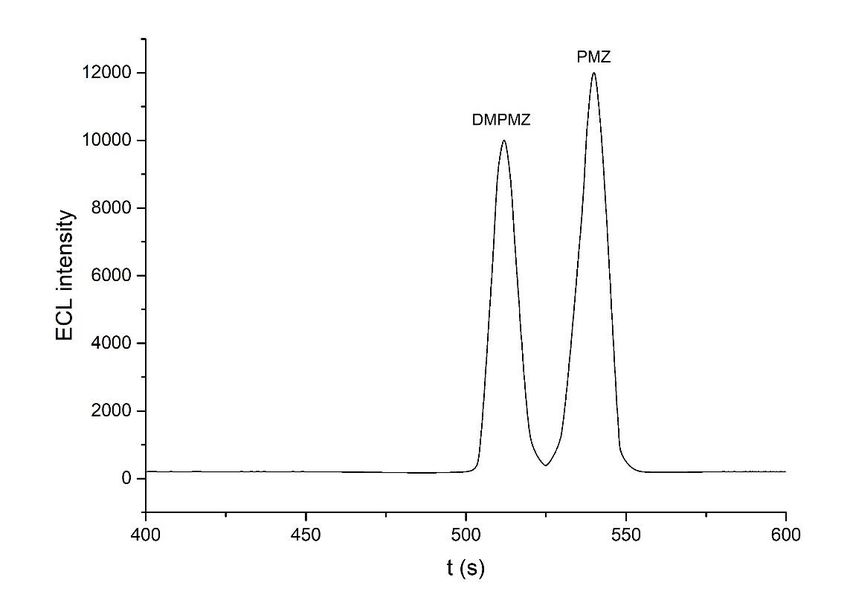
Int. J. Electrochem. Sci., 16 (2021) Article ID: 210333                                                  4

          Figure 2. Effects of pH of separation PBS on the resolution of PMZ and DMPMZ.

3.1.2 Concentration of separation PBS

        The ionic strength of separation PBS is another important condition affecting the separation
effect. PBS with different pH values are prepared by different proportions of Na2HPO4 and NaH2PO4.
When the concentration of the two increased in proportion, the pH value remained unchanged, but the
buffer capacity increased, and the total ionic strength of the solution also increased. In this experiment,
the effect of ionic strength on resolution was investigated by changing concentration of PBS under pH
of PBS 5.5 and separation voltage 14 kV. The results are shown in Figure 3. With the increase
concentration of PBS, the ionic strength increased. When the concentration of PBS is 20 mmol/L, the
resolution of PMZ and DMPMZ is relatively large. The ionic strength can also be increased by simply
adding strong electrolyte into PBS. We used to increase ionic strength by adding NaCl to PBS [40].
Other research groups also use Na2SO4, KCl or NH4Cl to change the ionic strength [8-19, 23, 27, 32,
35]. However, the addition of strong electrolytes can sometimes lead to other unexpected problems.

3.1.3 Separation voltage

        The separation voltage affects the migration time of components, and then changes the
resolution of components. In the literature work, the application range of separation voltage is very
wide. However, it rarely exceeds 20 kV [27], and most of them are between 10-20 kV [5-25,28-34]. In
this experiment, the separation voltages from 12 kV to 16 kV are investigated under 20 mmol/L PBS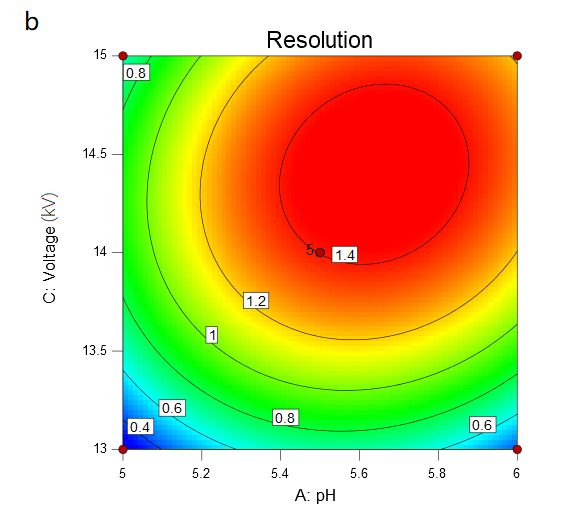
Int. J. Electrochem. Sci., 16 (2021) Article ID: 210333                                              5

(pH 5.5). The results are shown in Figure 4. As you can see, 14 kV is the best separation voltage.

          Figure 3. Concentration of separation PBS on the resolution of PMZ and DMPMZ.

            Figure 4. Effects of separation voltage on the resolution of PMZ and DMPMZ.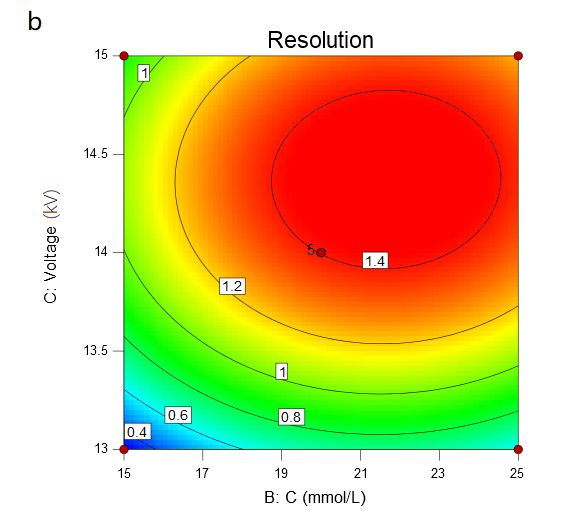
Int. J. Electrochem. Sci., 16 (2021) Article ID: 210333                                               6

       Therefore, the CE parameters selected by single factor experiments are 20 mmol/L PBS (pH
5.5) and separation voltage 14 kV.

3.2. Optimization of capillary electrophoresis parameters by RSM

3.2.1 Box-Behnken test and experimental results

        The pH of PBS, concentration of PBS and separation voltage were used as research factors.
The resolution was used as the response value. According to the results of single factor experiments,
three factors and three levels (see table 1) were used to carry out the Box-Behnken test design [42-45].

Table 1. Factors and levels of the Box-Behnken test design.

        Levels\Factors       pH of PBS       Concentration of PBS           Separation voltage
                                                 (mmoL/L)                         (kV)
               -1               5.0                   15                            13
               0                5.5                   20                            14
               1                6.0                   25                            15

      The results of 17 response surface design trials (12 edge points plus 5 center points in Box-
Behnken test design) are shown in Table 2.

Table 2. Response surface design and experimental results.

        Number      pH of PBS     Concentration of PBS       Separation voltage    Resolution
                                       (mmol/L)                     (V)
           1            6                  15                        14               0.75
           2            5                  20                        13               0.30
           3            5                  25                        14               0.70
           4           5.5                 25                        15               1.20
           5            6                  20                        13               0.36
           6            6                  20                        15               1.14
           7           5.5                 20                        14               1.41
           8           5.5                 15                        15               0.90
           9           5.5                 15                        13               0.32
          10            5                  20                        15               0.70
          11            5                  15                        14               0.46
          12           5.5                 20                        14               1.39
          13           5.5                 20                        14               1.42
          14           5.5                 20                        14               1.39
          15           5.5                 20                        14               1.40
          16            6                  25                        14               1.23
          17           5.5                 25                        13               0.57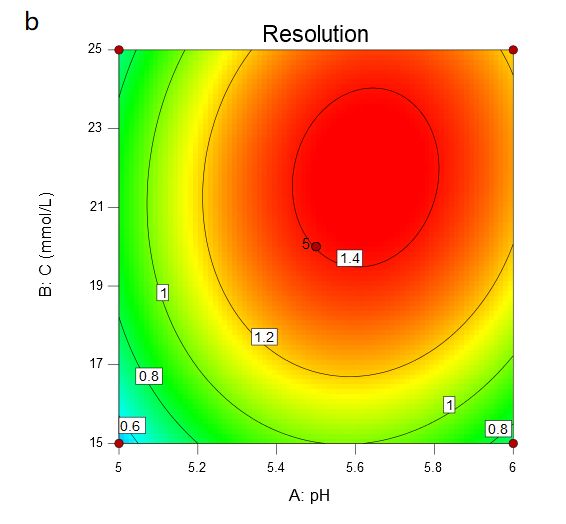
Int. J. Electrochem. Sci., 16 (2021) Article ID: 210333 7
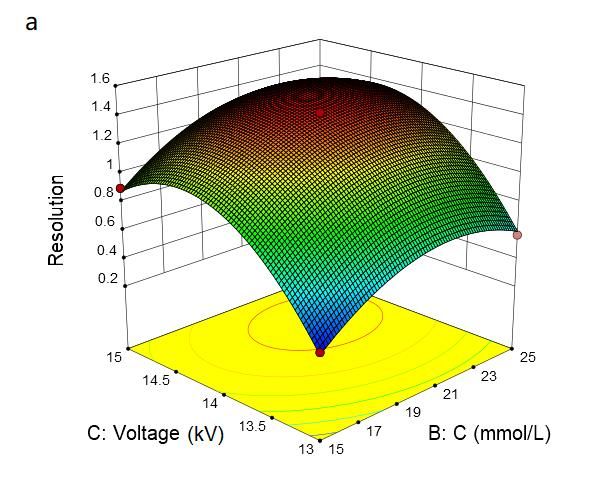
3.2.2 Interaction among factors
The 3D surfaces and contours are plotted by Design Expert software, as shown in figure 5-
figure 7. Each figure represents the influence of the interaction of two independent variables on
resolution.
Figure 5. Effect of interaction of pH and concentration of PBS on resolutions.
Figure 5 is 3D surface (a) and contour (b) of the effects of the interaction of pH of PBS and
concentration of PBS on resolutions. With the increase of pH of PBS and concentration of PBS on
resolutions, the resolution increases. When the pH of PBS reaches 5.653 and the concentration of PBS
reaches 21.846 mmol/L, the resolution reaches its maximum. When the pH of PBS and concentration
of PBS continue to increase, the resolution begins to decrease.
Figure 6. Effect of interaction of pH of PBS and separation voltage on resolutions.Int. J. Electrochem. Sci., 16 (2021) Article ID: 210333 8
Figure 7. Effect of interaction of concentration of PBS and separation voltage on resolutions.
Figure 6 is 3D surface (a) and contour (b) of the effects of the interaction of pH of PBS and
separation voltage on resolutions. With the increase of pH of PBS and separation voltage, the
resolution increases. When the pH of PBS reaches 5.653 and the separation voltage reaches 14.408 kV,
the resolution reaches its maximum. When the pH of PBS and separation voltage continue to increase,
the resolution begins to decrease.
Figure 7 is 3D surface (a) and contour (b) of the effects of the interaction of concentration of
PBS and separation voltage on resolutions. With the increase of concentration of PBS and separation
voltage, the resolution increases. When the concentration of PBS reaches 21.846 mmol/L and the
separation voltage reaches 14.408 kV, the resolution reaches its maximum. When the concentration of
PBS and separation voltage continue to increase, the resolution begins to decrease.
Based on the above experimental results, it can be found that the optimum values of pH of PBS,
concentration of PBS and separation voltage were 5.653, 21.846 mmol/L and 14.408 kV, respectively,
when the maximum resolution is obtained. It is almost impossible to obtain the optimal CE conditions
through single factor experiments, because the number of experiments needed is very large. According
to the model, the maximum value of resolution was 1.517. This is 8.4% higher than that selected from
single factor experiments. The key point is that the resolution is greater than 1.5, which can ensure the
two components completely separated. In the literature, signal size, peak area or luminous intensity are
usually used as response values to optimize multi parameter conditions [41-46]. There is no
optimization work with resolution as response value. The resolution is the ratio of the difference of
retention time between two adjacent components and the average width of their peak base. It can only
be obtained by calculation using the measured data of electrophoretogram, which is really
troublesome.Int. J. Electrochem. Sci., 16 (2021) Article ID: 210333 9
3.3Separation performance
The experiment was carried out under the separation conditions selected by single factor
experiments, i.e. 20 mmol/L PBS (pH 5.5) and separation voltage14 kV. The separation of PMZ and
DMPMZ is shown in Figure 8. At this time, the resolution is less than 1.5.
Figure 8. The separation of PMZ and DMPMZ under single factor experimental conditions.
Figure 9. The separation of PMZ and DMPMZ under the separation conditions optimized by RSM.Int. J. Electrochem. Sci., 16 (2021) Article ID: 210333 10
The experiment was carried out under the separation conditions optimized by RSM, i.e. 21.846
mmol/L PBS (pH 5.653) and separation voltage 14.408 kV. The separation of PMZ and DMPMZ is
shown in Figure 9. In this figure, the resolution is greater than 1.5.
The improvement of separation effect after optimization is obvious. As you can see, PMZ and
DMPMZ can be separated well in CE process without any additives under the separation conditions
optimized by RSM.
4. CONCLUSION
On the basis of single factor experimental conditions, the interactions of different factors on
resolution were investigated by response surface methodology, which can improve the resolution of
PMZ and DMPMZ. Finally, a rapid and simple CE-ECL method for separation and analysis PMZ and
its metabolites was established. PMZ and DMPMZ can be separated well in CE process without any
additives.
ACKNOWLEDGEMENTS
This work was supported by Beijing Natural Science Foundation of China (Grant No.2152013).
References
1. S.J. Sun, Y.F. Wei, H. Wang, Y.P. Cao and B.Y. Deng, Talanta, 179 (2018) 213-220.
2. R.N. Wei, Z.Y. Chen and J.Z. Geng, Mod. Food Sci. Tech., 33 (2017) 257-263.
3. S.J. Sun, Y.F. Wei, Y.P. Cao and B.Y. Deng, J. Chromatogr. B,1055-1056 (2017) 15-19.
4. Y.F. Wei, H. Wang, S.J. Sun, L.F. Tang, Y.P. Cao and B.Y. Deng, Biosens. Bioelectron., 86 (2016)
714-719.
5. Y. Dong and E.B. Liu, Asian J. Chem., 28 (2016) 1239-1243.
6. S.J. Sun, Y.F. Wei, C.J. Long and B.Y. Deng, J. Chromatogr. B, 1006 (2015) 146-150.
7. M. Zuo, J.Y. Gao, X.Q. Zhang, Y. Cui, Z.M. Fan and M. Ding, J. Sep. Sci., 38 (2015) 2332-2339.
8. H.B. Duan, J.T. Cao, H. Wang and Y.M. Liu, Anal. Methods, 7 (2015) 3946-3951.
9. H.J. Zeng, R. Yang, Y. Zhang, J.J. Li and L.B. Qu, Luminescence, 30 (2015) 124-130.
10. L. Xu, L. Li, J. Huang and T. You, Talanta, 118 (2014) 1-6.
11. J.B. Pan, Z.G. Chen, M.C. Yao, X.C. Li, Y.B. Li, D.P. Sun and Y.Y. Yu, Luminescence, 29 (2014)
427-432.
12. D.X. Kong, Q.L. Li, L.C. Chen, Y.W. Chi and G.N. Chen, J. Sep. Sci., 37 (2014) 1199-1205.
13. Y.C. Wang, G.M. Zhu, X. Li and Z.B. Hao, J. Sep. Sci., 37 (2014) 3007-3012.
14. S.J. Sun, C.J. Long, C.Y. Tao, S. Meng and B.Y. Deng, Anal. Chim. Acta, 851 (2014) 37-42.
15. W.P. Guo, Z.B. Rong, Y.H. Li, Y.S. Fung, G.Q. Gao and Z.M. Cai, Electrophoresis, 34 (2013)
2962-2969.
16. Y.M. Liu, J. Li, Y. Yang and J.J. Du, Luminescence, 28 (2013) 673-678.
17. X.F. Li, Y.Y. Yang and K.W. Zhou, Chinese J. Chromatogr., 30 (2012) 938-942.
18. Y.M. Liu, Y. Yang, J. Li and J.J. Du, Anal. Methods, 4 (2012) 2562-2568.
19. Y. Bao, F. Yang and X.R. Yang, Electroanalysis, 24 (2012) 1597-1603.
20. B.Y. Deng,Y. Liu, H.H. Yin, X. Ning, H. Lu, L. Ye and Q.X. Xu, Talanta, 91 (2012) 128-133.
21. D.R. Zhu, X. Li, J.Y. Sun and T.Y. You, Talanta, 88 (2012) 265-271.
22. C.J. Long, B.Y. Deng, S.J. Sun and S.Meng, Food Addit. Contam., 34 (2017), 24-31.Int. J. Electrochem. Sci., 16 (2021) Article ID: 210333 11
23. G.M. Zhu, S.H. Long, H. Sun, W. Luo, X. Li and Z.B. Hao, J. Chromatogr. B, 941 (2013) 62-68.
24. B.Y. Deng, Q.X. Xu, H. Lu, L. Ye and Y.Z. Wan, Food Chem., 134 (2012) 2350-2354.
25. D.D. Wang, F.L. Li, M. Su and H.W. Sun, J. Appl. Pharm. Sci., 8 (2018) 7-14.
26. H. Guo, X.L. Wu, A.L. Wang, X.W. Luo, Y.J. Ma and M. Zhou, New J. Chem., 39 (2015) 8922-
8927.
27. Q.W. Zhou, D. Wu, Q. Meng, H.B. Tang, Z.R. Wei, Y. Kuang, J.Y. Yin and J.J. Chen, Anal. Sci., 29
(2013) 757-760.
28. Q. Xiang, Y. Gao, B.Y. Han, J. Li, Y.H. Xu and J.Y. Yin, Luminescence, 28 (2013) 50-55.
29. M. Zhou, Y.J. Li, C.Y. Liu, Y.J. Ma, J. Mi and S.L. Wang, Electrophoresis, 33 (2012) 2577-2583.
30. D. An, Z.Q. Chen, J.C. Zheng, S.Y. Chen, L. Wang, Z.Y. Huang and L.Weng, Food Chem., 168
(2015) 1-6.
31. M. Su, M. Wei, Z.X. Zhou and S.Q. Liu, Biomed. Chromatogr., 27 (2013) 946-952.
32. Y. Ji, Y.X. Ma and X.M. Sun, Anal. Methods, 5 (2013) 1542-1547.
33. H. Yu, L. Xu and T.Y. You, Luminescence, 28 (2013) 217-221.
34. Y.F. Hu, W. Xu, J.P. Li and L.J. Li, Luminescence, 27 (2012) 63-68.
35. Y.Y. Hu and X.P. Wei, Curr. Anal. Chem., 14 (2018) 504- 511.
36. Y.F. Hu, J. Chromatogr. B, 986-987 (2015) 143-148.
37. C. Cai, H.Y. Cheng and Y.C. Wang, Anal. Methods, 6 (2014) 2767-2773.
38. K.L. Lynch, B.J. Shapiro, D. Coffa, S.P. Novak and A.H. Kral, Drug Alcohol Depend., 150 (2015)
92-97.
39. F.X. Yang, K.W. Zhou, Y. Lu, H. Yoshida and H.W. Yang, Int. J. Electrochem. Sci., 14 (2019) 9159-
9169.
40. W.J. Zhang, F.X. Yang, Z.K. Peng, C.J. Hou and K.W. Zhou, Int. J. Electrochem. Sci., 15 (2020)
10184-10196.
41. S. Polat and P. Sayan, Adv. Powder Technol., 30 (2019) 2396–2407.
42. M. Danish, S.M. Yahya and B.B. Saha, J. Therm. Anal. Calorim., 139 (2020) 3051-3063.
43. S. Popovic, M. Karadzic and J. Cakl, J. Cleaner Prod., 231 (2019) 320-330.
44. R. Bhateria and R. Dhaka, Ecol. Eng., 135 (2019) 127–138.
45. S.P. Kumar and S. Elangovan, Trans. Can. Soc. Mech. Eng., 44 (2020) 148-160.
46. M. Lei, Q. Zhang, D. Min and S. Wang, J. Biobased Mater. Bioenergy, 14 (2020) 280-286.
© 2021 The Authors. Published by ESG (www.electrochemsci.org). This article is an open access
article distributed under the terms and conditions of the Creative Commons Attribution license
(http://creativecommons.org/licenses/by/4.0/).You can also read