Interpretation Of Subsurface Structure To Determine The Geothermal System Based On Gravitation Data From Mount Pandan, East Java Indonesia - Quest ...
←
→
Page content transcription
If your browser does not render page correctly, please read the page content below
Quest Journals
 Journal of Research in Environmental and Earth Science
 Volume 5~ Issue 1 (2019) pp: 01-09
 ISSN(Online) : 2348-2532
 www.questjournals.org

 Research Paper

     Interpretation Of Subsurface Structure To Determine The
    Geothermal System Based On Gravitation Data From Mount
                    Pandan, East Java Indonesia
     Irma Risvana Dewi1, Sukir Maryanto2*, Wiyono3, Susilo Tugas Pinilihin4
                           1. Graduate program of physics, University of Brawijaya
                             2. Brawijaya Vulcano and Geothermal research center
             3. Departemen Of Physics, Faculty Of Mathematic and Science, Brawijaya University
                4. The Ministry Of Energy and Mineral Resource (ESDM), East Java, Indonesia
                                  *corresponding author : Irma Risvana Dewi

ABSTRACT: Mount Pandan is a non-active volcano located in East Java, Indonesia, which has geothermal
potential approimately 40%. That supported by hot spring and gas which surrounded mount Pandan. However,
the subsurface structure of mount Pandan has not been reported. This research was focused on the identification
of subsurface structure to determine the correlation between subsurface structure and manifestation existed in
mount Pandan area. Inversion modeling and forward modeling method ware used to interpret the subsurface
structure of the mount Pandan. From the data analysis, the residual Bouguer anomaly o mount Pandan shows
value from -6.4 mgal to 11.9 mgal. Inversion modeling was using two cross-sections i.e. X-X’ and Y-Y’. The
inversion modeling showed the top subsurface was dominated by layers density from 1,7 g/cm3 to 2.18 g/cm3.
While the lower layer is 2 g/cm3 to 4 g/cm3. Inversion modeling indicated the hot springs of Mount Pandan were
from the different reservoir. Forward modeling on a cross-section indicates the layers of Mount Pandan
consisted by multy-layers of rock and secondary structure which formed by tectonic activities and volcanic
eruptions in ancient time. In addition, the forward modeling results interpreted that volcanic breccia rocks with a
density value of 2.9 g/cm3 suspected as hydrothermal reservoir rocks.
KEYWORD: Gravity Method, Geothermal, Mount Pandan Bojonegoro, Subsurface, Secondary Structure,
Bouguer Anomaly.

Received 11 January, 2018; Accepted 26 january, 2019 © The author(s) 2019.
Published with open access at www.questjournals.org

                                            I. INTRODUCSION
          Worldwide consumption of energy especially electricity is predicted to grow continuously.
Nowadays,energy base on fossil fuels is still dominate. However, fossil fuels resources estimated will be
exhausted in the next 70 years [1]. It is clear that in spite of improvements in the recovery of traditional fossil
fuels, alternative new energy resources are needed. Geothermal energy is one of the energy resources that can
overcome dependence on fossil fuels.
          Indonesia has geothermal potential to approximately 40% of the total world’s potential which spread in
256 zone,[2]around 203 of the geothermal potential are spread in active volcano, and 53 of those in non-active
volcanic. The geothermal prospects in Indonesia are dominated in Sumatra and java with 84 and 76 region
prospectively one of the geothermal prospect in java is Mount Pandan. Mount Pandan is located in the border of
Bojonegoro and Madiun Regency, East Java Indonesia. Pandan is a non-active volcano with 890 meter altitude.
It emerged on the early Pleistocene Quaternary[3]According to ministry of energy and mineral resurces,
geothermal energy potential of mount pandan was estimated to reach 60 MWe[4], its supported by hot springs
spot in several locations including the areas of Nangka Hill, Tengaring,Puru Hill and Selo Gajah with surface
temperatures more than 35oC[5].Geothermal manifestations in the study area are related to the plutonic rocks
that associated with magmatisem activity to produce young volcanic rocks[6]

*Corresponding Author: Irma Risvana Dewi                                                                 1 | Page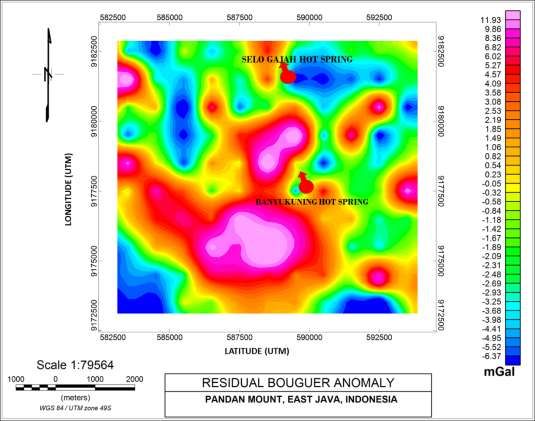
Interpretation Of Subsurface Structure To Determine The Geothermal System Based On Gravitation

           Figur 1.Geological map on studi area (modification from Pringgoprawiro and Sukido)[7]

         The geophysical research focused on the northern slopes of Mount Pandan using geological mapping
has been done by Thoha in 2014. The study was supported by analysis of petrographic and geological structures
[3]. However, geothermal knowledge in the Mount Pandan region has not been reported and information of
Mount Pandan are unexplored.Therefore, to the better understanding of the geological subsurface structure of
the Mount Pandan region, further research is needed.
         This research was focused on identification of geothermal potential of Mount Pandan East Java
Indonesia(figure 2).The objective of this experiment wasto identify the relation between subsurface structure
and manifestation existed in Mount Pandan. The results expected to provide an overview of subsurface
structures and geothermal potential conditions of Mount Pandan whichcan be utilized to overcome the future
energy crisis.

                                            II. DATA SOURCE
          Secondary data years of 2012 obtained from ministry of energy and mineral resources. Total of the
station is 105 points with 1 km spacing and the area of measurement in this study is 90 km 2 (figure 2). The
research includes: measurement time, topographic data, relative gravity reading value, gravitation correction
results and Bouguer anomaly results.
          Gravity survey[8]was used in this experiment. This method was chosen because this method is very
sensitive to vertical. Gravity methods have been carried out for geothermal study [9]and identify fault structure
[10]. Gravity method can be used for geothermal studies since it is able to explain subsurface structures and
geothermal fluid discharge zones in the surface[8].

*Corresponding Author: Irma Risvana Dewi                                                               2 | Page
Interpretation Of Subsurface Structure To Determine The Geothermal System Based On Gravitation

     Figure 2. The measurement point of the research area of mt. Pandan Bojonegoro, East Java Indonesia

                                           III. DATA PROCESSING
         The data was processed to complete obtain Bouguer anomaly maps and subsurface model by the
following steps. First gravity data (tidal correction, drift correction, latitude correction, free air correction, field
correction, and Bouguer correction) was corrected to reduce noise data. Correction data used Telford equation
[11]. Then the complete Bouguer anomaly data pattern converted into a flat topography by Dampney equivalent
point period method [12][13]. Next step was separation of Bouguer anomaly contours into regional anomaly and
residual anomaly used upward continuation methods [9]. Finally, interpretation which consisted of qualitative
and quantitative interpretations. The qualitative interpretation was based on the pattern reading of the complete
bouguer anomaly contour map, regional anomaly contour map, and residual anomaly contour maps[14]. While,
the quantitative interpretations were shown in 3D inversion and 2D forward modeling data. Quantitative
interpretation was carried out by cross section model of the area which expected as the geothermal reservoir
location from the contour of the gravity residual anomaly. The main parameter was observed by the data curve
shape. The parameters were converted to match the gravity anomaly curve and modeling curve.

                                 IV. COMPLITE BOUGUER ANOMALY
         Complete Bouguer Anomaly (CBA) can be defined as a total anomaly including regional anomalies
and residual anomalies. CBA in the Mount Pandan (figure 3)shows a different value Grom 58.90 mgal to 150.45
mgal. The difference value might be caused by a density variation of the rocks in the subsurface rock and under
the subsurface rock. the wide range of density rock is primarily due to variation in porosity. the nature of the
pore fluids also affects the bulk density. the rock density is also influenced by age, previous history and depth of
burial. Obviously, a porous rock will be compacted when buried. in general, density increases with depth and
time[11]. The map Bouguer anomaly values were divided into three groups which are high anomaly (150.45-
100.89 mgal) medium anomaly (98.82-80.57 mgal), and low anomaly (79.46-58.90mgal). High anomalies are
indicated by pink to dark-orange color, medium anomalies by dark- yellow to green, and low anomalies were
shown in light green to dark-blue. Bouguer anomaly in the study area dominated by the high anomaly. High
anomaly covered study area from the central to eastern part of the map which is close to Selo Gajah hot spring
and Banyukuning hot spring. The highest anomaly is shown in the northeast part of Banyukuning hot spring
indicated by pink color. While medium anomalies were shown in the western part of Selo Gajah hot spring and
*Corresponding Author: Irma Risvana Dewi                                                                      3 | Page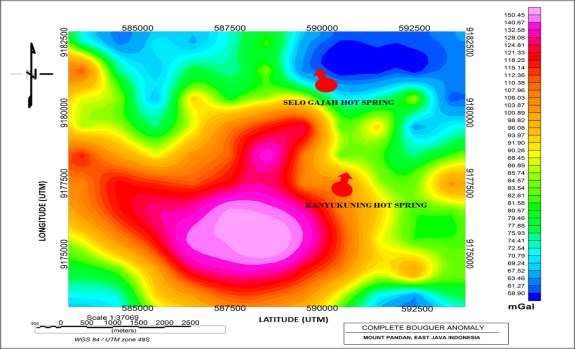
Interpretation Of Subsurface Structure To Determine The Geothermal System Based On Gravitation
southern part of Banyukuning hot spring. Low anomaly mostly accumulates in the southwest part of the contour
which closes to Selogajah hot spring
Figure 3. Complete Bouguer Anomaly Map on mount Pandan
4.1 Regional And Residual Anomaly
Figure 4. Regional Bouguer anomaly map onMount Pandan, East Java, Indonesia
From Separation of Bouguer anomalies, regional anomalies were obtained (figure 4). Regional
anomalies in the Mount Pandan area have values range from 62.27 mgal to 139.47 mgal. Regional anomalies
consist of high anomalies which cover from the southern to the northwest part of the study area. Regional
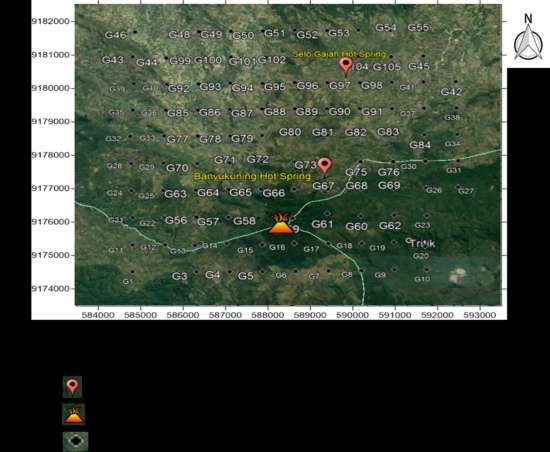
anomalies suspected caused by extensive geological conditions in the deep regions. In contrast residual
anomalies (figure 5) indicated shallow structures of topography and explained the distribution specific structures
*Corresponding Author: Irma Risvana Dewi 4 | Page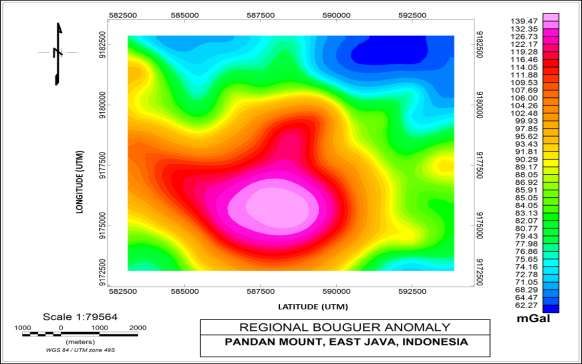
Interpretation Of Subsurface Structure To Determine The Geothermal System Based On Gravitation

which closer to the surface. In this study, the residual anomalies of mount pandan shown range values from 1.06
mgal to 11.93 mgal. A high anomalies value suspected due to igneous rock and the result of eruption from
Pandan the estimation of this rock type is based on the geological map, where the mountain pandan region is
dominated by volcanic breccia layers and in the geological model incision there is a layer with the Qia code
which is an intrusive rock type[15]. Medium and low Residual anomalies (-6.37 mgal to 0.82 mgal) might cause
by hydrothermal activity under the surface of mount pandan this is because the hydrothermal activity creates a
less compact rock layer [8].

                  Figure 5. Residual Bouguer anomaly onMount Pandan, East Java Indonesia

                                          V. INVERSI MODEL
          Inversion modeling is base from residual of gravity anomaly. This modeling performs by making
incisions according to figure 6. The first incision is laying on X-X’ line in the east-west direction. The second
incision is laying on Y-Y’ in the north-south direction.Inversion modeling (X-X cross-section) represent east-
west orientation (Figure 7). The high density of rock subsurface in Pandan mountain belongs to intrusive rock
type indicated the existence of secondary structure in the subsurface, the Secondary structure might be weak
zone as the path of intrusive rock and hot spring to coming out to the surface. The secondary structure located
in between high-density values (red to orange) and low-density values (light blue to dark blue).The low-density
value on the subsurface suspected as hydrothermal reservoir since it carries hot fluids. The hot springs
manifestation on the subsurface caused by displacement of the hot fluid to the reservoir and comes out through
fracture cracks. While, the lowest density on the surface might cause by manifestation from hot soil

*Corresponding Author: Irma Risvana Dewi                                                               5 | Page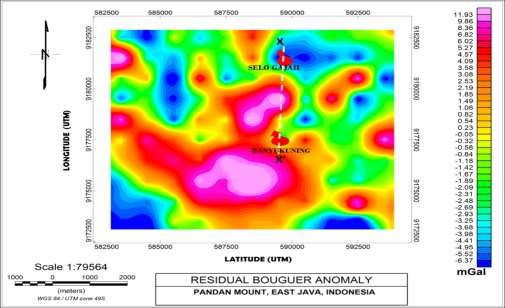
Interpretation Of Subsurface Structure To Determine The Geothermal System Based On Gravitation

             Figure 6. Model of incision of inversion modeling method gravity on Mount Pandan.

  Figure 7. The hydrothermal system of Indonesia's eastern Java mountain pandan in the X-X’ cross-section

        The Cross-section Y-Y' inversion model oriented-north-south (figure 8) ware carried out between the
Selo Gajah and Banyukuning manifestations. Base on the Y-Y' cross-section interpretation, the high density
which breaks through the surface was indicated the secondary fault which causing the manifestation pathway in
Selo Gajah and Banyukuning. Based on figure 8, the fluid flow that occurs in the SeloGajah manifestation
complex might an up-flow stream down type. The manifestations of the Banyukuning hot springs ware coming
out from rocks with lowest density values in the middle subsurface. The existed of the manifestations indicated

*Corresponding Author: Irma Risvana Dewi                                                             6 | Page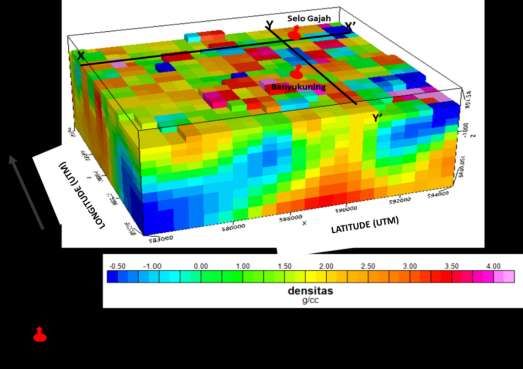
Interpretation Of Subsurface Structure To Determine The Geothermal System Based On Gravitation

the geological structure under the manifestation. Geological structure in Pandan might heterogeneous
sedimentary rocks which has permeable nature.

                  Figure 8. Hydrothermal System mount pandan East Java Indonesia in the YY ' cross-section

                                      VII. FORWARD MODELING
         Incisions were made on the residual Bouguer anomaly map based on hot spring manifestation points
(figure 9), to determine the subsurface structure and interpreted the relationship between the subsurface
structure and the manifestations on the surface

                          Figure 9. Incision on residual anomaly as modeling data

*Corresponding Author: Irma Risvana Dewi                                                         7 | Page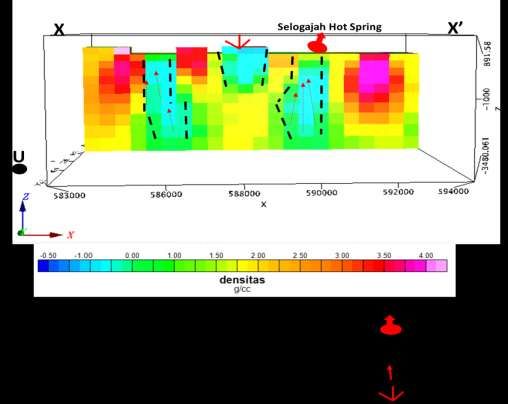
Interpretation Of Subsurface Structure To Determine The Geothermal System Based On Gravitation

  Figure 10. The results of the modeling based on the residual anomaly map obtained from the subsurface rock
                                                 arrangement

         The results of theresidual anomaly modeling (Figure 10) shown that Mount Pandan have a density
range from 1.7 to 3.1 g/cm3on the position of 1500 metersdepth from the surface. The first layer with pink might
be the top soil layer, the density of the layer was 1.7 g/cm3with 200 meters depth from the surface. That might
be sedimentary rock type from the volcanic flow of mountain Pandan.The second layer shown in the green color
with density value of 2.4 g/cm3. It was in 200-950 meters deep from the subsurface (750 meters thick) suspected
as the igneous rock. The third layer with a density value of 3.1 g/cm3 was found at a depth of 950 meters, it
could be fathomed metamorphic rock type. The deepest layer in this study (300-1500 m) shown in dark red
interpreted that volcanic breccia rocks with a density value of 2.9 g/cm3 are assumed to be hydrothermal
reservoir rocks. Based on Pringgoprawiro (1983,1992) explains that the Mount Pandan formation consists of
andesite breccia and andesite intrusion from Mount Pandan volcanic[15][7]. This study was indicated that
manifestations of Selo Gajah and Banyukuning was from different hydrothermal reservoirs (Figure 10).
However, the heat source in the geothermal system of mount Pandan could not be identified and need further
study. For further research, we suggest conducting research with other geophysical methods such as
Magnetotelluric (MT) or microseismic and also need to be carried out with supporting methods such as
geochemical methods, geological methods, and landsurface temperature distribution.

                                         VI.       CONCLUSION
Gravity method was used to identify the substructure and manifestation of mount Pandan. This study shows a
high anomaly in the middle to the west of mountain pandan and a low anomaly in the northeast part. The
presence of intrusive rocks indicated the existence of secondary fault as the way of hot fluid go up to the
surface. The hydrothermal reservoir in selo Gajah shown the up flow pattern. This study also indicated the
Banyukuning's manifestations were derived from heterogeneous sedimentary rocks which permeable. and the
results of 2D forward modeling are interpreted that volcanic breccia rocks with a density value of 2.9 g/cm3 are
assumed to be hydrothermal reservoir rocks.

                                                        REFERENCE
[1].   Setyaningsih W, “Potensi Lapangan Panasbumi Gedongsongo Sebagai Sumber Energi Alternatif Dan Penunjang Perekonomian
       Daerah,” Dosen Jur. Geogr. FIS - Unnes, vol. 8, no. 1, pp. 11–14, 2011.
[2].   S. Maryanto, “Geo Techno Park potential at Arjuno-Welirang Volcano hosted geothermal area, Batu, East Java, Indonesia (Multi
       geophysical approach),” AIP Conf. Proc., vol. 1908, 2017.
[3].   M. Thoha, P. Parman, B. Prastistho, D. F. Yudiantoro, I. P. Hati, and I. B. Jagranata, “Geology and Geothermal Manifestations of
       Mount Pandan , East Java,” no. June, pp. 1–13, 2014.
[4].   Direktorat Panas Bumi, Buku Panas Bumi. 2017.
[5].   A. P. Utama, A. Dwinanto, J. Situmorang, M. Hikmi, and R. Irsamukhti, “Green Field Geothermal Systems in Java, Indonesia,”
       ITB Geotherm. Work. 2012, 2012.
[6].   Dinas Energi dan Sumberdaya Mineral (ESDM) Jawa Timur, “Laporan Pendahuluan Pekerjaan: Survey Pendahuluan Geologi,

*Corresponding Author: Irma Risvana Dewi                                                                                   8 | Page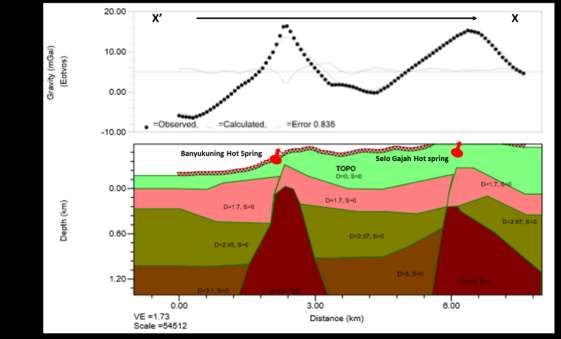
Interpretation Of Subsurface Structure To Determine The Geothermal System Based On Gravitation
          Gokimia, Geofisika, Gunung Pandan Kab. Nganjuk, Kab. Madiun, dan Kab. Bojonegoro) Provinsi Jawa Timur,Surabaya,”
          unpublished, 2012.
[7].      H.Pringgoprawiro dan Sukido, “Bojonegoro.” p. 1, 1992.
[8].      S. Maryanto, S. D. Wuryani, A. K. Nugraha, A. Prayogo, S. L. Kunrat, and A. Basuki, “Temporal changes of complete bougeuer
          anomalies at Bromo Volcano, East Java, Indonesia,” Int. J. Appl. Eng. Res., vol. 12, no. 21, pp. 10867–10873, 2017.
[9].      R. Raehanayati, A. Rachmansyah, and S. Maryanto, “Studi Potensi Energi Geothermal Blawan- Ijen, Jawa Timur Berdasarkan
          Metode Gravity,” J. Neutrino, no. July 2017, p. 31, 2013.
[10].     A. P. Azhari, S. Maryanto, and A. Rachmansyah, “Interpretation of Bouguer Anomaly To Determine Fault and Subsurface
          Structure At Blawan-Ijen Geothermal Area,” J. NeutrinoJurnal Fis. dan Apl., vol. 9, no. 1, p. 1, 2016.
[11].     W. M. Telford, L. P. Geldart, and R. E. Sheriff, “Chapter 2-Gravity Methods.pdf.” .
[12].     C. N. G. Dampney and O. City, “gz(x, y, 2) =,” vol. 34, no. 1, pp. 39–53, 1969.
[13].     B. Datar, “Kajian metode sumber ekivalen titik massa pada proses pengangkatan data gravitasi ke bidang datar,” vol. 8, no. 1, pp.
          7–11, 2005.
[14].     P. a Santos and J. a Rivas, “Gravity Surveys Contribution To Geothermal Exploration in El Salvador : the Cases of Berlín ,
          Ahuachapán and San Vicente Areas,” Short Course Surf. Explor. Geotherm. Resour., no. Figure 1, pp. 1–6, 2009.
[15].     P. H., “Biostatigrafi dan Paleogeografi Cekungan Jawa Timur Utara, suatu pendekatan baru,” unpublished, 1983.

        Irma Risvana Dewi" Interpretation Of Subsurface Structure To Determine The Geothermal
        System Based On Gravitation Data From Mount Pandan, East Java Indonesia" Quest Journals
        Journal of Research in Environmental and Earth Science, vol. 05, no. 01, 2019, pp. 01-09

*Corresponding Author: Irma Risvana Dewi                                                                                       9 | Page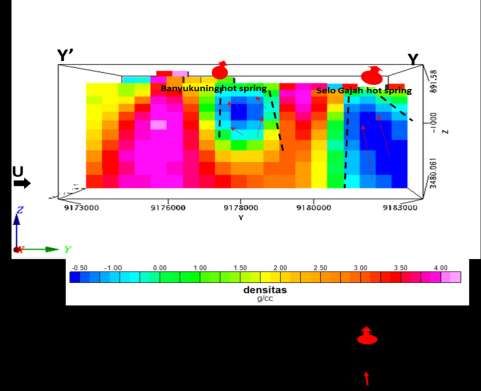
You can also read