ONE View How to generate and use reports with ONE View - www.maqao.org - Version 1.10
←
→
Page content transcription
If your browser does not render page correctly, please read the page content below
ONE View
How to generate and use reports with ONE View
Version 1.10

June 2021

               www.maqao.org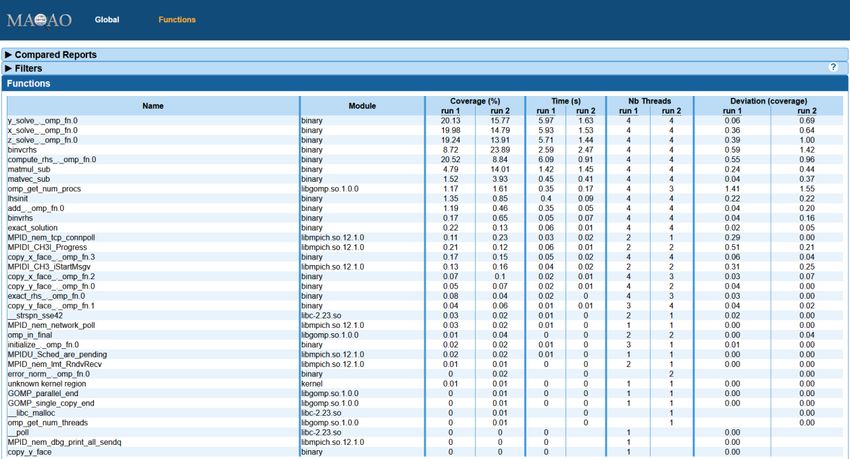
MAQAO Tutorial series: ONE-View
                                                                                                          1

1 Introduction
ONE View is the MAQAO module in charge of driving all other MAQAO modules in order to
produce reports aggregating results from all these tools. It automatizes the execution of other
MAQAO modules to generate reports in HTML pages or XLSX data sheets.

ONE View offers several built-in reports combining both static and dynamic approaches to
get an overview of the application performance. This document details reports ONE, which
use MAQAO modules LProf (a dynamic profiler) and CQA (a static code analyser).

2 Running ONE View
To generate a report using ONE View, the default command is:

 $ maqao oneview –create-report= –c= [-xp=] [-of=]
 [--with-scalability]

  Enable scalability analysis         Report to produce: one

                                                                  Report format:
  Name of the configuration file                                  - html (default)
  describing the experiment.                                      - xlsx
  Configuration file is described in next                         - text
  section                                                         - all (all existing formats)

  Name of the directory created by ONE-View. If it is not specified, the directory is called
  maqao_YYYY-MM-DD_hh-mm-ss. It is referred in this file as experiment directory.

It is also possible to provide the necessary parameters to ONE View from the command line.
It can be used when a small set of variables in the configuration file is needed. All existing
parameters for the configuration of the experiment are available in sections 3.2 and 3.3.

To list all options for ONE View:

 $ maqao oneview --help

The report ONE is the simpler and faster report. It combines a profiling of the application using LProf
module with CQA static analysis on loops and functions. The scalability analysis contains all data from
the report ONE and additional data generated using several profiling of the application with different
values for the number of processes and the number of threads.
MAQAO Tutorial series: ONE-View
2
The report ONE (and all other report levels) can be enhanced using one or more cumulative options
that could run additional analysis and add more data into reports. These options are:
--with-scalability (-WS): Run additional LPROF analysis and add several charts about
application scalability.
--with-POP: Generate several additional metrics that do not need additional runs.
More options will be added in future MAQAO versions.
3 Filling the Configuration File
3.1 Creating the configuration file
To generate a template of configuration file:
$ maqao oneview –create-config[=]
Name of the generated configuration file. If it is not specified, the configuration
file is called config.lua and it is created in the current directory.
The template contains all available fields and it is fully documented. This document details all
fields in next subsections. The configuration file uses the Lua syntax; in particular,
commented lines are prefixed with “--” (two dashes).
3.2 Main fields
- binary: Path to the binary of the application to analyse
- dataset: Path to a directory containing the application dataset. If filled, this directory is
copied or linked (depending on the value of the dataset_handler link) into the experiment
directory. If dataset_handler is set to “copy”, the experiment directory must not be created
in the dataset directory, and it is also advised to have the directory specified in dataset be as
small as possible.
- run_command: A string detailing how the application must be run. In this string, the binary is
referred as . This substring is automatically replaced by the correct binary name
when ONE View needs to run any version of the binary.
If the application does not need any parameter, the field has “” as value. If the
application needs two parameters, -a=5 and --b, the field has “ -a=5 --b” as value.
- run_directory: A string detailing where the binary should be run. Some applications must be
run from a specific directory, most of the time related to the dataset directory. This field is
used to specify this path. The substring “” can be used to represent the path to the
dataset directory located in the experiment directory and it is automatically substituted by
the real path by ONE View during runs.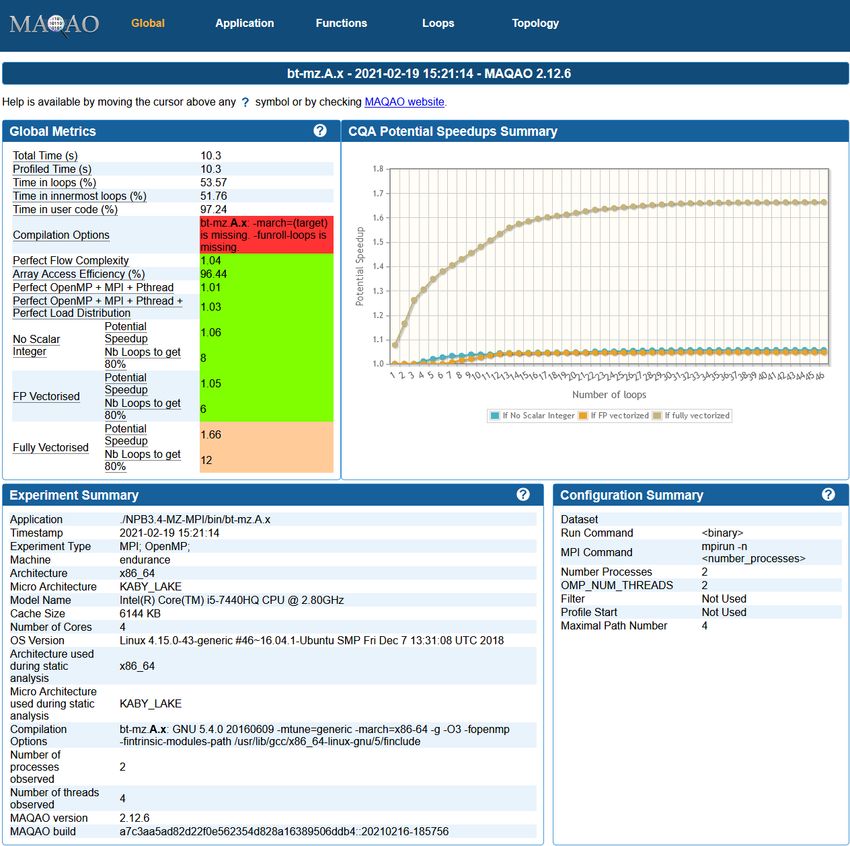
MAQAO Tutorial series: ONE-View
                                                                                                          3

    -   mpi_command: A string detailing the MPI command to use to run the application. If MPI
        should not be used, this string must be empty. If MPI is used, this field must contain the call
        to mpirun or mpiexec with all its parameters, except the application and its own parameters.

For example, if a binary needs the following command to be run:

 $ mpirun –n 4 ./my_app 250 –output=./log.out

The corresponding configuration file contains:

 binary = “./my_app”
 run_command = “ 250 –output=./log.out”
 mpi_command = “mpirun –n 4”

    -   omp_num_threads: A number specifying how many OpenMP threads must be used for the
        experiment. Default is 1. The environment variable OMP_NUM_THREADS will be set to this
        value before executing the application.
    -   number_processes: Number of processes to use to run the application. Default is 1. Can be
        referred as  in the batch_script or the mpi_command fields.
    -   batch_command: When the cluster uses a batch manager, this variable describes how to use
        it. If a script is needed, it must be referred as .
    -   batch_script: Path to a script used by a batch manager. The script must be adapted to ONE
        View by using the code  instead of the classic binary execution command.
        For example, a batch script adapted for ONE View for SLURM can be:

 #! /bin/bash

 #SBATCH SETTINGS
 #SBATCH –J myJob
 …

 #APPLICATION SETTINGS
 module load …
 export MY_VAR …

 #RUN THE APPLICATION
 # mpiexec –n 16 ./my_app

    -   multiruns_params: When scalability report is generated, describes all experiments to run. It
        is a table containing one entry per experiment, with following fields:
             o number_processes – Number of processes for the experiment. Default is 1. It
                 substitutes  in the batch_script or the mpi_command fields for
                 scalability runs.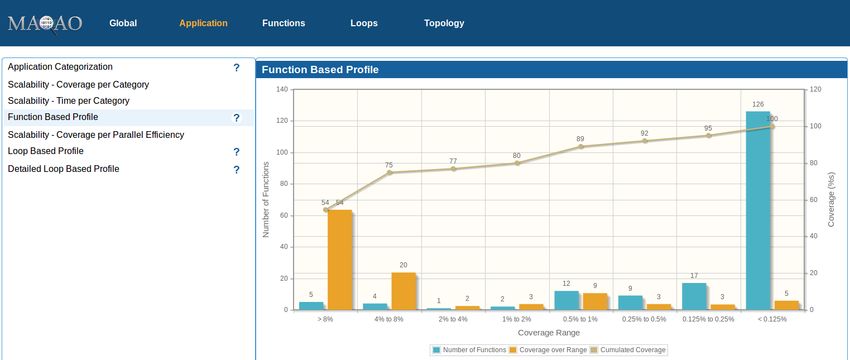
MAQAO Tutorial series: ONE-View
                                                                                                          4

          o   omp_num_threads – Number of threads for the experiment. Default is 1. It
              substitutes omp_num_threads for scalability runs.
          o   number_nodes –Number of nodes for the experiment. Default is 1. It substitutes
              number_nodes for scalability runs.
          o   number_tasks_nodes –Number of tasks per node for the experiment. Default is 1. It
              substitutes number_tasks_nodes for scalability runs.
          o   run_command –Command to use to run the binary for the experiment. Default is the
              value specified in the run_command configuration field.
          o   mpi_command –Command to use to run MPI for the experiment. Default is the value
              specified in the mpi_command configuration field.
          o   dataset – Path to the dataset to use for the experiment. Default is the value specified
              in the dataset configuration field.
          o   run_directory – Path to a directory where to run the binary for the experiment.
              Default is the value specified in the run_directory configuration field.
          o   script_variables – A set of user defined variables substituted on a batch script.
              Default is the value specified in the script_variables configuration field.
          o   name – Name used to identify the run in reports. For readability reasons, it is not
              always used and can be replaced by the string “run ”, with index the position
              in multiruns_params, starting at 2 (index 1 represents the run described by main
              parameters)

3.3 Secondary fields
  -   custom_categories: A table describing additional categories used in application
      categorization reports. When external_libraries is used, one additional category is created for
      each library. If custom_categories is filled, only categories specified are used. Each category
      is a subtable with following fields:
           o type - "library" (the custom category is a single library), "all-external-libraries"
               (shortcut to get one category for each entry in external-libraries as done by default),
               "library_group" to accumulate several libraries into a single category
           o value - "" when type is "library", nil when type is "all-external-
               libraries", {"lib1.so", "lib2.so",…} when type is "library_group"
           o name - Used only when type is "library_group", specify the name of the catergory
  -   experiment_name: An optional string copied into report main page that can be used to
      distinguish various reports.
  -   external_libraries: An optional table describing dynamic libraries to analyse in addition of the
      binary. By default, linked libraries are not analysed since most of them are system libraries
      that are not the target of optimisation efforts. This option allows to analyse the loops in the
      specified libraries, for instance when the application code is in such a library. Each entry in
      the table is a string with the name of a library to analyse.
  -   script_variables: A table of user defined variables that are substituted in the script defined in
      batch_script. Each entry has for key the variable name and for value a string or a number
      that will replaced the tag  in the script, as for ONE View built-in variables.
  -   scalability_reference: An optional string detailing which entry in the multiruns_params table
      must be used as reference when scalability metrics are computed. Available values are:
           o main – Main experiment defined in the configuration (default value)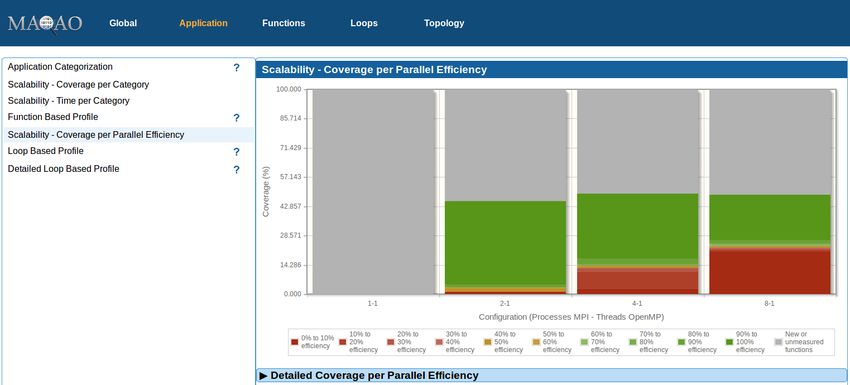
MAQAO Tutorial series: ONE-View
                                                                                                     5

        o lowest-time –The run with the shortest time
        o highest-time –The run with the highest time
        o lowest-threads –The run with the lowest number of threads
        o highest-threads –The run with the highest number of threads
        o lowest-efficiency –The run with the worst efficiency
        o highest-efficiency –The run with the better efficiency
        o  –The run at index  in the multiruns_params table
-   source_code_location: An optional string detailing where the source code is located. It is
    needed to localize the source code of your application if it is not at the location defined in
    debug data (which is set when compiling the application).
-   maximal_path_number: A number indicating the maximal number of paths in the control
    flow graph a loop can have. Loops with a greater number of paths will not be analysed.
-   number_nodes: Number of nodes to use to run the application on the cluster. Can be
    referred as  in the batch_script or the mpi_command fields.
-   number_tasks_nodes: Number of tasks per nodes to use to run the application. Can be
    referred as  in the batch_script or the mpi_command field.
-   environment_variables: An optional table containing environment variables to be set before
    running the application. Each entry has for key the environment variable name and for value
    the environment variable value.
-   dataset_handler: Specify how the dataset is handled in the experiment. Default value is link
    meaning that a link is created from the experiment directory to the dataset. copy can be
    used to copy the full dataset content into the experiment directory.
-   keep_binary_location: Specify if the binary must be copied and run from the experiment
    directory (true, default value), or if it must be run from its original location (false).
-   lprof_params: An optional string representing additional parameters passed to LPROF during
    the profiling step.
-   lprof_post_process_params: An optional table representing additional parameters passed to
    LPROF during formatting step.

The following fields are not used by report ONE and reserved for future releases:

-   filter
-   freqencies
-   profile_start
-   additional_hwc
-   bucket_thresold
-   decan_multi_variant
-   decan_all_variants
-   decan_params
-   vprof_params
-   is_sudo_available
-   excluded_areas
-   included_areas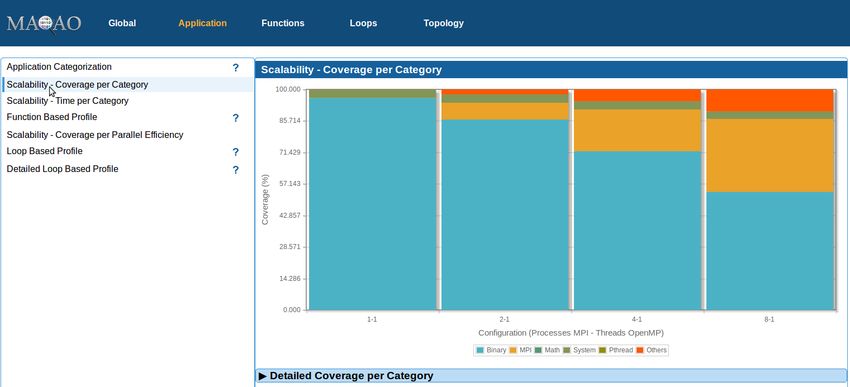
MAQAO Tutorial series: ONE-View
6
4 Reading Reports
Reports are generated in /REPORTS/ as _., where
is the analysed binary, is the value of the parameter –create-report and
the value of the parameter format.
4.1 HTML Output
HTLM reports can be read using Mozilla Firefox, Google Chrome and Microsoft Edge web browsers.
The main file is index.html, located in /RESULTS/_html/. All tabs
have a menu located at the top of the tab which can be used to navigate between tabs. All tabs are
described in next subsections. On most on tabs, there are one or several symbols that display help
when the cursor is over them.
4.1.1Main Menu
Located on the top of each page, the main menu is used to navigate into the report.
Figure 1- HTML report main menu
The orange item is the current location. Global entry can be expanded by moving the cursor over it
to display a sub menu. Additional entries can appears depending of the context.
Global is the report entry point and described some general data about the application and
the experiment
o Configurations contains all configuration parameters used to generate the
experiment
o Logs is a copy of the log produced during the experiment
Application contains additional charts about the application
Functions is a profiling of the application at the function level
Loops is a profiling of the application at the loop level
Topology summarizes all nodes, processes and threads run by the application.
4.1.2 Global
The file index.html is the report index and it presents several sections:
Global Metrics on the top left, that presents several metrics the summarize the application
performances, the application charactristics or potentiel speedup that can be achieved by
performing some changes on the application. Some help about each metric is available by
moving the cursor over the metric name.
Chart box, located on the top right, is used to displayed charts relative to global metrics.
Displayed charts can be changed by clicking on some global metrics identified by a blue bar
on their left when the cursor is over. Clickable metrics will be detailled in a folowing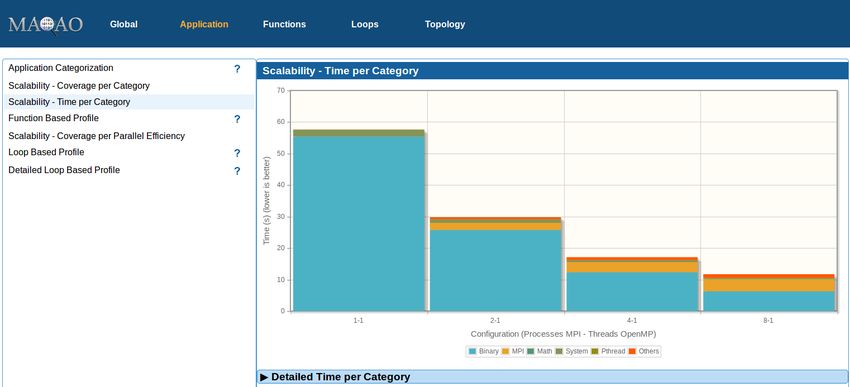
MAQAO Tutorial series: ONE-View
7
subsection. When the symbol ⏎ appears in the box header right, it can be clicked to display
the summary speedup chart.
Experiment Summary on the page bottom left summarized several parameters about the
experiment
Configuration Summary on the bottom right displayed some of the configuration parameters
set to run the experiment. The full configuration is available in the main menu entry
Configurations
Disclaimer: All screenshots presented in this manual are extracted from the default report. When
the scalability analysis is used, data from all runs are displayed in most of pages and charts can
be slightly different.
Figure 2- Global Report Without Scalability Analysis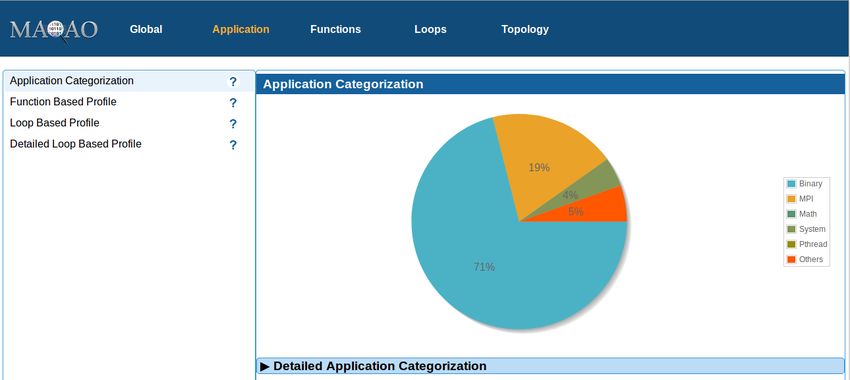
MAQAO Tutorial series: ONE-View
8
4.1.2.1Global Metrics
Total Time (s) – Not clickable – Time spent during the application execution expressed in
seconds
Profiled Time (s) – Not clickable – Time spent during the application profiling execution
expressed in seconds. It can be lower than Total Time (s) when a part of the application is
excluded from the profiling using option profile_start
Time in loops (%) – Clickable – Percentage of time spent in application loops, based on the
Profiled Time (s) value. When clicked, it displayed a chart presenting a loop based profiling.
Time in innermost loops (%) – Clickable - Percentage of time spent in application innermost
loops, based on the Profiled Time (s) value. When clicked, it displayed a chart presenting an
innermost loop based profiling.
Time in user code (%) – Clickable – Percentage of the time spent in the user code, based on
the Profiled Time (s) value. User code is considered as functions located in the application
main binary and libraries listed in external_libraries. When clicked, it displayed a
categorization of the application.
Compilation options – Not clickable - A quick analyse of compilation options used to produce
the application binary.
Perfect Flow Complexity – Clickable – Optimistic speedup of the application if the number of
path is reduced. When clicked, it display a categorization of loops based on their path count.
Array Access Efficiency (%) – Not clickable – Indicates if data layout is adapted to processor
capabilities or not
Perfect OpenMP + MPI + Pthread – Not clickable – Optimistic speedup of the application if
time spent in OpenMP, MPI and Pthread runtimes is null.
Perfect OpenMP + MPI + Pthread + Perfect Load Distribution – Not clickable – Optimistic
speedup of the application if time spent in OpenMP, MPI and Pthread runtimes is null and if
all threads are perfectly balanced.
No Scalar Integer – Clickable – Optimistic speedup obtainable if all instructions performing
scalar integer computation and address computation are removed from all innermost loops.
When clicked, it displays a chart detailing the evolution of the speedup based on which loops
are optimized
FP Vectorised – Clickable – Optimistic speedup that can be achieved if all floating point
instructions are vectorised in all innermost loops. When clicked, it displays a chart detailing
the evolution of the speedup based on which loops are optimized
Fully Vectorised – Clickable – Optimistic speedup that can be achieved if all all instructions
are vectorised in all innermost loops. When clicked, it displays a chart detailing the evolution
of the speedup based on which loops are optimized
Only FP Arithmetic – Clickable – Optimistic speedup that can be achieved by keeping only
arithmetic floating point instructions. When clicked, it displays a chart detailing the evolution
of the speedup based on which loops are optimized
It exists additional global metrics that are not available in report ONE.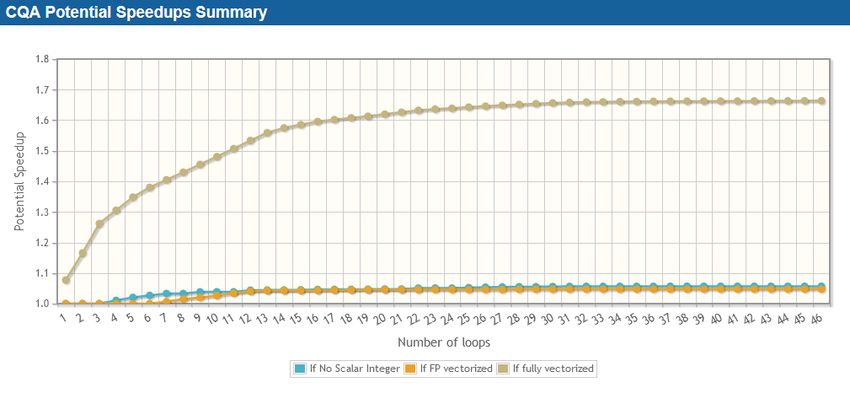
MAQAO Tutorial series: ONE-View
9
4.1.2.2Charts
This section details all charts that can be displayed in the chart box.
CQA Potential Speedups Summary – Default chart displayed on the page, it summarized
various speedups (No Scalar Integer, FP Vectorised, Fully Vectorised) and their evolution
according to the number of optimized loops. The x-axis corresponds to the number of
optimized loops. Loops are ordered by their coverage. The y-axis correspond to an optimistic
speedup on the total application time that can be achieved.
Figure 3- CQA Potential Speedups Summary ChartMAQAO Tutorial series: ONE-View
10
Loop Based Profile – Available through the global metric Time in loops (%), the chart
displayed a profiling of the application at the loop level. Loops are grouped based on their
coverage into buckets. Loops are divided into three categories: Innermost/Single are loops
that don’t contain any other loop, InBetween loops are loops that contain a least one other
loop and are contained in a loop, and Outermost loops contains others loops, but are not
contained in a loop. For each bucket and each loop category, the chart displays the number
of loops and the coverage they represent. In addition, the cumulated coverage across
buckets in displayed.
Figure 4- Loop Based Profile Chart
Innermost Loop Based Profile – Available through the global metric Time in innermost loops
(%), the chart is similar to Loop Based Profile, but it focuses on Innermost/Single loops only.
Figure 5 - Innermost Loop Based Profile Chart
Application Categorization - Available through the global metric Time in user code (%), the
chart details the percentage of the application spent in various categories. Some customMAQAO Tutorial series: ONE-View
11
categories can be created using configuration parameter custom_categories.
Figure 6- Application Categorization Chart
Loop Path Count Profile – Available through the global metric Perfect Flow Complexity, the
chart categorizes innermost loops into buckets according to their number of path. For each
bucket, the chart displays the number of loops it contains and how much coverage it
represents. In addition, the cumulated coverage across buckets is displayed. The chart allows
to detect if the application have potential performances issues because of loops with
multiple number of paths.
Figure 7 - Loop Path Count Profile Chart
Cumulated Speedup If … - Available through global metrics No Scalar Integer, FP Vectorised
and Fully Vectorised, the chart details one specific speedup shown in CQA Potential
Speedups Summary based on the clicked global metric. The x-axis gives loops sorted by theMAQAO Tutorial series: ONE-View
12
higher global speedup.
Figure 8 - Cumulated Speedup if ... Chart
4.1.3 Application
The Application tab shows several charts available by clicking on the corresponding menu entry on
the left. Menu entries whose name started by Scalability are only available in scalability report. Other
entries are available with any report.
4.1.3.1 Application Categorization
Similar to the graph of the same name presented in section 4.1.2.2, it details the percentage of the
application spent in various categories. The section Detailed Application Categorization can be
expanded to reveal a table with all data for each thread, process and node. An example is available
with Figure 9 - Application Categorization. In this example, there is about 20% of the application time
spent in MPI runtime (not MPI parallel sections), 70% in the application code (it include parallel
regions) and 10% in two other categories.
Figure 9 - Application CategorizationMAQAO Tutorial series: ONE-View
13
4.1.3.2 Function Based Profile
It presents a profiling of the application at the function level. Functions are grouped by coverage in
buckets and for each bucket, three metrics are available:
- The number of function in the bucket,
- The total coverage of the bucket,
- The cumulated coverage with all previous buckets
An example is available with Figure 10 - Function Based Profile. The example presents an application
containing five functions whose coverage is greater than 8%, which represents 54% of the total time.
Figure 10 - Function Based Profile
4.1.3.3 Scalability - Coverage Per Category
This view is only available for reports executed with scalability mode enabled. It presents the same
data than section 4.1.3.1, but there is one bar per configuration in the scalability parameters.
Configurations are formatted as - It allows to see the impact of the
number of processes and threads on the different categories. An example is shown by Figure 11 -
Scalability: Coverage Per Category. In the example, we can see the time spent in MPI library increase
with the number of processes.MAQAO Tutorial series: ONE-View
14
Figure 11 - Scalability: Coverage Per Category
4.1.3.4 Scalability - Time Per Category
This view is only available for reports executed with scalability mode enabled. It presents data similar
than section 4.1.3.3, but now it is a time (in seconds) and not a coverage that is displayed. It allows to
see the impact of the parallelism over the application time and categories. An example is presented
by Figure 12 - Scalability: Time Per Category.
Figure 12 - Scalability: Time Per Category
4.1.3.5 Scalability - Coverage Per Parallel Efficiency
This chart is only available for reports executed with scalability mode enabled. It presents the
efficiency of functions across runs of the scalability analysis. The efficiency is based on the first run
described in parameters so the first bar is always in the grey color. Grey elements are functions that
where not found during the first profiling. Colours varies from green for efficient functions to red forMAQAO Tutorial series: ONE-View
15
not efficient functions. An example is displayed by Figure 13 - Scalability: Coverage per Parallel
Efficiency.
Figure 13 - Scalability: Coverage per Parallel Efficiency
4.1.4 Functions
The Functions tab presents a profiling of the application at the function level, listing all used
functions with their coverage. By clicking on the arrow on the left of any functions, the box can be
opened to reveal all profiled loops belonging to the function represented as a tree. Loops can also be
opened by clicking on the left arrow. If a loop has a circle instead of an arrow, it means it is an
innermost loop. All coverages are global to the application. A row can be fully expanded by clicking
on the symbol + appearing on the right of the current row.
By clicking on a column header, the table is sorted according to this column.
By right-clicking on a row (either loop or function), a menu appears and allows to display several
charts:
- Load Distribution: The distribution of the function / loop coverage across threads.
- Sorted Load Distribution: The distribution of the function / loop coverage descending sorted
across threads.
- Load Distribution All Threads: The distribution of the function / loop coverage across threads,
including 0 values for threads that do not run the function / loop.
- Scalability Report: Only available in the scalability analysis, it presents the efficiency and the
speedup of the functions / loop across all experiments of the scalability analysis.
- Load Callchains: A table displaying call chains of the selected function or loop.
- Go to reports …: Open the detailed report of the selected function or loop in the current tab.
The topmost tab Filter allows to filter the functions according to the library where they are defined.MAQAO Tutorial series: ONE-View
16
By double-clicking on a function or a loop, a new tab presenting all results for the loop is opened in
the browser. Details about loop tabs are described in the subsection Loop and details about function
tabs are described in the subsection Function.
In the scalability report, optional columns can be displayed by clicking on boxes in the list above the
table to display efficiency and speedups from the scalability analysis.
4.1.5 Function
The Function is not accessible from the menu, but only from tabs Functions and Loops. This tab is
split in two panels whose width can be adjusted by moving the vertical blue bar on the left or on the
right. Each panel content can be changed by selecting a report in the select box. Current reports are:
- The source code is available.
- The call chains table.
- The load distributions charts.
- The CQA report. More details about CQA are available in the CQA tutorial available at
http://maqao.org/release/MAQAO.Tutorial.CQA.intel64.pdf. Current path can be changed
using arrows in the path selection header or by selecting a path identifier in the text box then
clicking on the OK button.
- The function loop hierarchy with links to all its loops report.
- In the scalability report, the function scalability report.
The symbol can be clicked to open the current panel in a new browser tab. The same report
cannot be opened in both panels.
4.1.6 Loops
The Loops tab presents a profiling of the application at the loop level, listing all analysed loops. For
each loop, there is the MAQAO identifier, data about the location in the source code and the
coverage with a colour associated to it. The colour is red when the loop is hot (high coverage) and it
goes to blue when the loop is cold (low coverage).
Additional columns can be displayed by checking to corresponding box just above the table.
By clicking on a column header, the table is sorted according to this column.
By right-clicking on a row, a menu appears and allows to display several charts:
- Load Distribution: The distribution of the loop coverage across threads.
- Sorted Load Distribution: The distribution of the loop coverage descending sorted across
threads.
- Load Distribution All Threads: The distribution of the loop coverage across threads, including
0 values for threads that do not run the loop.
- Scalability Report: Only available in the scalability analysis, it presents the efficiency and the
speedup of the loop across all experiments of the scalability analysis.
The topmost tab Filter allows to filter the loops according to the library where they are defined.MAQAO Tutorial series: ONE-View
17
By double clicking on a loop, a new tab presenting all results for the loop is opened in the browser.
Details about this tab are described in the subsection Loop.
4.1.7 Loop
The tab Loop is not accessible from the menu, but only from tabs Functions and Loops. This tab
contains all available data about a specific loop and is similar than Function tab described in section
4.1.5. Its reports are:
- The source code is available,
- The assembly code with a memory group analysis that can be displayed by clicking on the
corresponding button. A memory group is a set of assembly instructions that access to a
same memory region. Most of the time, it corresponds to a same source data structure.
- The call chains table.
- The load distributions charts
- The CQA report. More details about CQA are available in the CQA tutorial available at
http://maqao.org/release/MAQAO.Tutorial.CQA.intel64.pdf. Current path can be changed
using arrows in the path selection header or by selecting a path identifier in the text box then
clicking on the OK button.
- A table with more advanced CQA metrics
- In the scalability report, the function scalability report.
The symbol can be clicked to open the current panel in a new browser tab. The same report
cannot be opened in both panels.
4.1.8 Topology
The tab Topology presents the topology of the run, meaning how threads, processes and nodes used
during the run are organised. The table can be expanded by clicking on the left arrow, or fully
expanded by clicking on the + symbol appearing on the right of the current row.
By double-clicking on a thread row, a new tab with the thread profiling at the function level is
opened.
In the scalability report, additional tables are available for each experiment.
4.2 Text Output
The text report is displayed on the terminal. It can be customized using several options:
--text-global [=on/off]: Display Global section if parameter is on (default), else do not display
it if off.
--text-application [=on/off]: Display Application section if parameter is on (default), else do
not display it if off.
--text-functions [=on/off]: Display Functions section if parameter is on (default), else do not
display it if off.
--text-functions-full [=on/off]: Display all data for Function section if parameter is on
(default), else do not display it if off.MAQAO Tutorial series: ONE-View
18
--text-loops [=on/off]: Display Loops section if parameter is on (default), else do not display it
if off.
--text-loops-full [=on/off]: Display all data for Loops section if parameter is on (default), else
do not display it if off.
--text-cqa [=on/off/[module:]id1, [module:]id2]: Display CQA section if parameter is on
(default), else do not display it if off. Analysed loops can be filtered by giving for each loop its
module (binary (default) or an entry in external_libraries) and its MAQAO identifier.
--text-cqa-full [=on/off/[module:]id1, [module:]id2] Display all data for CQA section if
parameter is on (default), else do not display it if off. Analysed loops can be filtered by giving
for each loop its module (binary (default) or an entry in external_libraries) and its MAQAO
identifier.
Default output display sections Global, Application, Functions, Loops and CQA.
Text report sections are similar to corresponding HTML sections. CQA section is CQA reports of
selected loops.
There is no special output for scalability in text output, it will be added in a future update.
4.3 XLSX Output
Available using option --output-format=xlsx in the command line, XLSX files can be read by several
softwares: Microsoft Office Excel, LibreOffice, OpenOffice. The file contains several tabs whose
content is presented in HTML section (section 4.1).
5 Comparing Reports
During the optimization process, applications are often analysed several times to get results of
various changes. As it can be time consuming to compare manually several reports, ONE-View offers
a way to generate an HTML report that compare existing ONE-View reports.
$ maqao oneview --compare-reports --inputs=,…
There is no restrictions on what can be compared using this option. It handle various applications,
architectures, compilations options, source code …
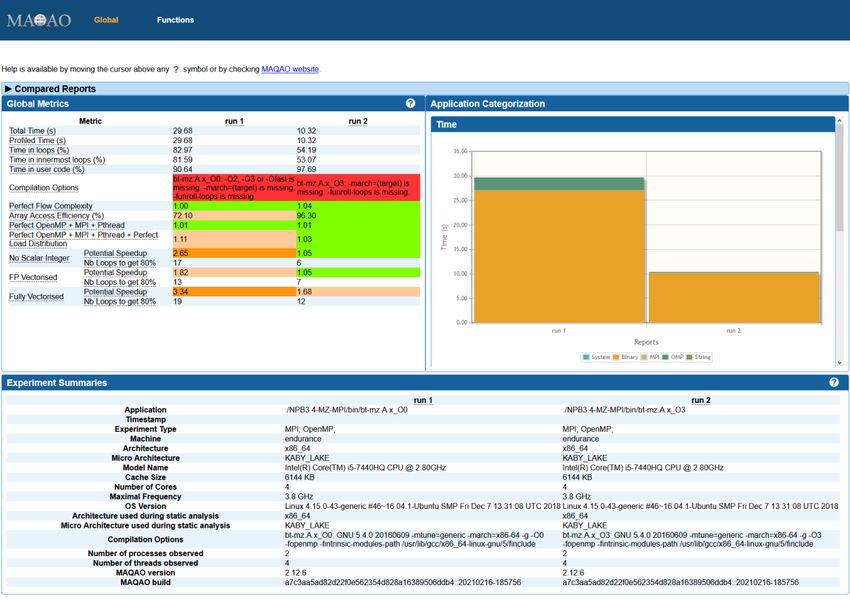
It produces a directory containing an HTML report. index.html is the main file and is very similar to
what is presented in section 4.1.2, excepted charts compare given runs instead of focusing on a
single one. It is shown in Figure 14 - Comparison Index.MAQAO Tutorial series: ONE-View
19
Figure 14 - Comparison Index
functions.html presents a function based profile of all the given reports. As there may have a lot of
differences between compared experiments, some functions may not appears in all runs and there
corresponding values are nil, as shown by Figure 15 - Function Comparison. Rows can be sorted by
clicking on any column header.
Figure 15 - Function ComparisonYou can also read