Assessment of the Strain Distribution in Wood Adhesive Bonds by Contact-free Measurement and Finite Element Analyses
←
→
Page content transcription
If your browser does not render page correctly, please read the page content below
Assessment of the Strain Distribution in Wood Adhesive
Bonds by Contact-free Measurement and Finite Element
Analyses

Erik Serrano1 and Bertil Enquist2
1. SP Swedish National Testing and Research Institute, BORÅS, Sweden.
2. School of Technology and Design, Växjö University, Växjö, Sweden

Abstract
This article reports on an investigation relating to the strain distribution in wood adhesive
bonds. Measurements with a 1.3M ARAMIS system are presented and compared with finite
element simulations. The results from tests with two different specimen geometries and three
different adhesives are reported. The adhesives tested were a phenolic resorcinol (PRF), a
one-component polyurethane (PUR) and an epoxy (EPX). The finite element study included
the use of a non-linear fracture mechanics model for the adhesive bond line. The
measurements performed show that the different adhesives resulted in different strain
distributions at a given load, which can be attributed their different mechanical properties in
terms of stiffness and ductility (fracture energy). The brittle PRF adhesive showed more
localised strains than the more ductile EPX and PUR adhesives did at the same load level. As
expected from a theoretical point of view, the two specimen geometries tested showed
different strain distributions. Another conclusion drawn is that the measurement technique is
very useful in terms of providing detailed data, i.e. at a high level of spatial resolution, for
calibration of numerical models.
Introduction
Background
Although adhesive technology has been used since historic times for wood-based
applications, the state of knowledge concerning the basic mechanical behaviour and
requirements is still poor in practice. For example, it is often stated that wood adhesive bonds
showing adherend failure are adequately designed, so that no further attention needs to be
given to the design of the bond line. It is however well known within the scientific
community that not only the bond line and adherend strengths, but also the ductility (or
brittleness) of the bond line, are important parameters for the load-bearing capacity of an
adhesive joint. By ductility is here meant the joint’s capability to produce a uniform stress
distribution for a given load. This capability, which obviously is of great importance for
producing joints with a high load bearing capacity, is in turn dependent on the joint geometry,
the stiffness and strengths of the materials, the plastic behaviour of the joint and its fracture
energy. Thus, knowing the stress, or the strain, distribution in a joint is crucial for determining
the ductility of the bond line.
         Typically, tests on wood adhesive bonds are focused on determining the load-
deformation response of a standardised specimen, this being done by sampling the load
applied by the testing machine, and the movement of the testing machine’s cross-head. Small
clip-gauges or LVDTs can be attached to selected parts of the specimen in order to obtain
more detailed information, or one could alternatively glue strain gauges into the bond line.
Such measurements are, however, restricted in terms of spatial resolution, and it is therefore
difficult to obtain any detailed information on the strain distribution along the joint.

                                                                                              1(7)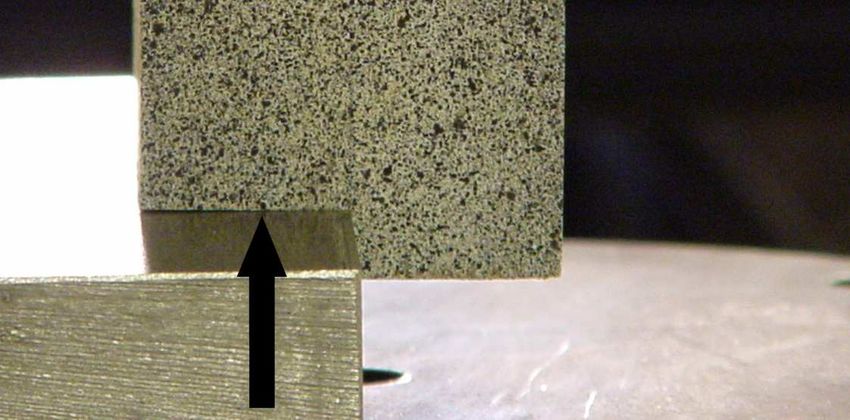
Previous work
DIC-techniques have been used for wood-based materials, although references are scarce. In
relation to wood adhesive bonds, only in-plane measurements have been reported (Zink 1992;
Zink et al. 1995). In very recent work the strain distribution in wood adhesive joints was
studied, by use of electronic speckle interferometry (ESPI), (Müller et al. 2005; Gindl et al.
2005). Such techniques are, however more complicated to use if large strains, beyond the
elastic limit, are to be monitored.
Aim
The work reported herein was performed in order to investigate the possibility of using DIC
for measuring the strain distribution in wood adhesive bond lines. Main focus has been on
determining the strain distribution obtained for different adhesives. As explained above, the
strain distribution is dependent on the mechanical properties of the adhesive. Also the
influence of using a different test specimen for one of the adhesives was investigated.
        Some numerical finite element results are also reported. These were performed for
comparison with the experimental results. The aim was not to obtain accurate fits to the
experimental results, but to determine whether these test results, and especially the strain
distributions obtained from the ARAMIS system were plausible.
        For a more detailed account of the mechanical behaviour of the test specimens,
including the type of specimens used here, reference is made to (Serrano 2004). In a recent
publication this investigation is presented in more detail (Serrano and Enquist 2005).
Materials and methods
Experimental
All the specimens were manufactured from Beech (Fagus sylvatica L.). The adhesives used in
the investigation were a phenolic resorcinol (PRF), a 2-component polyurethane (PUR) and
an epoxy (EPX). The geometries of the test specimens, which are according to the European
standard EN 302-1 and the US standard ASTM D905, are shown in Figure 1. Note that
especially the EN 302-1 specimen is small, the overlap length which is tested is only 10 mm.

                                                                                 6.35

                                                                                     44.45

                                             5
                    10                       5
              150

                                                                                        mm
                                                       Glue Joint             50.8
                                        20
                                                                    19.05
       Figure 1. Geometry of the test specimens. Left: EN302-1. Right: ASTM-D905.

        Since the test specimens are different, the nominal shear strength obtained from the
respective tests is expected to differ, the smaller overlap of the EN 302-1 specimen should
give a more uniform shear stress distribution. Figure 2 shows the test set-up for the two
specimens.

                                                                                             2(7)
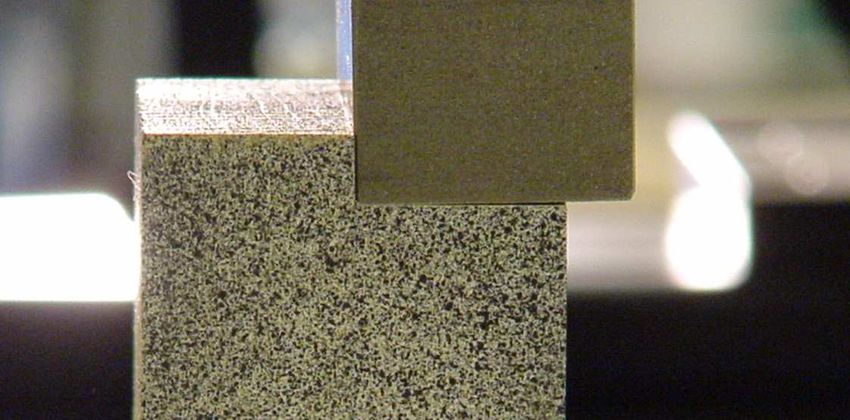
Figure 2.   Left: EN 302-1 specimen with cameras. Right: ASTM specimen with speckle
            pattern applied. The arrow indicates the load direction of the cross head.

Contact free measurement system
        A 1.3M ARAMIS system was used. The speckle pattern was achieved by applying
white and black spray paint on the specimens prior to testing.
        Frame grabbing was achieved by adjusting the time interval so as to obtain 50-100
pairs of pictures during each test. The load and displacement signals from the testing machine
were also sampled when taking each pair of pictures.
        The settings used for the ARAMIS system gave a spatial resolution of approximately
0.2 mm for the EN 302 specimen. A slightly different set-up was used for the ASTM
specimen, resulting in a spatial resolution of approximately 0.3 mm.
Numerical methods
Geometry, loading conditions and material modelling
Only FE-results relating to the EN302 specimen are presented, this being chosen for its
relative simplicity in terms of modelling. The ASTM specimen is more complex to model,
mainly due to the fact that its behaviour is strongly affected by local crushing in a narrow
zone close to the bond line.
        Figure 3 shows the 2D plane strain model of the EN302, consisting of approximately
3600 elements and 7450 nodes, resulting in 14900 degrees of freedom.

        Figure 3. Close-up of the FE-mesh at the bond line of the EN 302-1 specimen.

       The elastic constants used for the wood material were EL=11600, ER=2200, ET=1140,
GLR=1610, GLT=1060 and GRT=640 MPa for the moduli of elasticity and the shear moduli,
and νLR=0.45, νLT=0.52 and νRT=0.71 for Poisson’s ratios. The indices L, R and T denote the

                                                                                         3(7)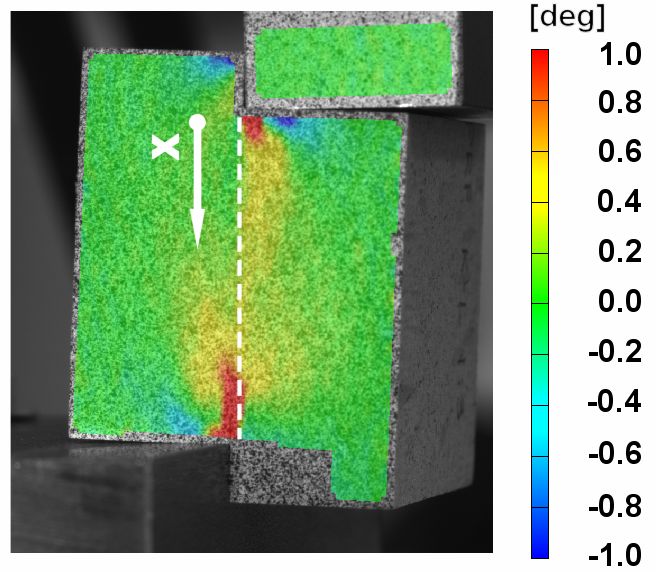
longitudinal, radial and tangential direction, respectively, of the assumed orthotropic material
as indicated in Figure 3.
        The bond line thickness was set to 0.1 mm in the FE-model. The thickness was also
measured in a microscope and was found to vary between 0.1-0.2 mm. A nonlinear fracture
mechanics model was used to simulate the behaviour of the bond line. The model employed is
described in detail in (Serrano and Gustafsson 1999; Serrano 2004). It takes into account the
strain softening behaviour of the bond line in both shearing mode (mode II) and tensile
opening mode (mode I). The model also takes into account the coupling effect meaning that
the local strength and the fracture energy both depend on the degree of mixed mode.
        Two sets of input data, one set to model a brittle and one to model a ductile adhesive,
were employed. The input data are estimates based on previous experimental investigations
(Serrano 2004) and are not fitted to the actual adhesives used here. The parameters of the
bond line model are the uniaxial softening behaviours in modes I (opening mode) and II
(shear mode). Piecewise linear stress versus deformation curves, see Table 1 and Figure 4, are
used as input to the model. In this particular case the fracture energies are approximately the
same for the two adhesives, and the ductility is defined not by the fracture energy, but rather
in terms of the slope of the descending part of the stress-versus-deformation curve, as
described in (Serrano and Gustafsson 1999; Serrano 2004).

                         Table 1. Summary of the bond line properties of two types of adhesives.

                                                                 Mode I                               Mode II
                                                                    Fracture                              Fracture
                                     Adhesive              Strength energy                       Strength energy
                                                           (MPa)    (J/m2)                       (MPa)    (J/m2)
                                     Brittle               6        550                          18       1250
                                     Ductile               6        550                          12       1230

                   20                                                                       20
                                                                   Mode I                                                               Mode I
                                                                   Mode II                                                              Mode II

                   15                                                                       15
    Stress (MPa)

                                                                             Stress (MPa)

                   10                                                                       10

                    5                                                                       5

                    0                                                                       0
                     0   0.1   0.2     0.3    0.4    0.5     0.6      0.7                    0   0.1   0.2    0.3    0.4    0.5   0.6      0.7
                                      Deformation (mm)                                                       Deformation (mm)

Figure 4.                Uniaxial behaviour of the bond line model for a brittle adhesive (left) and a
                         ductile adhesive (right).

Results
The EN302 specimens at 10 MPa nominal shear stress were used for investigating differences
in strain distributions.
        In Figure 5, the shear strain is plotted for a path along the bond line glued with the
three adhesives, at a nominal shear stress of 10 MPa. At this stage, the PUR is the more
ductile one, the EPX and the PRF adhesives showing smaller shear strain angles.

                                                                                                                                                  4(7)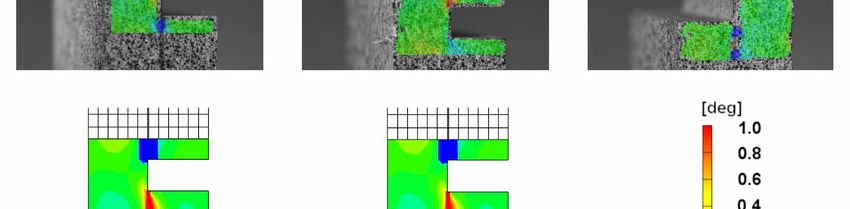
2.5
                                                               EPX
                                                               PRF
                                                2
                                                               PUR

                          Shear strain (deg)
                                               1.5

                                                1

                                               0.5

                                                0
                                                 0   2     4      6      8   10
                                                         Distance (mm)

Figure 5.   Shear angle distribution in the bond line of the EN302 specimen at 10 MPa shear
            stress.

In the upper part of Figure 6, the shear strain distribution, at 10 MPa nominal shear stress, is
shown. The results from the FE-analyses are shown in the lower partsof Figure 6. Note that
the same scale is used for the test results and for the FE-results.

Figure 6.      Strain distributions at nominal shear stress of 10 MPa. Top row: Shear angles
               from tests of the PRF, EPX and PUR adhesives (from left to right). Bottom
               row: Shear angles from FE-analyses of brittle and ductile bond line behaviour
               (from left to right). The same scale is used for all plots.

                                                                                              5(7)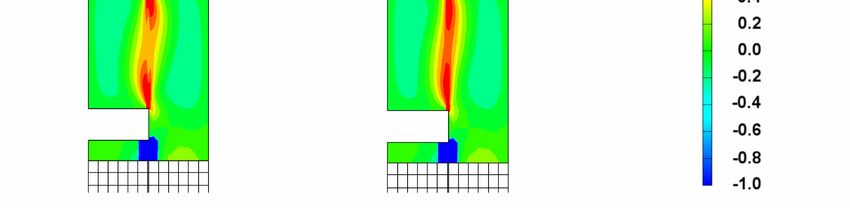
The results from the test with the ASTM-specimen are shown in Figure 7, for this
specimen at a nominal average shear stress of 6 MPa. As can be seen, the lower part of the
bond line has begun to fail, as shown both by the large area that is highly strained and by the
strain values found at distances of more than 20 mm. As mentioned, the spatial resolution in
the measurements of the ASTM specimen was about 0.3 mm. This results in a smoother shear
strain plot compared to the one shown in Figure 5, since the lower resolution implies that
every calculated point represents the average of a larger area.

                                                             10

                                                                    8

                                               Shear strain (deg)
                                                                    6

                                                                    4

                                                                    2

                                                                    0
                                                                     0   10          20         30   40
                                                                              X-distance (mm)

Figure 7.      Bond line shear angle in the ASTM specimen at 6 MPa shear stress as
               determined by tests.
Discussion and conclusions
The strain distributions obtained from the ARAMIS measurements and from the FE-analyses
are similar in terms of at least two major features; the size of the zone containing large shear
strain angles (greater than 1 degree) and the S-shape of the highly strained zones, see Figure
6. Note also that the more brittle adhesive (PRF) shows more localised strains than the more
ductile one (PUR) does, which is fully in line with the discussion on ductility in the
introduction. Thus, it is possible to distinguish from each other, on the basis of the ARAMIS
measurements, adhesives that are markedly different from each other in terms of flexibility
and ductility.
        The results obtained for the ASTM specimen as shown in Figure 7, indicate that the
strain distribution is different from that of the EN302 specimen, Figure 5. Although the
nominal shear stress is higher for the EN302 specimen results, the strain distribution is more
localised in the ASTM specimen in Figure 7. The measurement technique employed is thus
capable of distinguishing the different mechanical behaviours of these two standardised test
methods.
        Using techniques such as the one described here does not exclude the need for
conventional measurement techniques, nor does it replace traditional finite element analyses.
Instead, such techniques should be considered as a complement to the traditional ones, giving
strain distributions with a high degree of spatial resolution in situations in which traditional
strain gauges or transducers cannot be used. There is also a large potential for use of the
measurement technique in the design of experimental set-ups and for the verification and
calibration of numerical simulations. In such cases it is important to use a concurrent
engineering approach that involves an active and iterative collaboration between expertise
within the experimental and theoretical fields. Another area of application in which the
contact-free measurement technique could prove useful is in situations in which the test object
would be severely affected by any other means of measuring deformations, which is often the
case in testing thin films or paper. Finally, for testing at high temperatures or high humidities,

                                                                                                          6(7)
use of a contact-free technique could well be the only approach to measuring deformations
available.
Acknowledgements
This work was made possible through to the financial support of the Swedish Research
Council for Environment, Agricultural Sciences and Spatial Planning (FORMAS). The work
was carried out at SP – Swedish National Testing and Research Institute and at the Division
of Structural Mechanics at Lund University. Special thanks is directed to Mr. Thord Lundgren
from Structural Mechanics for his invaluable help with the test procedures and also to GOM
GmbH in Germany and Cascade Computing AB in Sweden for use of the measurement
equipment.
References
Gindl, W., Sretenovic, A., Vincenti, A. and Müller, M. (2005) Direct measurement of strain
distribution along a wood bondline. Part II. Effects of adhesive penetration on strain
distribution. Holzforschung, Vol. 59, pp.307-310, Walter de Gruyter.
Müller, M., Sretenovic, A., Vincenti, A. and Gindl, W. (2005) Direct measurement of strain
distribution along a wood bondline. Part I. Shear strain concentration in a lap joint specimen
by means of electronic speckle pattern interferometry. Holzforschung, Vol 59, pp. 300-306,
Walter de Gruyter.
Serrano, E. and Enquist, B. (2005) Contact free measurement and non-linear finite element
analyses of strain distribution along wood adhesive bonds. Holzforschung, Vol 59. pp. 641-
646, (In press).
Serrano, E. (2004) A Numerical Study of the Shear-Strength-Predicting Capabilities of Test
Specimens for Wood-Adhesive Bonds. International Journal of Adhesion and Adhesives. 24
(1) pp. 23-35
Serrano, E. and Gustafsson. P. J. (1999) Influence of bondline brittleness and defects on the
strength of timber finger-joints. International Journal of Adhesion and Adhesives. 19 (1) pp.
9-17.
Zink, A. G. (1992) The influence of overlap length on the stress distribution and strength of a
bonded wood double lap joint. PhD thesis. State University of New York, Syracuse, USA.
Zink, A. G., Davidson, R. W., Hanna Robert, B. (1995) Strain measurement in wood using a
digital image correlation technique. Wood and fiber science 27(4):346-359
7(7)You can also read