Comparison Study of PPG Characteristics from Candlestick Model Using GH-Method: Math-Physical Medicine - sciaeon
←
→
Page content transcription
If your browser does not render page correctly, please read the page content below
S
                       Journal of
   p               s
                       Nutrition and Dietetic Practice
 O

       en
               s
                   e
            Ac c

Research Article

Comparison Study of PPG Characteristics from Candlestick
Model Using GH-Method: Math-Physical Medicine
Gerald C Hsu*
eclaireMD Foundation, USA

Introduction                                                              which is similar to the glucose value decreasing when
                                                                          carbs/sugar intake decreases (less buyers) or exercise
This paper describes the author’s investigation results of his
                                                                          increases (more sellers).
glucose behaviors based on a Continuous Glucose Monitoring
(CGM) sensor collecting Postprandial Plasma Glucose (PPG)             During his period of using CGM sensor to collect his glucoses
data from breakfast, lunch, and dinner, using a candlestick           data (from 5/5/2018 to 5/19/2020), Gerald has compiled a total
charting techniques from Wall Street and his developed GH-            of 56,730 data via a Continuous Glucose Monitoring (CGM)
Method: Math-Physical Medicine approach.                              sensor placed on his upper left arm with an average of 76.25
                                                                      measurements per day approximately every 15 minutes. His
Methods
                                                                      standard Postprandial Plasma Glucose (PPG) wave covers a
A Japanese merchant, who traded in the rice market in Osaka,          period of 180 minutes, or 3-hours from the first bite of his
Japan, started the candlestick charting around 1850. An               meal. Each PPG waveform contains the following five key
American fellow, Steve Nison, brought the candlestick model           characteristic data:
concept and method to the Western world in 1991. These
                                                                          1. “Open” value as his PPG at first-bite, 0 minute
techniques are largely used in today’s stock market to predict
the stock price trend [1].                                                2. “Close” value as PPG at 180 minutes
On 4/17/2018, the author had an idea to study glucose behavior            3. “Minimum” value as the lowest PPG
by using the candlestick chart (aka “K-Line”) and subsequently
                                                                          4. “Maximum” value as the highest PPG
developed customized software to analyze his big data of
glucose. The analogies between fluctuations of stock price and            5. “Average” glucose - average value of 12 recorded PPG
glucose value are described as follows:                                      data per meal over 3-hours
1. Stock prices are closely related to the psychology of the          Based on his 2,232 meal candlestick bars, glucose patterns
   buyers and sellers, which is similar to the glucoses related       and moving trends can be observed and analyzed through
   to a patient body’s biochemical interactions and behavior          further mathematical and statistical operations [2]. Finally,
   psychology.                                                        he interpreted these operational results with his acquired
2. Stock price wave of a public traded company is dependent           knowledge of biomedical phenomena of his body in order to
   upon its product line, internal management, marketing              discover some hidden medical truth or potential health dangers
   efforts, and public events and perception. This is                 via TIR analysis.
   remarkably similar to the PPG wave of a diabetes patient           Since the stock market is much more lucrative than the medical
   being dependent on his/her complex food & diet (buying             research field, it attracts more talented mathematicians
   stock), exercise pattern and amount (selling stock),               and engineers to work in the highly rewarded financial
   weather temperature (buying stock), and pancreatic beta            industry. They even call themselves, “Finance Engineers”.
   cell insulin function (SEC regulations). From a trained            On the contrary, most financial rewards in the medical
   mathematician’s eyes, both waves are just two similar              community are distributed to pharmaceutical companies,
   mathematical representations.                                      healthcare institutions, and clinical medical doctors. From
3. When there are more buyers than sellers, the price goes up,        the author’s personal observation, a large amount of medical
   which is similar to the glucose value rising when carbs/           research scientists are self-motivated through their interests
   sugar intake increases (more buyers) or lack of exercise
   (less sellers).                                                    Correspondence to: Gerald C Hsu, eclaireMD Foundation, USA, Email :
                                                                      g.hsu@eclairemd.com, Tel +1-510-331-5000
4. When there are more sellers than buyers, price goes down,          Received: June 03, 2020; Accepted: June 17, 2020; Published: June 19, 2020

J Nutr Diet Pract                                                 1                                                         Volume 4(3): 2020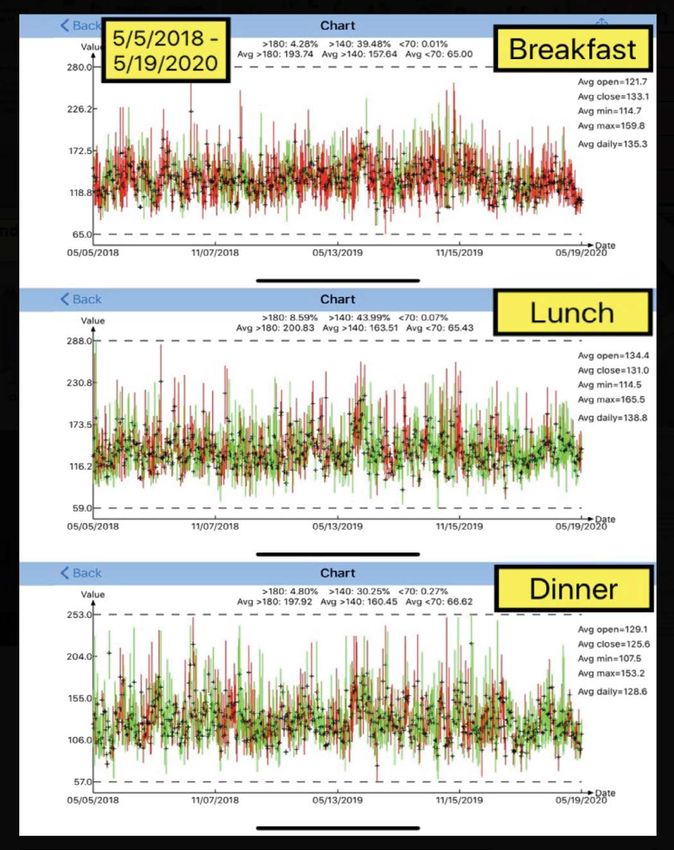
Hsu GC (2020) Comparison Study of PPG Characteristics from Candlestick Model Using GH-Method: Math-Physical Medicine

and dedication, which are mostly associated with either                 mathematical analysis methods from his academic educations
universities or research institutions. They are rarely rewarded         and professional experiences, as well as his accumulated
financially.                                                            knowledge regarding stock price and other financial analyses
                                                                        techniques, such as the Candlestick model, from his position
Gerald is a professionally trained mathematician, physicist,
                                                                        as the CEO of a public traded corporation, and apply them
engineer, computer scientist, and a successful entrepreneur.            to his medical research activities. This allowed him to learn
He accidentally wandered into the medical research field due            and gain from financial world intellectuals’ knowledge and
to his strong motivation of saving his own life after suffering         professional experiences.
many diabetes complications, such as five cardiovascular
episodes (CVD), chronic kidney disease complications                    Results
(CKD), and faced the possibility of death. As a result, he              Figure 1 shows the normal time-series analysis results of the
thought about how to import his learned physics principles and          finger-piercing tested PPG, CGM sensor collected PPG, meal’s

                    Figure 1: Postprandial Plasma Glucose (PPG) (Finger & Sensor), Carbs/sugar, and Post-meal Walking.

J Nutr Diet Pract                                                   2                                                    Volume 4(3): 2020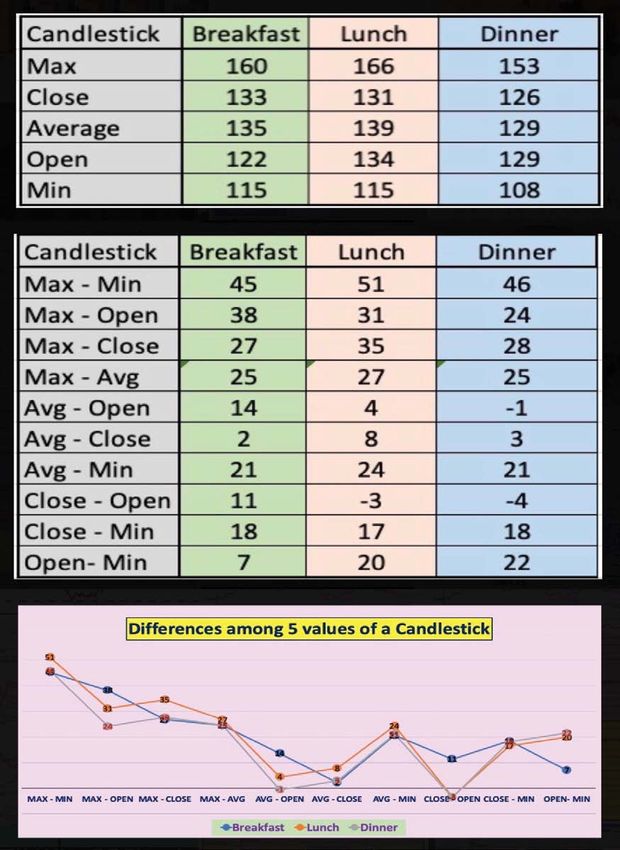
Hsu GC (2020) Comparison Study of PPG Characteristics from Candlestick Model Using GH-Method: Math-Physical Medicine

                                                Figure 2: Candlestick charts of 3 meals.

carbs/sugar intake amount in grams, and post-meal walking
steps for the period from 5/5/2018 to 5/19/2020.
Figure 2 depicts three candlestick models for breakfast, lunch,
and dinner, respectively during the same period. It is rather
difficult to identify useful and significant characteristics
from these candlestick charts directly without further pattern
analysis. This situation is similar to analyzing a publicly listed
company’s stock performance via its candlestick charts without
detailed analysis of its product lines, internal management,
marketing programs, and market perception.
We can extract more PPG associated values from the
candlestick charts of three meals regarding five key values
of opening, maximum, minimum, closing, and average; then,
put them into one consolidated table as shown in Figure 3.
Figure 3 also includes a “blow-up view” of different types of
candlestick bars.
It is obvious that the lunch data is higher than both the
breakfast and dinner data. In Figure 3 table, his carbs/sugar
intake amount and post-meal walking steps are also listed. The
average PPG values from both finger and sensor are only listed
here as a reference purpose. It is important to mention that
the author normally eats a simple breakfast with high-quality
protein and small amount of carbohydrates (average PPG 135
mg/dL and maximum PPG 160 mg/dL) and a very light dinner                 Figure 3: Data Table of 5 key Postprandial Plasma Glucose (PPG)
due to weigh control purpose (average PPG 129 mg/dL and                  characters, carbs/sugar, walking, and a blowup view of Candlestick.

J Nutr Diet Pract                                                    3                                                    Volume 4(3): 2020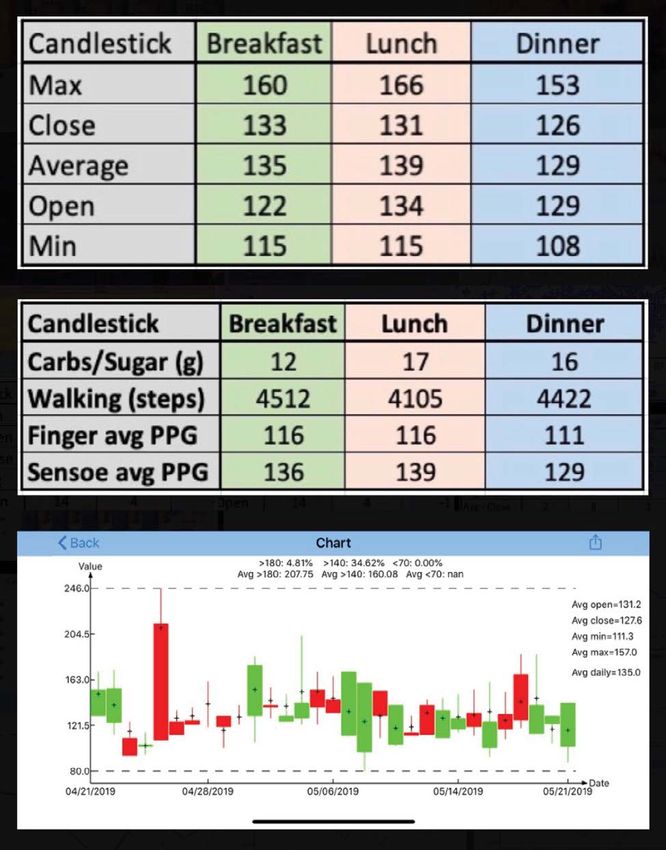
Hsu GC (2020) Comparison Study of PPG Characteristics from Candlestick Model Using GH-Method: Math-Physical Medicine

                                                                        maximum PPG of 153 mg/dL). Both post-breakfast and post-
                                                                        dinner walking amounts are within the range of 4,400 to 4,500
                                                                        steps. His heaviest meal is his lunch which contains a higher
                                                                        carbs/sugar intake amount from a plant-based diet (17g for
                                                                        lunch in comparison with 12g for breakfast and 16g for dinner)
                                                                        and the lowest post-lunch exercise level (4,150 walking steps)
                                                                        due to hot weather temperature around noon time. These are
                                                                        the reasons of his high lunch results with the highest average
                                                                        PPG (139 mg/dL) and the highest maximum PPG (166 mg/
                                                                        dL). The data in this section also describe the tight relationship
                                                                        between lifestyle and metabolism.
                                                                        Figure 4 shows candlestick bars for breakfast, lunch, dinner
                                                                        respectively, using each meal’s 5 key values.
                                                                        Figure 5 uses graphic presentations of both bar chart and point
                                                                        chart to clearly demonstrate the same data as shown in Figure
                                                                        3.
                                                                        Similar to the study of a publicly traded company’s stock
                                                                        performance via its stock candlestick charts, we must study
                                                                        and understand why its stock price is trending upward, in
                                                                        what speed, and how high it reaches to; why is the stock price
                                                                        trending downward, in what speed, and how low it reaches
                                                                        to; and what is the average price for that trading day. When
     Figure 4: Candlestick bars of breakfast, lunch, and dinner.        we connect their daily candlesticks together into a complete

                           Figure 5: Bar and Point charts of 5 key Postprandial Plasma Glucose (PPG) waveforms.

J Nutr Diet Pract                                                   4                                                   Volume 4(3): 2020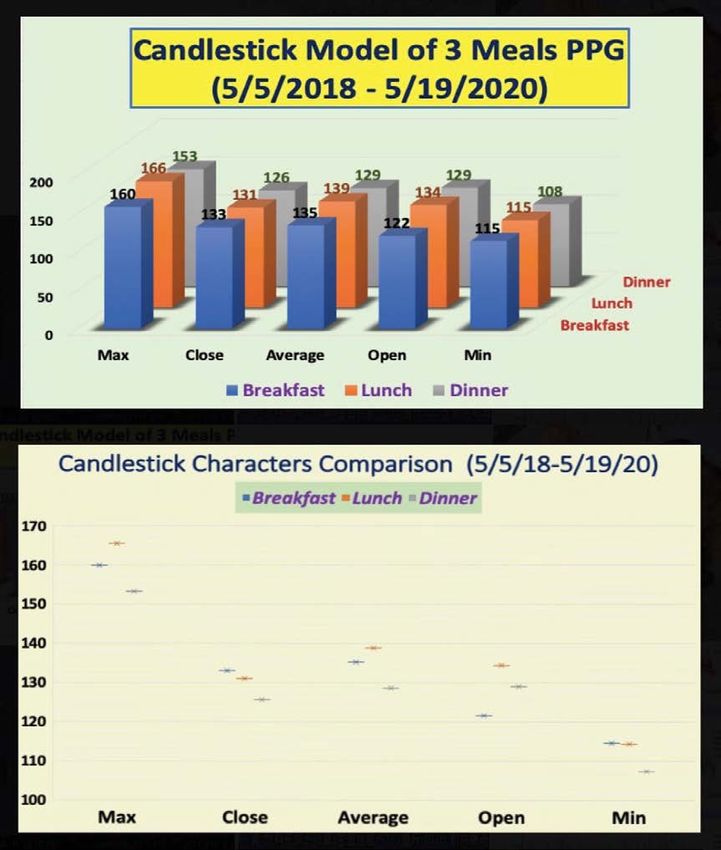
Hsu GC (2020) Comparison Study of PPG Characteristics from Candlestick Model Using GH-Method: Math-Physical Medicine
waveform, we can then investigate the waves past performance
and future trend to predict the wave moving direction and
its future performance. We can also analyze the reasons of
sudden significant changes of glucose candlesticks similar to
COVID-19 did on Wall Street trading candlesticks.
We can apply the same concept and similar method to analyze
the glucose waveforms since, in nature, both waves of the stock
price and blood sugar are two similar waves with the identical
mathematical form. Based on this fundamental understanding,
the author further calculated 10 more different values which
are derived from these five key candlestick characters, i.e.
open, max, average, min, and close. These 10 different values
are listed in the table and shown by the line chart in Figure
6. Due to the complexity of each “key character difference”
and their secondary significance, he will not put these detailed
findings and their meanings in this article.
Through Figure 7, one particular correlation behavior of the
meal overall patterns from their 10 different characteristics
(Figure 5) can be observed. The breakfast is similar but has
differences from lunch (R=84%) and from dinner (R = 79%),
where R is the correlation coefficient. However, lunch and
dinner are highly correlated with each other (R = 98%). This
phenomenon is similar to the stock price situation of three
hypothetical publicly listed companies with different names
Figure 7: Correlation study among 3 meal character differences.
of breakfast, lunch, and dinner. Two company performances,
lunch and dinner, are quite similar companies with similar
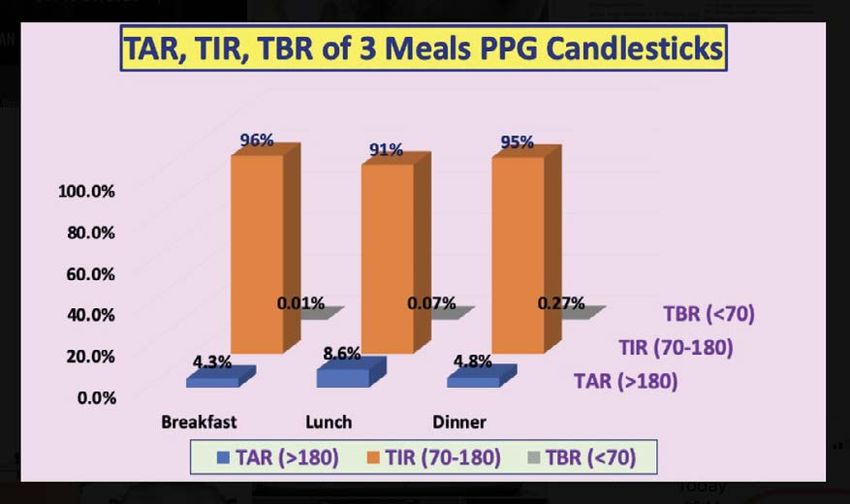
Figure 8: TAR, TIR, TBR safety study of Candlesticks of 3 meals.
product lines and belong to the same market. The lunch values
are higher than dinner values probably due to some differences
existed in their product quality (such as carbs/sugar amount).
However, the breakfast pattern is quite different from both
lunch and dinner which is similar to a third company with a
vastly diverse product line to serve a different market. Indeed,
the author’s breakfast nutritional ingredients are vastly
different from his lunches and dinners.
Finally, in Figure 8, it illustrates his TIR analysis demonstration
based on the American Diabetes Association’s new guideline
regarding TAR (> 180 mg/dL), TIR (70 - 180 mg/dL), and TAR
(< 70 mg/dL). His TIR percentages are in the range of 91% to
96% which means his T2D conditions control has been highly
effective during this reporting period. His TAR percentages
are in the low range of 4.3% to 8.6% (lunch) which means
Figure 6: 10 differences among 5 key characters of 3 meal his chances of having hyperglycemia damage is quite low. His
Postprandial Plasma Glucose (PPG).
TBR percentages are in the smallest range of 0.01% to 0.27%
J Nutr Diet Pract 5 Volume 4(3): 2020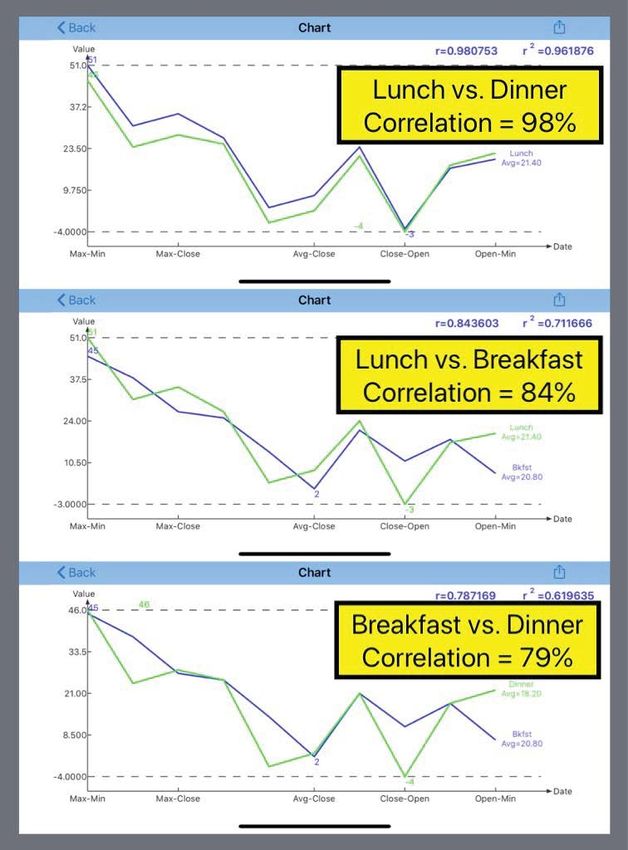
Hsu GC (2020) Comparison Study of PPG Characteristics from Candlestick Model Using GH-Method: Math-Physical Medicine

which means his chance of having insulin shock is near zero.         phenomena, derivation of mathematical equations, utilization
It should be emphasized that the author has ceased taking any        of various computational tools, and finally combined with
diabetes medication since 12/8/2015. Therefore, all of the           the discovery of biomedical interpretations have been proven
above discovered biomedical phenomena are under “medicine-           repeatedly in the author’s previous 260 medical papers.
free” conditions. This Figure 7 has graphically summarized his
                                                                     References
overall diabetes safety analysis.
                                                                     1. Hsu GC, eclaireMD Foundation, USA: No.76 “Using Candlestick
Conclusion                                                              Charting Techniques to Investigate Glucose Behaviours (GH-
                                                                        Method: Math-Physical Medicine)”. [View Article]
This paper has further demonstrated the power of using both
the Wall Street candlestick model and GH-Method: Math-               2. Hsu, Gerald C, eclaireMD Foundation, USA: No.238 “The
Physical Medicine approach to observe and analyze the PPG               influences of medication on diabetes control using TIR analysis
phenomena. The methodology of observation for the physical              (GH-Method: Math-physical medicine)”. [View Article]

Citation: Hsu GC (2020) Comparison Study of PPG Characteristics from Candlestick Model Using GH-Method: Math-Physical
Medicine. J Nutr Diet Pract 4: 001-006.
Copyright: © 2020 Hsu GC. This is an open-access article distributed under the terms of the Creative Commons Attribution
License, which permits unrestricted use, distribution, and reproduction in any medium, provided the original author and source
are credited.

J Nutr Diet Pract                                                6                                                   Volume 4(3): 2020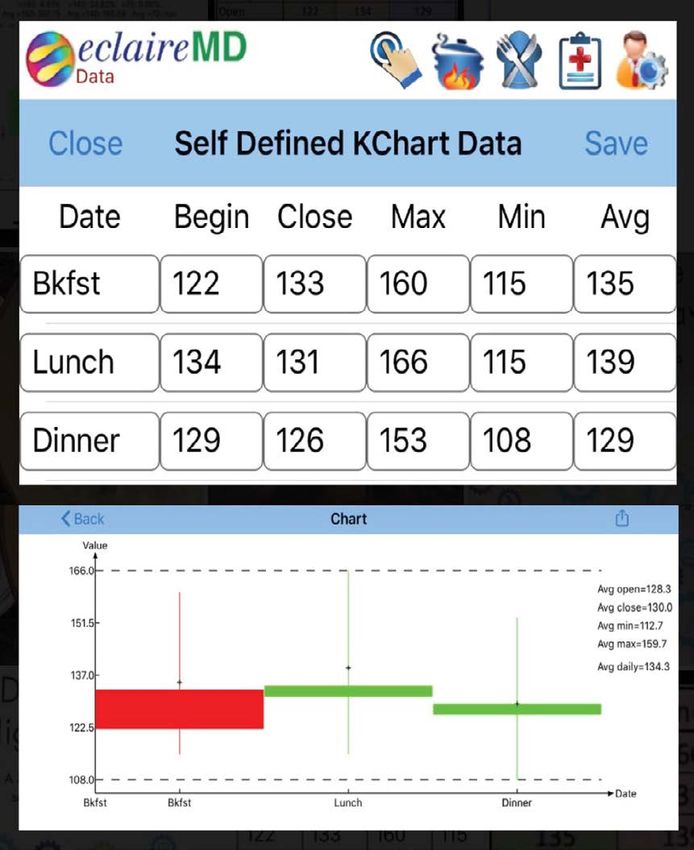
You can also read