Precise quantification of Ion Torrent libraries on the QuantStudio 3D Digital PCR System
←
→
Page content transcription
If your browser does not render page correctly, please read the page content below
APPLICATION NOTE                                                        QuantStudio™ 3D Digital PCR System

Precise quantification of Ion Torrent™ libraries
on the QuantStudio™ 3D Digital PCR System

Introduction
The template preparation step in the next-generation
sequencing (NGS) workflow is critical to obtaining
optimal sequencing yields on the Ion PGM™ and Ion
Proton™ platforms and is highly dependent on the
library input amount. Library concentrations that
are too high or too low lead to reduced total reads
and reduce the overall throughput of the system.
As a result, an accurate and precise method for
quantifying high-quality libraries prior to template
preparation is critical to maximizing throughput from
a sequencing run.

Digital PCR (dPCR) offers a highly precise
quantification approach without the need for a
reference or standard curve. In combination with a       • Highly precise and reproducible quantification
prevalidated assay for quantification of Ion Torrent™      without the need for a standard curve or
libraries, the chip-based QuantStudio™ 3D Digital PCR      reference sample
System is perfectly suited for this application.         • Minimal sample handling, reducing hands-on time
The QuantStudio™ 3D Digital PCR Chip works by            • Sealed chip–based consumable, minimizing
distributing a standard PCR reaction mix into 20,000       contamination from amplicons or other
individual PCR reactions. Up-front sample dilution         contaminating nucleic acids
ensures that a portion of these partitions contain       • Highly affordable system and consumables, which
the target molecule, while other partitions do not,        may lead to cost savings when the consequences of
leading to positive and negative reactions. Following      suboptimal sequencing runs are considered
amplification on a dual flat block thermal cycler,
the fraction of negative reactions is used to quantify   This application note describes a simple workflow
the number of target molecules in the sample, all        for quantifying Ion Torrent™ NGS libraries using the
without reference to standards or controls.              QuantStudio™ 3D Digital PCR System. This workflow
                                                         enables consistent sequencing data on the Ion PGM™
The key advantages of the QuantStudio™ 3D Digital        or Ion Proton™ System, resulting in savings in both
PCR System for quantifying NGS libraries include         time and cost when there is no need to repeat the
the following:                                           template bead preparation step.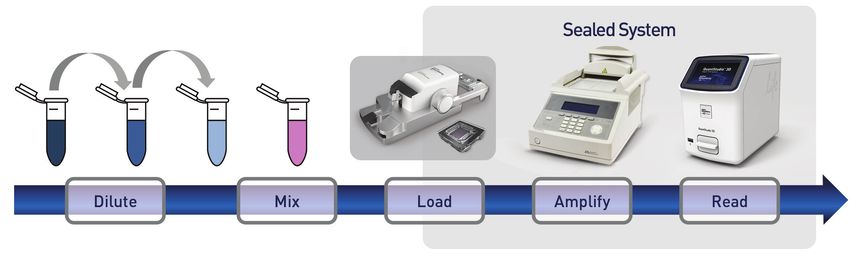
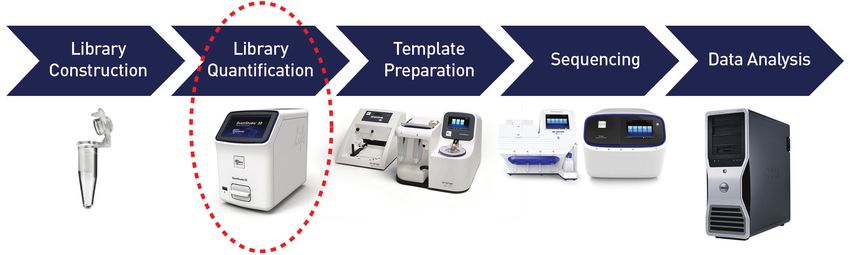
Figure 1. NGS workflow incorporating the QuantStudio™ 3D system to accurately quantify NGS libraries prior to template preparation on the
Ion OneTouch™ 2 System.

Library quantification in the Ion Torrent™                              concentration leads to decreased data yields from
NGS workflow                                                            a sequencing run. Current detection methods
The NGS workflow is illustrated in Figure 1.                            for quantifying NGS libraries, such as the Agilent
In summary, once a high-quality library has been                        Bioanalyzer® instrument or spectrophotometer
constructed, the QuantStudio™ 3D Digital PCR System                     readings, are not able to specifically measure only
is used to quantify the number of sequenceable                          those fragments that have incorporated both library
molecules. Based upon this result, the library is diluted               adapters, which commonly results in an overestimation
to a level consistent with template bead preparation                    of concentration.
recommendations using the Ion OneTouch™ 2 System.                       Using TaqMan® chemistry for library quantification
This is followed by sequencing on the Ion PGM™ or                       alleviates this problem as the TaqMan® Assay is
Ion Proton™ System. Finally, the sequenced reads are                    designed to span both the P1 and A adapters
analyzed on the Torrent Suite™ Server.                                  (Figure 2). This approach limits quantification to
QuantStudio™ 3D Digital PCR System for                                  constructs containing both adapter sequences. TaqMan®
Ion Torrent™ library quantification                                     Assays may be individually designed to quantify other
                                                                        NGS libraries, provided the probe and primer sequences
Assay design                                                            are all complementary to the appropriate adapter
Precise quantification of NGS libraries is critical for                 sequences on the library. Once the assay has been
maximizing template bead preparation efficiency.                        designed, it is used directly in the QuantStudio™ 3D
An underestimation or overestimation of the library                     digital PCR workflow.

                                  Probe
                FP

                            P1                            Sequence of Interest                                   A

                                                                                                                     RP
Figure 2. Schematic showing TaqMan® Assay design for Ion Torrent™ library quantification on the QuantStudio™ 3D Digital PCR System.
The assay is composed of a forward primer (FP), reverse primer (RP), and TaqMan® probe all complementary to the library P1 and A
adapter sequences.
QuantStudio™ 3D Digital PCR System workflow
The QuantStudio™ 3D system workflow for quantifying NGS library concentration is a simple process (Figure 3).

Figure 3. The QuantStudio™ 3D Digital PCR System workflow for NGS library quantification. The QuantStudio™ 3D Digital PCR System workflow
for NGS library quantification begins with diluting the library such that it falls within the digital range. Then, the reaction mix is formulated by
mixing the diluted sample with the QuantStudio™ 3D Digital PCR master mix and the TaqMan® Assay. The reaction mix is then loaded onto the
chip using the QuantStudio™ 3D Chip Loader. The sealed chip is then amplified on a dual flat block thermal cycler and results read directly on the
QuantStudio™ 3D instrument. AnalysisSuite™ Cloud Software is used to visualize the data and display the target concentration.

The first step in library quantification using dPCR is
to dilute the library such that it falls within the digital
range. This is necessary to ensure that, on average
across the chip, there are between 0.1 and 1.7 copies per
reaction (Figure 4). If the dilution is outside of this range,
the level of precision around the measurement will be
diminished. As a general guideline, we recommend
starting with a 1 to 200,000 dilution of the library in 1X
TE in order to be within this range. Based on this initial
reading, dilutions may be adjusted above or below the
1 to 200,000 dilution, should the resulting value not fall
within the digital range for a particular library.
                                                                            Figure 4. QuantStudio™ 3D AnalysisSuite™ Software depicting the
The reaction mix is formulated by mixing diluted sample                     copies per reaction (circled) for each sample.
with QuantStudio™ 3D Digital PCR Master Mix and the
TaqMan® Assay (Table 1). The reaction mix is loaded on                      Table 1. Volumes of reagents necessary to set up your digital
a QuantStudio™ 3D Digital PCR 20K Chip and the chip                         PCR experiment.
is assembled. The sealed chip is amplified on a dual
                                                                             Component                                           Volume (µL)
flat block thermal cycler and the results are read on a
QuantStudio™ 3D Digital PCR Instrument. Lastly, the data
                                                                             2X master mix                                            7.5
is visualized using the QuantStudio™ 3D AnalysisSuite™
Cloud Software, which displays the target concentration.                     20X assay                                               0.75
For a detailed description of running a digital PCR
experiment, please refer to the QuantStudio™ 3D Digital                      1X TE                                                   4.75
PCR System User Guide (Pub. No. MAN0007720). See
                                                                             Diluted sample                                             2
“Ordering information” for the list of products used for
NGS library quantification with the QuantStudio™ 3D
                                                                             Total                                                     15
Digital PCR System.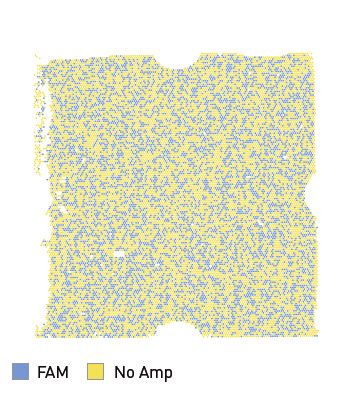
Interpretation of results                                                     artifacts. The chip view can be toggled between “Color
Four different library types were tested in this                              by Quality” (Figure 5A) and “Color by Call” (Figure 5B).
study: Ion DNA Fragment, Ion AmpliSeq™ Exome, Ion                             The “Color by Quality” view confirms loading uniformity
AmpliSeq™ Comprehensive Cancer Panel, and Ion                                 and image quality. Wells with lower quality scores are
AmpliSeq™ Cancer HotSpot Panel Version 2. Library                             automatically filtered out in the chip image heat map.
sizes ranged from ~100 to ~700 bp as determined by                            Note that, although not recommended for most chips,
an Agilent 2100 Bioanalyzer® instrument. The same                             the quality score threshold applied can be manually
library quantification workflow, as documented in this                        adjusted to increase or decrease the number of wells
application note, was used for all libraries tested.                          filtered from the analysis. The “Color by Call” chip
                                                                              view confirms a random distribution of amplified and
Data QC                                                                       nonamplified wells across the chip.
Integral to the QuantStudio™ 3D Digital PCR System
                                                                            • The “Histogram view” (Figure 5C) shows the dis-
workflow is an assessment of data quality coming
                                                                              crimination between the nonamplified and amplified
from the instrument, where lower-quality data is
                                                                              populations and confirms that the threshold separating
automatically flagged on the QuantStudio™ 3D Digital
                                                                              the two populations has been correctly set by the soft-
PCR Instrument itself. Data can be further reviewed
                                                                              ware. If not, this can be manually adjusted by the user.
in the AnalysisSuite™ Cloud Software to confirm final
quality in two ways:                                                        The images shown in Figure 5 are for a successful
                                                                            experiment in which all QC metrics meet the
• The “Chip view” functionality, found on the “Review
                                                                            desired outcome.
  Quality” tab, is used to inspect the chip image for

Chip view (A)                          Chip view (B)                         Chip view (C)

Figure 5. Alternative views in the Absolute Quantification application module of the QuantStudio™ 3D AnalysisSuite™ Software. (A) Image
of the chip view depicting color by quality, which indicates the quality of loading on a chip. This particular chip is classified as high-quality
loading due to the uniformity of the filled wells across the chip. (B) Example of a chip view depicting color by calls, which shows the
distribution of both the FAM™ signal (amplified) and the unamplified wells. Note that a random distribution of FAM™ signal across the chip
is ideal. Any other signal patterns could indicate possible loading issues or leaking of the immersion fluid from the chip. (C) The histogram
view has two populations: the larger yellow population corresponds to the unamplified wells with a lower fluorescence, and the smaller blue
population corresponds to the amplified wells with a significantly higher fluorescence. The separation between unamplified and amplified
populations is indicative of good discrimination.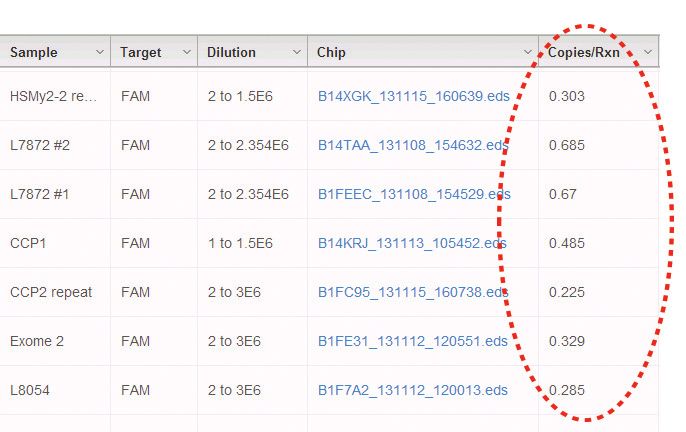
Quantification                                                           (1) sample dilution prior to preparing the reaction mix,
Prior to determining the final library concentration, data               and (2) dilution that occurs when the reaction mix is
must be adjusted to take into consideration the degree of                formulated (Figure 6).
sample dilution made prior to chip loading. This process
is simplified in AnalysisSuite™ Software by entering the                 For example, if your sample was originally diluted 1 to
dilution factor for each sample in the “Define Chips”                    200,000 and 2 µL of the diluted sample was added to
tab. To correctly calculate the dilution factor for each                 a total of 15 µL, then a dilution factor of 1 to 1,500,000
sample, two components must be taken into account:                       should be entered into the software (Figures 6 and 7).

                            Sample dilution                                              Dilution on the chip

                                                                                                          2X Master Mix
                                                                                                          20X Assay
                                                                                                          Sample = 2 µL
                                                                                                          1X TE
                                                                                                          Total = 15 µL

                                                 1 in 200,000

                          Dilution factor = Sample dilution x Dilution on the chip
                                                                  = 200,000 x (15/2) = 1,500,000
                             Dilution factor to enter into software: 1 to 1,500,000
Figure 6. Sample calculation of a dilution factor.

Figure 7. QuantSudio™ 3D AnalysisSuite™ Software interface. The red oval indicates the column where the dilution factor is added for each
sample in the “Define Chips” tab.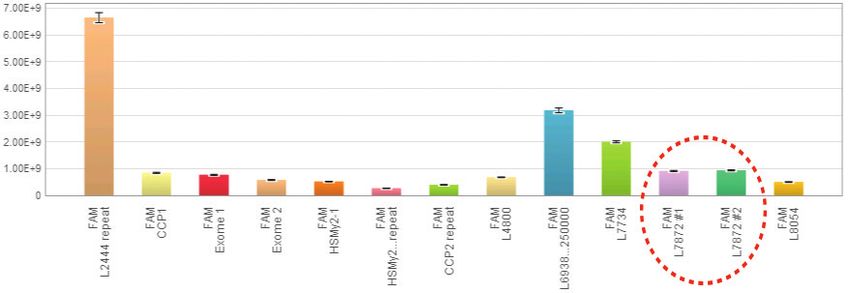
Copies/µL

                                                               Sample target

Figure 8. Calculated copies/µL of various library types by QuantStudio™ 3D AnalysisSuite™ Software. The software takes into account the
dilution factor used when defining chips. Error bars indicate 95% confidence level for each sample. The red oval indicates replicate chips for
sample L7872.

AnalysisSuite™ Software will calculate a concentration                     Step 1: Convert library size into ng/copy
in copies/µL and graphically represent the data                             Genome/template          1 bp          Convert Mb         Convert g
(Figure 8). The graphical representation of the                                mass in Mb            mass           to bases            to pg

concentration is located in the “Results” section of
the “See Results” tab. The software provides a 95%                         (0.000696 Mb/copy) x (1.096 x 10⁻²¹ g/bp) x (1 x 10⁶ bp/Mb) x (1 x 10¹² pg/g)
confidence range for each sample concentration                             = 7.63 x 10⁻⁷ pg/copy or 7.63 x 10⁻¹⁰ ng/copy
as calculated by Poisson statistics. As a test of the
reproducibility of the system, two replicates were
                                                                           Step 2: Convert copies/µL from digital PCR to ng/µL
performed for sample L7872. Comparison of the results
confirms high reproducibility, as highlighted by the red                      Copies/µL from
                                                                                                      ng/copy
                                                                                digital PCR
oval in Figure 8.

The final step in the quantification process is to convert                 (922,000,000 copies/µL) x (7.63 x 10⁻¹⁰ ng/copy) = 0.703 ng/µL
the copies/µL provided by the QuantStudio™ 3D Digital
PCR System to a molar concentration as required for
the template preparation step. Figure 9 shows how to                       Step 3: Convert ng/µL to nM

convert copies/µL to nM so that you may proceed to the                       Calculated ng/µL
                                                                                                Convert      Average MW       Fragment
                                                                                                 µL to L    of 1 nucleotide   size in bp
template preparation step of the NGS workflow.

                                                                           (0.703 ng/µL) x (106 µL/L) x (1 nmol/660 ng) x (1/696) = 1.53 nM

                                                                           Figure 9. Calculations for converting the values in copies/µL
                                                                           generated by the QuantStudio™ 3D AnalysisSuite™ Software to
                                                                           concentration in nM.
To measure the efficacy of quantification by dPCR to that
of qPCR, we compared the concentrations of several
Concentration by dPCR (nM)
different libraries as measured by these two methods.
The correlation between the two methods is excellent,
with an R2 value of 0.9245 (Figure 10). These data
indicate that both library size and type do not have an
impact on library quantification with the QuantStudio™ 3D
Digital PCR System.
Correlation between dPCR quantification and template
bead preparation
Based on the calculated concentration (nM), an
appropriate dilution of the library is necessary for Concentration by qPCR (nM)
template bead preparation using the Ion OneTouch™
2 System. For a detailed description of using the Figure 10. Correlation between the concentration (nM) as determined
by qPCR and dPCR. An R2 value of 0.9245 indicates high correlation.
Ion OneTouch™ 2 System, please refer to the Ion
PGM™ Template OT2 200 Kit user guide (Pub. No.
MAN0007220), the Ion PGM™ Template OT2 400 Kit user The digital PCR concentrations obtained were compared
guide (Pub. No. MAN0007218), or the Ion PI™ Template to the Ion OneTouch™ 2 template bead preparation
OT2 200 Kit v3 user guide (Pub. No. MAN0009133). After results for three of the libraries that were used in
template bead preparation, a quality control step is this study (Table 2). As a result of incorporating the
necessary to assess the quality of the templated beads prequantification step using the QuantStudio™ 3D
generated in a sample prior to enrichment using either Digital PCR System, all three libraries showed a
a flow cytometer or the Qubit® 2.0 Fluorometer. The tight templated bead range between 10% and 14% as
optimal library quantification corresponds to the library determined by flow cytometry. This confirms that the
dilution that results in 10–30% of beads containing QuantStudio™ 3D Digital PCR System measurement is
amplified template. Samples that fall within the sufficient for adjusting library concentration prior to
recommended range generally produce higher quality the critical template bead preparation step of the Ion
data. Samples that contain templated beads below 10% Torrent™ NGS workflow. The precise quantification that
have an insufficient number of beads to achieve optimal the QuantStudio™ 3D Digital PCR System provides can
loading density on the Ion Torrent™ chip, which leads reduce the need to repeat Ion OneTouch™ 2 reactions,
to decreased sequencing yields. Samples that contain which can lead to a significant cost and time savings.
templated beads above 30% will yield multi-templated
beads or mixed reads, which reduces the throughput
due to an increase in filtered reads.
Table 2. Correlation of QuantStudio™ 3D Digital PCR data with that of Ion OneTouch™ 2 data. These quality control data were generated using flow
cytometry for three Ion Torrent™ libraries prior to enrichment.
Sample name Library type (size) Digital PCR concentration Templated beads pre-enrichment
L7734 Fragment (276 bp) 3.32 nM 12.1%
L4800 Fragment (489 bp) 1.12 nM 13.6%
L2444 Fragment (322 bp) 11.03 nM 10%Conclusions By replacing the Ion Torrent™–specific assay design
Precise library quantification is a critical step prior described here with a similarly designed assay specific
to template bead preparation. Inclusion of too much to the adapter sequences in use, the approach described
or too little library into the template preparation step in this study can also be used to quantify libraries from
impacts the clonal expansion step, leading to suboptimal other platforms.
sequencing yields. This application note describes a
Reference
simple digital PCR workflow combined with a carefully
designed TaqMan® Assay that can be used to precisely 1. Pohl G, Shih IM (2004) Principle and applications of digital PCR. Expert
and accurately quantify high-quality libraries of varying Rev Mol Diagn 4:41–47.
size and type. The QuantStudio™ 3D Digital PCR System
is ideally suited for the quantification of Ion Torrent™ NGS
libraries for the following reasons:
• Precise quantification without the need for a reference
• Precise quantification that results in a greater success
rate of the template bead preparation step and overall
sequencing results
• Easy workflow with minimum hands-on time
• Affordable system and consumables
Ordering information
Product Cat. No.
QuantStudio™ 3D Digital PCR System, Premium Package 4482593
Ion Torrent™ TaqMan® Library Quantification Assay, 20X, Assay ID: Ac04347676_a1 4331182
QuantStudio™ 3D Digital Chip Kit (included in premium package) 4482603
QuantStudio™ 3D Digital PCR UV Sealing Kit (included in premium package) 4488475
QuantStudio™ 3D Digital PCR Tilt Base for GeneAmp® PCR System 9700
4486414
(included in premium package)
QuantStudio™ 3D Digital PCR Chip Adapter Kit for GeneAmp® PCR System 9700
4485513
(included in premium package)
QuantStudio™ 3D Digital PCR Chip Loader (included in premium package) 4482592
Find out more at lifetechnologies.com/digitalpcr
For Research Use Only. Not for use in diagnostic procedures. © 2014 Thermo Fisher Scientific Inc. All rights reserved. All trademarks are the property
of Thermo Fisher Scientific and its subsidiaries unless otherwise specified. Bioanalyzer is a registerd trademark of Agilent Technologies, Inc. TaqMan is a
registered trademark of Roche Molecular Systems, Inc., used under permission and license. CO28554 0314You can also read